Hybrid/Remote Terraform Contract Job Trends

Terraform
UK > Work from Home

The table below provides summary statistics and contractor rates for remote or hybrid contract work requiring Terraform skills. It covers vacancies from the 6 months leading up to 21 September 2025, with comparisons to the same periods in the previous two years.

6 months to
21 Sep 2025
Same period 2024 Same period 2023
Rank 30 39 37
Rank change year-on-year +9 -2 -1
Contract jobs citing Terraform 611 581 1,045
As % of all contract jobs with a WFH option 6.30% 4.59% 5.14%
As % of the Systems Management category 39.39% 33.80% 33.22%
Number of daily rates quoted 401 433 812
10th Percentile £400 £425 £425
25th Percentile £438 £500 £500
Median daily rate (50th Percentile) £525 £550 £575
Median % change year-on-year -4.55% -4.35% -4.17%
75th Percentile £600 £675 £663
90th Percentile £688 £738 £738
UK median daily rate £525 £550 £576
% change year-on-year -4.55% -4.51% -4.00%
Number of hourly rates quoted 3 1 13
10th Percentile £39.40 - -
25th Percentile £44.50 £57.50 £39.60
Median hourly rate £56.00 £60.00 £62.50
Median % change year-on-year -6.67% -4.00% +19.05%
75th Percentile £65.75 £62.50 £66.00
90th Percentile £69.80 - £71.25
UK median hourly rate £59.25 £74.00 £75.00
% change year-on-year -19.93% -1.33% +44.93%

All Systems Management Skills
Work from Home

Terraform falls under the Systems Management category. For comparison with the information above, the following table provides summary statistics for all contract job vacancies with remote or hybrid options requiring systems management skills.

Contract vacancies with a requirement for systems management skills 1,551 1,719 3,146
As % of all contract jobs with a WFH option 15.98% 13.57% 15.49%
Number of daily rates quoted 999 1,188 2,325
10th Percentile £363 £360 £375
25th Percentile £419 £450 £463
Median daily rate (50th Percentile) £513 £530 £550
Median % change year-on-year -3.30% -3.64% -4.35%
75th Percentile £600 £631 £675
90th Percentile £675 £725 £750
UK median daily rate £500 £525 £550
% change year-on-year -4.76% -4.55% -4.35%
Number of hourly rates quoted 21 6 66
10th Percentile £30.00 £37.13 £22.86
25th Percentile £33.00 £41.00 £39.60
Median hourly rate £57.50 £52.50 £62.50
Median % change year-on-year +9.52% -16.00% +19.05%
75th Percentile £63.75 £56.88 £73.44
90th Percentile £67.00 £60.00 £78.46
UK median hourly rate £28.25 £40.00 £55.00
% change year-on-year -29.38% -27.27% +130.03%

Terraform
Trend for Jobs with a WFH Option

Job vacancies with remote working options citing Terraform as a proportion of all IT jobs advertised.
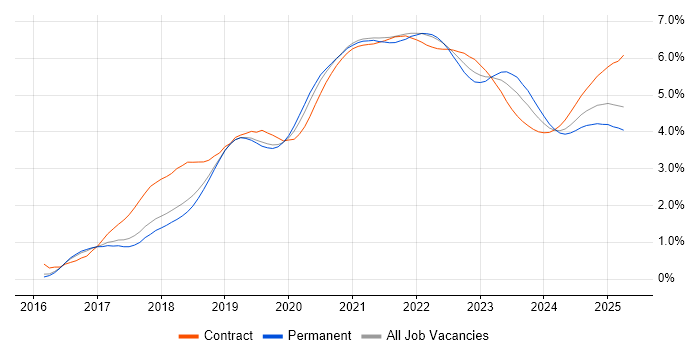
Terraform trend for jobs with Hybrid/Remote/WFH options

Terraform
Daily Rate Trend for Jobs with Hybrid Work Options

Contractor daily rate distribution trend for jobs with remote work options citing Terraform.

Contractor daily rate distribution trend for jobs with remote work options citing Terraform

Terraform
Daily Rate Histogram for Jobs with a WFH Option

Daily rate distribution for jobs with remote working options citing Terraform over the 6 months to 21 September 2025.

Terraform daily rate histogram for jobs with a WFH option

Terraform
Hourly Rate Trend for Jobs with Hybrid Work Options

Contractor hourly rate distribution trend for jobs with remote work options citing Terraform.

Contractor hourly rate distribution trend for jobs with remote work options citing Terraform

Terraform
Hourly Rate Histogram for Jobs with a WFH Option

Hourly rate distribution for jobs with remote working options citing Terraform over the 6 months to 21 September 2025.

Terraform hourly rate histogram for jobs with a WFH option

Terraform
Co-occurring Skills and Capabilities with WFH Options by Category

The follow tables expand on the table above by listing co-occurrences grouped by category. The same employment type, locality and period is covered with up to 20 co-occurrences shown in each of the following categories:

Application Platforms
1 18 (2.95%) Apache Airflow
2 13 (2.13%) Confluence
3 12 (1.96%) OpenStack
4 8 (1.31%) Apache Spark
5 7 (1.15%) Apache
5 7 (1.15%) Documentum
5 7 (1.15%) FileNet
6 5 (0.82%) SharePoint
7 3 (0.49%) nginx
8 2 (0.33%) CMS
8 2 (0.33%) Gunicorn
8 2 (0.33%) Microsoft Exchange
8 2 (0.33%) WordPress
9 1 (0.16%) Drupal
9 1 (0.16%) IIS
9 1 (0.16%) Jupyter
9 1 (0.16%) Tomcat
9 1 (0.16%) WebLogic
Applications
1 3 (0.49%) MS Visio
2 2 (0.33%) Chatbot
2 2 (0.33%) Microsoft PowerPoint
3 1 (0.16%) Microsoft Office
3 1 (0.16%) Mozilla Thunderbird
3 1 (0.16%) Notion
3 1 (0.16%) Trello
Business Applications
1 1 (0.16%) Distributed Ledger
1 1 (0.16%) SAP HCM
1 1 (0.16%) SAP IBP
1 1 (0.16%) SAP PM
1 1 (0.16%) SAP S/4HANA
Cloud Services
1 339 (55.48%) AWS
2 213 (34.86%) Azure
3 170 (27.82%) GitHub
4 108 (17.68%) GitHub Actions
5 97 (15.88%) AWS CloudFormation
6 90 (14.73%) Serverless
7 87 (14.24%) Azure DevOps
8 76 (12.44%) GCP
9 73 (11.95%) Amazon S3
10 67 (10.97%) Amazon CloudWatch
10 67 (10.97%) Amazon EC2
11 52 (8.51%) Amazon EKS
12 51 (8.35%) AWS Lambda
13 43 (7.04%) Entra ID
14 42 (6.87%) Virtual Private Cloud
15 36 (5.89%) Azure AKS
16 34 (5.56%) OpenShift
17 31 (5.07%) Amazon SQS
18 30 (4.91%) Google Kubernetes Engine
19 29 (4.75%) PaaS
Communications & Networking
1 53 (8.67%) Firewall
2 36 (5.89%) VPN
3 34 (5.56%) DNS
4 26 (4.26%) TCP/IP
5 25 (4.09%) Network Security
6 17 (2.78%) SSL
7 14 (2.29%) HTTP
8 13 (2.13%) WAN
9 12 (1.96%) BGP
10 10 (1.64%) LAN
11 9 (1.47%) Internet
11 9 (1.47%) OSPF
12 6 (0.98%) MPLS
12 6 (0.98%) SNMP
12 6 (0.98%) TACACS
12 6 (0.98%) Wireless
13 5 (0.82%) F5 BIG-IP LTM
13 5 (0.82%) Software-Defined Networking
14 4 (0.65%) HTTPS
14 4 (0.65%) SSH
Database & Business Intelligence
1 54 (8.84%) Amazon RDS
2 41 (6.71%) PostgreSQL
3 27 (4.42%) NoSQL
4 20 (3.27%) Amazon Aurora
5 16 (2.62%) Azure SQL Database
5 16 (2.62%) Data Lake
5 16 (2.62%) DynamoDB
5 16 (2.62%) MongoDB
6 14 (2.29%) Data Warehouse
7 13 (2.13%) SQL Server
8 12 (1.96%) Power BI
9 11 (1.80%) Elasticsearch
9 11 (1.80%) MySQL
9 11 (1.80%) Oracle Database
10 10 (1.64%) Amazon Redshift
11 9 (1.47%) BigQuery
12 8 (1.31%) Delta Lake
12 8 (1.31%) Redis
13 6 (0.98%) Amazon Athena
13 6 (0.98%) Big Data
Development Applications
1 143 (23.40%) Jenkins
2 126 (20.62%) GitLab
3 56 (9.17%) Git
4 38 (6.22%) SonarQube
5 33 (5.40%) JIRA
6 12 (1.96%) CircleCI
6 12 (1.96%) Snyk
7 11 (1.80%) Cypress.io
8 8 (1.31%) Sonatype Nexus
9 7 (1.15%) JUnit
9 7 (1.15%) Selenium
9 7 (1.15%) Terragrunt
10 6 (0.98%) Artifactory
11 5 (0.82%) Bitbucket
11 5 (0.82%) Cucumber
11 5 (0.82%) Gatling
11 5 (0.82%) JMeter
11 5 (0.82%) Mockito
11 5 (0.82%) REST Assured
12 4 (0.65%) NUnit
General
1 153 (25.04%) Social Skills
2 78 (12.77%) Public Sector
3 75 (12.27%) Finance
4 47 (7.69%) Analytical Skills
5 28 (4.58%) Banking
6 16 (2.62%) Telecoms
7 15 (2.45%) Documentation Skills
8 12 (1.96%) Marketing
9 10 (1.64%) Inclusion and Diversity
10 9 (1.47%) Financial Institution
11 7 (1.15%) Manufacturing
12 5 (0.82%) Electronics
12 5 (0.82%) Law
12 5 (0.82%) Police
12 5 (0.82%) Publishing
13 4 (0.65%) Legal
13 4 (0.65%) Military
13 4 (0.65%) Retail
14 3 (0.49%) Investment Banking
14 3 (0.49%) Pharmaceutical
Job Titles
1 174 (28.48%) DevOps Engineer
2 97 (15.88%) Senior
3 83 (13.58%) Architect
4 76 (12.44%) AWS Engineer
5 71 (11.62%) Developer
6 45 (7.36%) AWS DevOps
7 43 (7.04%) AWS DevOps Engineer
7 43 (7.04%) Lead
8 42 (6.87%) Azure Engineer
8 42 (6.87%) Cloud Engineer
9 32 (5.24%) Senior DevOps
9 32 (5.24%) Senior DevOps Engineer
10 29 (4.75%) Infrastructure Engineer
11 27 (4.42%) Data Engineer
12 24 (3.93%) GCP Engineer
12 24 (3.93%) Software Engineer
13 23 (3.76%) AWS Architect
14 21 (3.44%) Platform Engineer
15 20 (3.27%) Solutions Architect
15 20 (3.27%) Technical Architect
Libraries, Frameworks & Software Standards
1 37 (6.06%) REST
2 36 (5.89%) Kafka
3 34 (5.56%) .NET
3 34 (5.56%) Elastic Stack
4 30 (4.91%) React
5 29 (4.75%) Node.js
6 28 (4.58%) OAuth
7 27 (4.42%) RESTful
8 26 (4.26%) ARM Templates
9 23 (3.76%) OpenID
10 21 (3.44%) AWS CDK
11 16 (2.62%) .NET Core
11 16 (2.62%) Keycloak
11 16 (2.62%) OAuth2
12 13 (2.13%) Spring Boot
13 12 (1.96%) PySpark
13 12 (1.96%) SAML
13 12 (1.96%) SOAP
14 11 (1.80%) Spring
14 11 (1.80%) YAML
Miscellaneous
1 85 (13.91%) Cloud Native
2 28 (4.58%) Hybrid Cloud
3 20 (3.27%) Distributed Systems
4 17 (2.78%) Data Centre
5 16 (2.62%) Legacy Systems
5 16 (2.62%) Product Ownership
6 14 (2.29%) Greenfield Project
6 14 (2.29%) Public Cloud
7 12 (1.96%) Onboarding
8 11 (1.80%) Enterprise Software
9 10 (1.64%) Linux Command Line
10 9 (1.47%) Legacy Applications
11 8 (1.31%) NHS
11 8 (1.31%) Replication
12 6 (0.98%) Clustering
12 6 (0.98%) Management Information System
12 6 (0.98%) Private Cloud
13 5 (0.82%) AI Agents
13 5 (0.82%) Security Posture
13 5 (0.82%) Self-Motivation
Operating Systems
1 110 (18.00%) Linux
2 33 (5.40%) Windows
3 24 (3.93%) Red Hat Enterprise Linux
4 14 (2.29%) Unix
5 7 (1.15%) VMS
5 7 (1.15%) Windows Server
6 5 (0.82%) Mac OS
7 4 (0.65%) SUSE
8 3 (0.49%) Amazon Linux
8 3 (0.49%) Ubuntu
9 2 (0.33%) CentOS
9 2 (0.33%) Windows Server 2019
10 1 (0.16%) Android
10 1 (0.16%) Apple iOS
10 1 (0.16%) Debian
10 1 (0.16%) Oracle Linux
10 1 (0.16%) Solaris
10 1 (0.16%) Windows Server 2016
Processes & Methodologies
1 389 (63.67%) DevOps
2 374 (61.21%) Infrastructure as Code
3 359 (58.76%) CI/CD
4 167 (27.33%) Agile
5 160 (26.19%) Containerisation
6 101 (16.53%) Migration
7 75 (12.27%) Infrastructure Automation
8 74 (12.11%) DevSecOps
9 70 (11.46%) Microservices
10 69 (11.29%) Problem-Solving
11 64 (10.47%) Observability
12 60 (9.82%) Mentoring
13 59 (9.66%) Cloud Security
14 57 (9.33%) Infrastructure Engineering
15 55 (9.00%) Configuration Management
16 54 (8.84%) Software Engineering
16 54 (8.84%) Test Automation
17 51 (8.35%) Artificial Intelligence
18 48 (7.86%) Continuous Integration
19 42 (6.87%) Platform Engineering
Programming Languages
1 251 (41.08%) Python
2 104 (17.02%) Bash
3 81 (13.26%) PowerShell
4 72 (11.78%) Java
5 69 (11.29%) SQL
6 40 (6.55%) Bicep
7 39 (6.38%) Go
8 34 (5.56%) JavaScript
9 32 (5.24%) C#
10 29 (4.75%) TypeScript
11 13 (2.13%) Shell Script
12 7 (1.15%) Kotlin
12 7 (1.15%) Rust
13 5 (0.82%) Groovy
14 3 (0.49%) Perl
14 3 (0.49%) Scala
15 2 (0.33%) C
15 2 (0.33%) C++
15 2 (0.33%) PHP
15 2 (0.33%) Ruby
Qualifications
1 180 (29.46%) Security Cleared
2 159 (26.02%) SC Cleared
3 34 (5.56%) AWS Certification
3 34 (5.56%) Degree
4 28 (4.58%) Azure Certification
5 25 (4.09%) Computer Science Degree
6 16 (2.62%) Cisco Certification
7 14 (2.29%) AWS Certified Solutions Architect
8 12 (1.96%) CCIE
9 11 (1.80%) JNCIE
9 11 (1.80%) Microsoft Certification
10 9 (1.47%) BPSS Clearance
11 6 (0.98%) CCNP
11 6 (0.98%) DV Cleared
11 6 (0.98%) Master's Degree
12 5 (0.82%) CISSP
13 4 (0.65%) AWS Certified DevOps Engineer
13 4 (0.65%) JNCIP
13 4 (0.65%) VCAP
14 3 (0.49%) AWS Certified SysOps Administrator
Quality Assurance & Compliance
1 35 (5.73%) GDPR
2 27 (4.42%) ISO/IEC 27001
3 22 (3.60%) QA
4 21 (3.44%) NIST
5 19 (3.11%) PCI DSS
6 12 (1.96%) Data Quality
7 11 (1.80%) SOC 2
8 9 (1.47%) Accessibility
9 8 (1.31%) HIPAA
10 4 (0.65%) GRC
10 4 (0.65%) NCSC
11 3 (0.49%) Sarbanes-Oxley
11 3 (0.49%) SLA
12 1 (0.16%) Actionable Recommendations
12 1 (0.16%) California Consumer Privacy Act
12 1 (0.16%) FedRAMP
12 1 (0.16%) Government Security Classifications
12 1 (0.16%) HL7
12 1 (0.16%) JSP 440
System Software
1 201 (32.90%) Docker
2 37 (6.06%) Active Directory
3 22 (3.60%) VMware Infrastructure
4 16 (2.62%) Virtual Machines
5 13 (2.13%) VMware NSX
6 9 (1.47%) Virtual Desktop
6 9 (1.47%) vSphere
7 8 (1.31%) VMware ESXi
8 3 (0.49%) Virtual Servers
9 2 (0.33%) Apache ZooKeeper
9 2 (0.33%) KVM
9 2 (0.33%) Squid
10 1 (0.16%) DFS Replication
10 1 (0.16%) Dovecot
10 1 (0.16%) Hyper-V
10 1 (0.16%) Postfix
10 1 (0.16%) XenApp
10 1 (0.16%) XenDesktop
Systems Management
1 266 (43.54%) Kubernetes
2 173 (28.31%) Ansible
3 78 (12.77%) Grafana
4 71 (11.62%) Prometheus
5 35 (5.73%) Argo
6 29 (4.75%) Puppet
7 24 (3.93%) Progress Chef
8 14 (2.29%) Istio
9 13 (2.13%) Single Sign-On
10 12 (1.96%) Microsoft Intune
11 10 (1.64%) Packer
12 6 (0.98%) Kibana
12 6 (0.98%) Nessus
12 6 (0.98%) Podman
12 6 (0.98%) vCenter Server
13 5 (0.82%) Consul
13 5 (0.82%) Docker Swarm
13 5 (0.82%) HP Fortify
13 5 (0.82%) Jamf Pro
14 4 (0.65%) Rancher
Vendors
1 69 (11.29%) Microsoft
2 42 (6.87%) Google
3 30 (4.91%) Red Hat
4 29 (4.75%) VMware
5 26 (4.26%) Oracle
6 23 (3.76%) F5
6 23 (3.76%) SAP
7 21 (3.44%) Databricks
8 20 (3.27%) Splunk
9 15 (2.45%) CheckPoint
9 15 (2.45%) Palo Alto
10 14 (2.29%) Cisco
11 12 (1.96%) Juniper
12 10 (1.64%) Dynatrace
13 8 (1.31%) Fortinet
13 8 (1.31%) Zscaler
14 6 (0.98%) Qualys
14 6 (0.98%) ServiceNow
15 5 (0.82%) Broadcom
15 5 (0.82%) OpenAI