Hybrid/Remote Test Automation Job Trends

Automated Testing
UK > Work from Home

The table below provides summary statistics and salary benchmarking for remote or hybrid work requiring Test Automation skills. It covers permanent job vacancies from the 6 months leading up to 26 November 2025, with comparisons to the same periods in the previous two years.

6 months to
26 Nov 2025
Same period 2024 Same period 2023
Rank 82 79 71
Rank change year-on-year -3 -8 -30
Permanent jobs citing Test Automation 480 685 880
As % of all permanent jobs with remote/hybrid work options 3.15% 3.45% 4.18%
As % of the Processes & Methodologies category 3.46% 3.83% 4.41%
Number of salaries quoted 288 403 718
10th Percentile £45,000 £37,923 £41,250
25th Percentile £51,250 £50,000 £47,500
Median annual salary (50th Percentile) £65,000 £64,000 £62,500
Median % change year-on-year +1.56% +2.40% +4.17%
75th Percentile £85,000 £77,500 £77,500
90th Percentile £95,000 £90,000 £95,000
UK median annual salary £65,000 £62,500 £62,968
% change year-on-year +4.00% -0.74% +4.95%

All Process and Methodology Skills
Work from Home

Test Automation falls under the Processes and Methodologies category. For comparison with the information above, the following table provides summary statistics for all permanent job vacancies with remote or hybrid options requiring process or methodology skills.

Permanent vacancies with a requirement for process or methodology skills 13,874 17,882 19,977
As % of all permanent jobs with a WFH option 90.99% 89.98% 94.97%
Number of salaries quoted 8,773 10,763 16,162
10th Percentile £29,500 £36,250 £36,500
25th Percentile £40,000 £46,250 £46,306
Median annual salary (50th Percentile) £57,500 £62,500 £62,500
Median % change year-on-year -8.00% - -
75th Percentile £77,500 £81,250 £80,000
90th Percentile £97,500 £100,000 £97,500
UK median annual salary £55,000 £60,000 £60,000
% change year-on-year -8.33% - -

Test Automation
Job Vacancy Trend for Remote/Hybrid Jobs

Historical trend showing the proportion of permanent IT job postings citing Test Automation and offering remote or hybrid work options relative to all permanent IT jobs advertised.
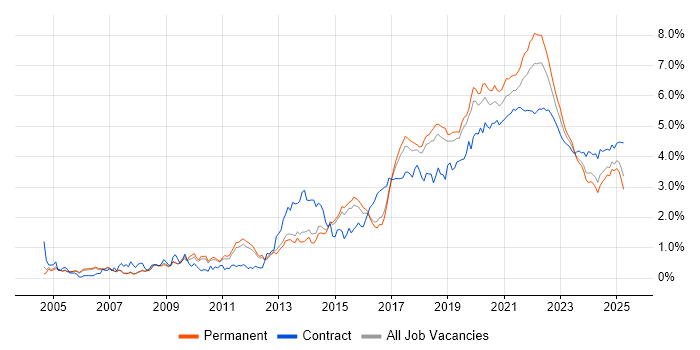
Test Automation job vacancy trend for remote/hybrid jobs

Test Automation
Salary Trend for Remote/Hybrid Jobs

Salary distribution trend for jobs with remote/hybrid work options citing Test Automation.

Salary distribution trend for jobs with remote/hybrid work options citing Test Automation

Test Automation
Salary Histogram for Remote/Hybrid Jobs

Salary distribution for jobs with remote/hybrid work options citing Test Automation over the 6 months to 26 November 2025.

Test Automation salary histogram for jobs with remote/hybrid work options

Test Automation
Co-Occurring Skills & Capabilities in Remote/Hybrid Jobs by Category

The following tables expand on the one above by listing co-occurrences grouped by category. They cover the same employment type, locality and period, with up to 20 co-occurrences shown in each category:

Application Platforms
1 12 (2.50%) Oracle SOA Suite
2 8 (1.67%) Headless CMS
3 7 (1.46%) Apache Solr
4 5 (1.04%) Confluence
5 4 (0.83%) Apache Airflow
6 3 (0.63%) Apache
7 2 (0.42%) Apache Spark
7 2 (0.42%) SharePoint
8 1 (0.21%) CMS
8 1 (0.21%) JBoss
8 1 (0.21%) Oracle Workflow
8 1 (0.21%) WordPress
Applications
1 4 (0.83%) Blender
1 4 (0.83%) Oracle Smart View
2 3 (0.63%) Microsoft Office
3 1 (0.21%) Chatbot
3 1 (0.21%) Microsoft Excel
Business Applications
1 33 (6.88%) Oracle ERP
2 12 (2.50%) Dynamics NAV
3 8 (1.67%) Shopify
4 6 (1.25%) Elite 3E
5 4 (0.83%) Hyperion Planning
5 4 (0.83%) Oracle Assets
5 4 (0.83%) Oracle Financials
5 4 (0.83%) Oracle General Ledger
5 4 (0.83%) Oracle Payables
5 4 (0.83%) Oracle Receivables
6 1 (0.21%) Aladdin
6 1 (0.21%) Dynamics CRM
6 1 (0.21%) NEC Housing
Cloud Services
1 206 (42.92%) Azure
2 133 (27.71%) GitHub
3 123 (25.63%) Azure DevOps
4 120 (25.00%) AWS
5 74 (15.42%) SaaS
6 53 (11.04%) GitHub Copilot
7 39 (8.13%) GitHub Actions
8 38 (7.92%) Serverless
9 34 (7.08%) PaaS
10 30 (6.25%) GCP
11 28 (5.83%) Entra ID
12 27 (5.63%) OCI
12 27 (5.63%) Power Platform
13 24 (5.00%) Azure Data Factory
14 23 (4.79%) Snowflake
15 19 (3.96%) Azure Logic Apps
15 19 (3.96%) dbt
16 16 (3.33%) Dynamics 365
17 15 (3.13%) Amazon EKS
18 13 (2.71%) Power Automate
Communications & Networking
1 12 (2.50%) 5G
1 12 (2.50%) SD-WAN
1 12 (2.50%) WAN
2 7 (1.46%) HTTP
3 5 (1.04%) TCP/IP
4 4 (0.83%) VPN
5 3 (0.63%) CHAP
5 3 (0.63%) Firewall
5 3 (0.63%) Internet
6 2 (0.42%) Broadband
6 2 (0.42%) Network Security
6 2 (0.42%) RFID
7 1 (0.21%) DNS
7 1 (0.21%) Multicast
Database & Business Intelligence
1 44 (9.17%) SQL Server
2 27 (5.63%) NoSQL
3 25 (5.21%) MySQL
4 22 (4.58%) PostgreSQL
4 22 (4.58%) Power BI
5 21 (4.38%) Data Warehouse
6 16 (3.33%) Relational Database
7 14 (2.92%) Tableau
8 13 (2.71%) Snowflake Schema
9 10 (2.08%) Elasticsearch
10 9 (1.88%) MariaDB
11 5 (1.04%) BigQuery
11 5 (1.04%) MongoDB
12 4 (0.83%) Essbase
12 4 (0.83%) QGIS
12 4 (0.83%) Tick Data
13 3 (0.63%) Data Lake
13 3 (0.63%) Metadata
13 3 (0.63%) Pinecone
13 3 (0.63%) SQL Server Integration Services
Development Applications
1 64 (13.33%) Selenium
2 55 (11.46%) Git
3 52 (10.83%) JIRA
4 49 (10.21%) Jenkins
5 47 (9.79%) Cypress.io
6 31 (6.46%) Oracle Forms
7 22 (4.58%) TeamCity
8 18 (3.75%) Postman
9 13 (2.71%) Cucumber
10 12 (2.50%) JUnit
11 10 (2.08%) GitLab
12 9 (1.88%) WebDriver
13 8 (1.67%) JMeter
14 6 (1.25%) Appium
15 5 (1.04%) LoadRunner
15 5 (1.04%) SpecFlow
15 5 (1.04%) Storybook
15 5 (1.04%) TestRail
16 4 (0.83%) CircleCI
16 4 (0.83%) webpack
General
1 173 (36.04%) Finance
2 160 (33.33%) Social Skills
3 68 (14.17%) Analytical Skills
4 55 (11.46%) Law
5 48 (10.00%) Inclusion and Diversity
6 31 (6.46%) Back Office
7 29 (6.04%) Public Sector
8 28 (5.83%) Banking
9 22 (4.58%) Retail
10 20 (4.17%) Financial Institution
11 15 (3.13%) Legal
12 12 (2.50%) Documentation Skills
12 12 (2.50%) Marketing
13 9 (1.88%) Automotive
14 8 (1.67%) Front Office
14 8 (1.67%) Local Government
15 7 (1.46%) Games
16 5 (1.04%) Organisational Skills
17 4 (0.83%) Health Technology
17 4 (0.83%) Military
Job Titles
1 127 (26.46%) Senior
2 108 (22.50%) Developer
3 84 (17.50%) Lead
4 46 (9.58%) Software Engineer
5 35 (7.29%) Senior Developer
6 33 (6.88%) Applications Engineer
6 33 (6.88%) Cloud Engineer
7 29 (6.04%) QA Engineer
8 26 (5.42%) Lead Developer
9 23 (4.79%) Analyst
10 22 (4.58%) Test Engineer
11 21 (4.38%) SaaS Developer
11 21 (4.38%) Senior Software Engineer
12 20 (4.17%) QA Automation Engineer
12 20 (4.17%) Test Automation Engineer
13 19 (3.96%) Software Developer
14 18 (3.75%) Automation Engineer
14 18 (3.75%) Tester
15 17 (3.54%) Senior Cloud Engineer
16 15 (3.13%) .NET Developer
Libraries, Frameworks & Software Standards
1 73 (15.21%) RESTful
2 64 (13.33%) React
3 53 (11.04%) .NET
4 48 (10.00%) JSON
5 41 (8.54%) Playwright
6 37 (7.71%) REST
7 36 (7.50%) XML
8 35 (7.29%) Node.js
9 34 (7.08%) CSS
9 34 (7.08%) SOAP
10 32 (6.67%) HTML
11 27 (5.63%) OAuth
12 25 (5.21%) OAuth2
13 23 (4.79%) Next.js
14 17 (3.54%) Jest
14 17 (3.54%) Spring
15 16 (3.33%) .NET Framework
15 16 (3.33%) GraphQL
16 14 (2.92%) Entity Framework
17 13 (2.71%) Lightning Web Components
Miscellaneous
1 114 (23.75%) Cloud Native
2 35 (7.29%) Product Ownership
3 29 (6.04%) Enterprise Software
4 26 (5.42%) Self-Motivation
5 19 (3.96%) Mobile App
6 18 (3.75%) Onboarding
7 12 (2.50%) GNSS
7 12 (2.50%) Legacy Systems
7 12 (2.50%) NHS
7 12 (2.50%) Self-Driving Car
8 11 (2.29%) Virtual Team
9 9 (1.88%) Hybrid Cloud
9 9 (1.88%) Management Information System
10 7 (1.46%) Distributed Systems
10 7 (1.46%) Low-Code
10 7 (1.46%) Team-Oriented Environment
11 6 (1.25%) Algorithms
11 6 (1.25%) Data Centre
12 5 (1.04%) Data Structures
12 5 (1.04%) Hedge funds
Operating Systems
1 21 (4.38%) Linux
2 15 (3.13%) Windows
3 10 (2.08%) Apple iOS
4 9 (1.88%) Windows Server
5 8 (1.67%) Android
6 4 (0.83%) Unix
7 2 (0.42%) CentOS
7 2 (0.42%) Solaris
7 2 (0.42%) VMS
8 1 (0.21%) Kali Linux
Processes & Methodologies
1 265 (55.21%) CI/CD
2 252 (52.50%) Agile
3 212 (44.17%) DevOps
4 151 (31.46%) Mentoring
5 133 (27.71%) Problem-Solving
6 123 (25.63%) Coaching
7 99 (20.63%) Continuous Improvement
8 95 (19.79%) AI
9 93 (19.38%) Software Engineering
10 87 (18.13%) Asset Management
11 86 (17.92%) Clean Code
12 82 (17.08%) Microservices
13 81 (16.88%) Analytics
14 66 (13.75%) Observability
15 63 (13.13%) Sprint Planning
16 57 (11.88%) Sprint Retrospective
17 52 (10.83%) ERP
17 52 (10.83%) SDLC
18 51 (10.63%) Computer Science
19 46 (9.58%) Data Modelling
Programming Languages
1 147 (30.63%) Python
2 134 (27.92%) SQL
3 110 (22.92%) Java
4 82 (17.08%) C#
5 78 (16.25%) JavaScript
6 61 (12.71%) TypeScript
7 31 (6.46%) PowerShell
8 30 (6.25%) Shell Script
9 27 (5.63%) PL/SQL
10 25 (5.21%) PHP
11 15 (3.13%) C
11 15 (3.13%) C++
12 13 (2.71%) Bicep
13 12 (2.50%) Apex Code
14 10 (2.08%) Bash
15 9 (1.88%) Go
16 8 (1.67%) MATLAB
17 6 (1.25%) Delphi
18 5 (1.04%) Groovy
18 5 (1.04%) T-SQL
Qualifications
1 64 (13.33%) Degree
2 43 (8.96%) Computer Science Degree
3 35 (7.29%) Security Cleared
4 27 (5.63%) SC Cleared
5 22 (4.58%) ISTQB
6 14 (2.92%) Master's Degree
7 11 (2.29%) ISTQB Foundation Certification
8 9 (1.88%) ITIL Certification
9 6 (1.25%) CEH
9 6 (1.25%) DV Cleared
10 4 (0.83%) CISA
10 4 (0.83%) ISEB
11 3 (0.63%) BPSS Clearance
11 3 (0.63%) CGEIT
11 3 (0.63%) CISM
11 3 (0.63%) CISSP
11 3 (0.63%) FFIEC
11 3 (0.63%) SANS
12 2 (0.42%) AWS Certified Cloud Practitioner
12 2 (0.42%) Azure Certification
Quality Assurance & Compliance
1 99 (20.63%) QA
2 44 (9.17%) ISO/IEC 27001
3 36 (7.50%) Accessibility
4 23 (4.79%) NIST
5 17 (3.54%) GDPR
6 16 (3.33%) ISO 9001
7 11 (2.29%) WCAG
8 10 (2.08%) Data Quality
8 10 (2.08%) NCSC
9 7 (1.46%) SLA
10 6 (1.25%) ISO 22301
11 3 (0.63%) COBIT
11 3 (0.63%) GRC
12 1 (0.21%) Cyber Essentials
12 1 (0.21%) ISO 14001
12 1 (0.21%) Sarbanes-Oxley
12 1 (0.21%) Section 508
12 1 (0.21%) SEPA
System Software
1 46 (9.58%) Docker
2 28 (5.83%) Active Directory
3 6 (1.25%) Virtual Machines
3 6 (1.25%) VMware Infrastructure
3 6 (1.25%) vSphere
4 2 (0.42%) Firmware
Systems Management
1 78 (16.25%) Terraform
2 46 (9.58%) Kubernetes
3 27 (5.63%) Single Sign-On
4 26 (5.42%) Grafana
5 15 (3.13%) Ansible
6 2 (0.42%) Argo
6 2 (0.42%) Control-M
6 2 (0.42%) HP Fortify
6 2 (0.42%) Microsoft Intune
6 2 (0.42%) Progress Chef
6 2 (0.42%) Prometheus
7 1 (0.21%) logstash
7 1 (0.21%) Nessus
7 1 (0.21%) Packer
Vendors
1 79 (16.46%) Microsoft
2 44 (9.17%) Oracle
3 19 (3.96%) Salesforce
4 17 (3.54%) Apple
4 17 (3.54%) VMware
5 15 (3.13%) Okta
6 14 (2.92%) Google
7 12 (2.50%) Databricks
8 9 (1.88%) Ab Initio
8 9 (1.88%) Commvault
9 5 (1.04%) iManage
9 5 (1.04%) ServiceNow
10 4 (0.83%) Hyperion
10 4 (0.83%) IBM
11 3 (0.63%) Checkmarx
11 3 (0.63%) Foundry
11 3 (0.63%) MuleSoft
11 3 (0.63%) Qualys
12 2 (0.42%) Samsung
12 2 (0.42%) Splunk