Clustering Jobs in London

Clustering
England > London

The table below looks at the prevalence of the term Clustering in permanent job vacancies in London. Included is a benchmarking guide to the salaries offered in vacancies that cited Clustering over the 6 months leading up to 26 July 2024, comparing them to the same period in the previous two years.

6 months to
26 Jul 2024
Same period 2023 Same period 2022
Rank 370 458 715
Rank change year-on-year +88 +257 -187
Permanent jobs citing Clustering 107 99 211
As % of all permanent jobs advertised in London 0.52% 0.37% 0.28%
As % of the Miscellaneous category 1.26% 0.84% 0.55%
Number of salaries quoted 95 70 83
10th Percentile £75,750 £47,500 £50,000
25th Percentile £81,250 £52,500 £51,250
Median annual salary (50th Percentile) £100,000 £66,250 £62,500
Median % change year-on-year +50.94% +6.00% -10.71%
75th Percentile £118,750 £77,715 £85,000
90th Percentile £143,750 £92,500 £110,000
England median annual salary £59,750 £55,000 £52,500
% change year-on-year +8.64% +4.76% -

All Generic Skills
London

Clustering falls under the General and Transferable Skills category. For comparison with the information above, the following table provides summary statistics for all permanent job vacancies requiring generic IT skills in London.

Permanent vacancies with a requirement for generic IT skills 8,507 11,733 38,507
As % of all permanent jobs advertised in London 41.02% 43.26% 51.33%
Number of salaries quoted 5,645 9,002 16,218
10th Percentile £40,000 £43,171 £43,750
25th Percentile £52,500 £56,219 £55,000
Median annual salary (50th Percentile) £77,500 £75,000 £75,000
Median % change year-on-year +3.33% - +3.45%
75th Percentile £105,000 £100,000 £95,938
90th Percentile £136,250 £125,000 £120,000
England median annual salary £56,124 £65,000 £62,500
% change year-on-year -13.66% +4.00% +4.17%

Clustering
Job Vacancy Trend in London

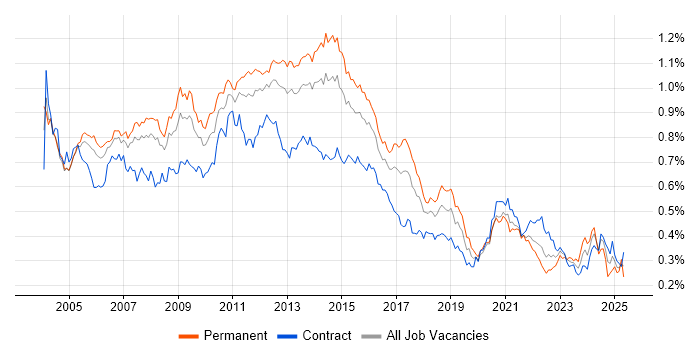
Job postings citing Clustering as a proportion of all IT jobs advertised in London.

Job vacancy trend for Clustering in London

Clustering
Salary Trend in London

3-month moving average salary quoted in jobs citing Clustering in London.

Salary trend for Clustering in London

Clustering
Salary Histogram in London

Salary distribution for jobs citing Clustering in London over the 6 months to 26 July 2024.

Salary histogram for Clustering in London

Clustering
Job Locations in London

The table below looks at the demand and provides a guide to the median salaries quoted in IT jobs citing Clustering within the London region over the 6 months to 26 July 2024. The 'Rank Change' column provides an indication of the change in demand within each location based on the same 6 month period last year.

Location Rank Change
on Same Period
Last Year
Matching
Permanent
IT Job Ads
Median Salary
Past 6 Months
Median Salary
% Change
on Same Period
Last Year
Live
Jobs
Central London +34 15 £85,000 +21.43% 2
Clustering
England

Clustering
Co-occurring Skills and Capabilities in London by Category

The follow tables expand on the table above by listing co-occurrences grouped by category. The same employment type, locality and period is covered with up to 20 co-occurrences shown in each of the following categories:

Application Platforms
1 54 (50.47%) Apache Airflow
2 14 (13.08%) Microsoft Exchange
3 2 (1.87%) IIS
4 1 (0.93%) nginx
Applications
1 1 (0.93%) Microsoft Office
1 1 (0.93%) MS Visio
Cloud Services
1 71 (66.36%) AWS
2 55 (51.40%) Snowflake
3 54 (50.47%) dbt
4 29 (27.10%) Azure
5 16 (14.95%) Microsoft 365
6 15 (14.02%) Entra ID
7 7 (6.54%) GitHub
7 7 (6.54%) IaaS
8 5 (4.67%) Power Platform
9 4 (3.74%) Cohesity
9 4 (3.74%) OCI
9 4 (3.74%) PaaS
10 3 (2.80%) Amazon EC2
10 3 (2.80%) GCP
10 3 (2.80%) SaaS
11 2 (1.87%) Amazon S3
11 2 (1.87%) AWS CloudFormation
12 1 (0.93%) GitHub Actions
12 1 (0.93%) OpenShift
12 1 (0.93%) Virtual Private Cloud
Communications & Networking
1 5 (4.67%) SAN
2 4 (3.74%) Firewall
3 3 (2.80%) SMTP
3 3 (2.80%) TCP/IP
4 2 (1.87%) DNS
4 2 (1.87%) Internet
4 2 (1.87%) SSL
5 1 (0.93%) DHCP
5 1 (0.93%) HTTP
5 1 (0.93%) iSCSI
5 1 (0.93%) NAS
5 1 (0.93%) SNMP
5 1 (0.93%) tcpdump
5 1 (0.93%) VPN
Database & Business Intelligence
1 56 (52.34%) Dremio
2 55 (51.40%) Big Data
3 54 (50.47%) Amazon Athena
3 54 (50.47%) Apache Arrow
3 54 (50.47%) Data Lake
4 12 (11.21%) SQL Server
5 7 (6.54%) SQL Server Integration Services
5 7 (6.54%) SQL Server Reporting Services
6 6 (5.61%) Data Warehouse
6 6 (5.61%) InfluxDB
6 6 (5.61%) SQL Server Analysis Services
7 5 (4.67%) Power BI
8 4 (3.74%) Amazon RDS
9 2 (1.87%) Elasticsearch
9 2 (1.87%) MariaDB
9 2 (1.87%) Oracle Database
9 2 (1.87%) PostgreSQL
10 1 (0.93%) Microsoft Analysis Services
10 1 (0.93%) MongoDB
10 1 (0.93%) QlikView
Development Applications
1 19 (17.76%) Git
2 15 (14.02%) Jenkins
3 12 (11.21%) TeamCity
4 11 (10.28%) JIRA
5 1 (0.93%) JMeter
5 1 (0.93%) JProfiler
5 1 (0.93%) LoadRunner
5 1 (0.93%) Maven
5 1 (0.93%) NeoLoad
5 1 (0.93%) Octopus Deploy
5 1 (0.93%) Selenium
General
1 74 (69.16%) Finance
2 21 (19.63%) Social Skills
3 2 (1.87%) Analytical Skills
3 2 (1.87%) Banking
3 2 (1.87%) Law
4 1 (0.93%) Back Office
4 1 (0.93%) Games
4 1 (0.93%) Inclusion and Diversity
4 1 (0.93%) Legal
4 1 (0.93%) Marketing
4 1 (0.93%) Organisational Skills
4 1 (0.93%) Presentation Skills
4 1 (0.93%) Public Sector
4 1 (0.93%) Telecoms
Job Titles
1 56 (52.34%) Site Engineer
1 56 (52.34%) Site Reliability Engineer
2 54 (50.47%) AWS Engineer
2 54 (50.47%) Big Data Engineer
3 8 (7.48%) DBA
3 8 (7.48%) Platform Engineer
4 7 (6.54%) Infrastructure Manager
4 7 (6.54%) SQL DBA
4 7 (6.54%) SQL Server DBA
5 6 (5.61%) Lead
6 5 (4.67%) Architect
6 5 (4.67%) Kubernetes Engineer
6 5 (4.67%) Linux Engineer
6 5 (4.67%) Systems Engineer
7 4 (3.74%) Infrastructure Engineer
7 4 (3.74%) Senior
8 3 (2.80%) IT Engineer
9 2 (1.87%) Analyst
9 2 (1.87%) Senior DevOps
9 2 (1.87%) Team Leader
Libraries, Frameworks & Software Standards
1 54 (50.47%) gRPC
1 54 (50.47%) Protocol Buffers
2 3 (2.80%) 802.1X
2 3 (2.80%) Elastic Stack
3 2 (1.87%) .NET
3 2 (1.87%) WSH
4 1 (0.93%) Middleware
4 1 (0.93%) Node.js
4 1 (0.93%) XML
4 1 (0.93%) YAML
Miscellaneous
1 54 (50.47%) Hedge funds
2 15 (14.02%) Replication
3 4 (3.74%) Legacy Systems
3 4 (3.74%) Onboarding
4 3 (2.80%) Data Centre
5 2 (1.87%) Data Protection Act
6 1 (0.93%) Cloud Native
6 1 (0.93%) Linux Command Line
6 1 (0.93%) Management Information System
6 1 (0.93%) PKI
Operating Systems
1 34 (31.78%) Windows
2 29 (27.10%) Windows Server
3 22 (20.56%) Linux
4 12 (11.21%) Oracle Linux
5 10 (9.35%) Red Hat Enterprise Linux
5 10 (9.35%) Solaris
6 6 (5.61%) Windows Server 2012
7 4 (3.74%) Unix
8 3 (2.80%) Windows Server 2016
8 3 (2.80%) Windows Server 2019
9 2 (1.87%) Windows Server 2008
10 1 (0.93%) Windows 10
10 1 (0.93%) zOS
Processes & Methodologies
1 63 (58.88%) DevOps
2 58 (54.21%) Site Reliability Engineering
3 54 (50.47%) Asset Management
3 54 (50.47%) Investment Management
4 27 (25.23%) Disaster Recovery
5 26 (24.30%) Continuous Improvement
6 21 (19.63%) High Availability
7 18 (16.82%) Performance Tuning
8 16 (14.95%) Infrastructure as Code
9 15 (14.02%) CI/CD
9 15 (14.02%) Systems Engineering
10 13 (12.15%) Deployment Automation
10 13 (12.15%) Information Security
10 13 (12.15%) Performance Management
10 13 (12.15%) Security Hardening
11 11 (10.28%) Backlog Management
11 11 (10.28%) Resource Management
12 10 (9.35%) Containerisation
13 9 (8.41%) Agile
13 9 (8.41%) Platform Engineering
Programming Languages
1 71 (66.36%) Python
2 56 (52.34%) Java
3 55 (51.40%) JavaScript
4 54 (50.47%) Go
5 42 (39.25%) PowerShell
6 14 (13.08%) Bash
7 13 (12.15%) C#
8 7 (6.54%) T-SQL
9 4 (3.74%) C
9 4 (3.74%) SQL
10 3 (2.80%) Perl
11 2 (1.87%) VBScript
12 1 (0.93%) Ruby
12 1 (0.93%) Shell Script
Qualifications
1 5 (4.67%) Degree
2 2 (1.87%) Computer Science Degree
3 1 (0.93%) Azure Certification
3 1 (0.93%) CCNP
3 1 (0.93%) Cisco Certification
3 1 (0.93%) Master's Degree
3 1 (0.93%) MCSA
3 1 (0.93%) MCSE
3 1 (0.93%) Microsoft Certification
3 1 (0.93%) Microsoft Certified Architect
3 1 (0.93%) VMware Certified Professional (VCP)
Quality Assurance & Compliance
1 3 (2.80%) ISO/IEC 27001
2 1 (0.93%) Accessibility
2 1 (0.93%) GDPR
2 1 (0.93%) ISO/IEC 27002 (supersedes ISO/IEC 17799)
2 1 (0.93%) NIST
2 1 (0.93%) Sarbanes-Oxley
System Software
1 21 (19.63%) Active Directory
1 21 (19.63%) VMware ESXi
2 16 (14.95%) Docker
3 11 (10.28%) VMware Infrastructure
4 5 (4.67%) vSphere
5 4 (3.74%) Microsoft Virtual Server
5 4 (3.74%) Virtual Servers
6 3 (2.80%) Hyper-V
7 2 (1.87%) Ceph
8 1 (0.93%) Firmware
8 1 (0.93%) KVM
8 1 (0.93%) VirtualBox
8 1 (0.93%) XenApp
Systems Management
1 70 (65.42%) Kubernetes
2 69 (64.49%) Terraform
3 61 (57.01%) Prometheus
4 21 (19.63%) Ansible
4 21 (19.63%) Microsoft Clustering
5 17 (15.89%) vCenter Server
6 15 (14.02%) Single Sign-On
7 14 (13.08%) Microsoft Intune
8 8 (7.48%) Grafana
9 7 (6.54%) Nagios
10 6 (5.61%) Foglight
11 5 (4.67%) SCOM
11 5 (4.67%) SCOrch
12 4 (3.74%) Failover Clustering
12 4 (3.74%) Istio
12 4 (3.74%) SCCM
13 3 (2.80%) Puppet
14 2 (1.87%) Kibana
15 1 (0.93%) Graphite
15 1 (0.93%) Progress Chef
Vendors
1 25 (23.36%) VMware
2 17 (15.89%) Commvault
3 14 (13.08%) Oracle
4 12 (11.21%) Serena
4 12 (11.21%) ServiceNow
5 11 (10.28%) Sun
6 7 (6.54%) Cisco
7 6 (5.61%) Microsoft
8 5 (4.67%) ArcSight
8 5 (4.67%) HP
9 4 (3.74%) Google
9 4 (3.74%) NetApp
9 4 (3.74%) Red Hat
10 2 (1.87%) AppDynamics
11 1 (0.93%) Dynatrace
11 1 (0.93%) IBM
11 1 (0.93%) IDERA
11 1 (0.93%) New Relic
11 1 (0.93%) Splunk
11 1 (0.93%) TOWER Software