R
England > London
The table below provides summary statistics for permanent job vacancies advertised in London requiring R skills. It includes a benchmarking guide to the annual salaries offered in vacancies that cited R over the 6 months leading up to 31 May 2025, comparing them to the same period in the previous two years.
| 6 months to 31 May 2025 |
Same period 2024 | Same period 2023 | |
|---|---|---|---|
| Rank | 269 | 242 | 262 |
| Rank change year-on-year | -27 | +20 | -49 |
| Permanent jobs citing R | 129 | 298 | 437 |
| As % of all permanent jobs advertised in London | 1.01% | 1.24% | 1.36% |
| As % of the Programming Languages category | 2.47% | 3.10% | 2.78% |
| Number of salaries quoted | 54 | 202 | 289 |
| 10th Percentile | £46,386 | £43,200 | £47,489 |
| 25th Percentile | £57,813 | £52,500 | £57,500 |
| Median annual salary (50th Percentile) | £75,000 | £80,000 | £75,000 |
| Median % change year-on-year | -6.25% | +6.67% | +11.11% |
| 75th Percentile | £110,000 | £112,500 | £112,500 |
| 90th Percentile | £127,000 | £149,625 | £150,000 |
| England median annual salary | £62,000 | £62,500 | £62,500 |
| % change year-on-year | -0.80% | - | +4.17% |
All Programming Languages
London
R falls under the Programming Languages category. For comparison with the information above, the following table provides summary statistics for all permanent job vacancies requiring coding skills in London.
| Permanent vacancies with a requirement for coding skills | 5,233 | 9,628 | 15,729 |
| As % of all permanent jobs advertised in London | 40.95% | 40.07% | 48.87% |
| Number of salaries quoted | 3,554 | 7,577 | 11,995 |
| 10th Percentile | £50,000 | £47,500 | £48,750 |
| 25th Percentile | £61,250 | £60,000 | £60,000 |
| Median annual salary (50th Percentile) | £82,500 | £80,000 | £80,000 |
| Median % change year-on-year | +3.13% | - | +6.67% |
| 75th Percentile | £110,000 | £102,500 | £100,000 |
| 90th Percentile | £132,500 | £130,000 | £122,500 |
| England median annual salary | £60,000 | £60,000 | £65,000 |
| % change year-on-year | - | -7.69% | +4.00% |
R
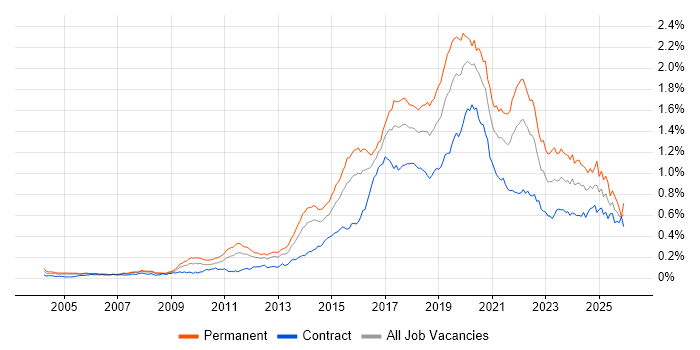
Job Vacancy Trend in London
Job postings citing R as a proportion of all IT jobs advertised in London.

R
Salary Trend in London
3-month moving average salary quoted in jobs citing R in London.
R
Salary Histogram in London
Salary distribution for jobs citing R in London over the 6 months to 31 May 2025.
R
Job Locations in London
The table below looks at the demand and provides a guide to the median salaries quoted in IT jobs citing R within the London region over the 6 months to 31 May 2025. The 'Rank Change' column provides an indication of the change in demand within each location based on the same 6 month period last year.
| Location | Rank Change on Same Period Last Year |
Matching Permanent IT Job Ads |
Median Salary Past 6 Months |
Median Salary % Change on Same Period Last Year |
Live Jobs |
|---|---|---|---|---|---|
| Central London | -6 | 19 | £67,500 | -14.29% | 9 |
| South London | -2 | 1 | £105,000 | +138.64% | |
| R England |
|||||
R
Co-occurring Skills and Capabilities in London by Category
The follow tables expand on the table above by listing co-occurrences grouped by category. The same employment type, locality and period is covered with up to 20 co-occurrences shown in each of the following categories:
|
|
||||||||||||||||||||||||||||||||||||||||||||||||||||||||||||||||||||||||||||||||||||||||||||||||||||||||||||||||||||||||||||||
|
|
||||||||||||||||||||||||||||||||||||||||||||||||||||||||||||||||||||||||||||||||||||||||||||||||||||||||||||||||||||||||||||||
|
|
||||||||||||||||||||||||||||||||||||||||||||||||||||||||||||||||||||||||||||||||||||||||||||||||||||||||||||||||||||||||||||||
|
|
||||||||||||||||||||||||||||||||||||||||||||||||||||||||||||||||||||||||||||||||||||||||||||||||||||||||||||||||||||||||||||||
|
|
||||||||||||||||||||||||||||||||||||||||||||||||||||||||||||||||||||||||||||||||||||||||||||||||||||||||||||||||||||||||||||||
|
|
||||||||||||||||||||||||||||||||||||||||||||||||||||||||||||||||||||||||||||||||||||||||||||||||||||||||||||||||||||||||||||||
|
|
||||||||||||||||||||||||||||||||||||||||||||||||||||||||||||||||||||||||||||||||||||||||||||||||||||||||||||||||||||||||||||||
|
|
||||||||||||||||||||||||||||||||||||||||||||||||||||||||||||||||||||||||||||||||||||||||||||||||||||||||||||||||||||||||||||||
|
|
||||||||||||||||||||||||||||||||||||||||||||||||||||||||||||||||||||||||||||||||||||||||||||||||||||||||||||||||||||||||||||||
|
|||||||||||||||||||||||||||||||||||||||||||||||||||||||||||||||||||||||||||||||||||||||||||||||||||||||||||||||||||||||||||||||
