Change Management Jobs in London

Change Management
England > London

The table below provides summary statistics for permanent job vacancies advertised in London requiring Change Management skills. It includes a benchmarking guide to the annual salaries offered in vacancies that cited Change Management over the 6 months leading up to 30 May 2025, comparing them to the same period in the previous two years.

6 months to
30 May 2025
Same period 2024 Same period 2023
Rank 91 81 114
Rank change year-on-year -10 +33 +58
Permanent jobs citing Change Management 449 866 989
As % of all permanent jobs advertised in London 3.54% 3.61% 3.02%
As % of the Processes & Methodologies category 3.68% 4.00% 3.17%
Number of salaries quoted 267 457 655
10th Percentile £50,750 £46,250 £35,950
25th Percentile £57,500 £56,250 £51,250
Median annual salary (50th Percentile) £70,000 £72,500 £65,000
Median % change year-on-year -3.45% +11.54% +8.33%
75th Percentile £90,000 £87,500 £85,000
90th Percentile £106,000 £115,000 £104,988
England median annual salary £52,500 £55,000 £55,000
% change year-on-year -4.55% - -

All Process and Methodology Skills
London

Change Management falls under the Processes and Methodologies category. For comparison with the information above, the following table provides summary statistics for all permanent job vacancies requiring process or methodology skills in London.

Permanent vacancies with a requirement for process or methodology skills 12,216 21,652 31,243
As % of all permanent jobs advertised in London 96.26% 90.32% 95.32%
Number of salaries quoted 6,929 15,871 22,511
10th Percentile £41,700 £37,500 £42,789
25th Percentile £55,500 £51,250 £55,000
Median annual salary (50th Percentile) £75,000 £70,000 £75,000
Median % change year-on-year +7.14% -6.67% +7.14%
75th Percentile £100,000 £95,000 £95,000
90th Percentile £122,500 £115,000 £115,055
England median annual salary £57,500 £55,000 £62,500
% change year-on-year +4.55% -12.00% +4.17%

Change Management
Job Vacancy Trend in London

Job postings citing Change Management as a proportion of all IT jobs advertised in London.
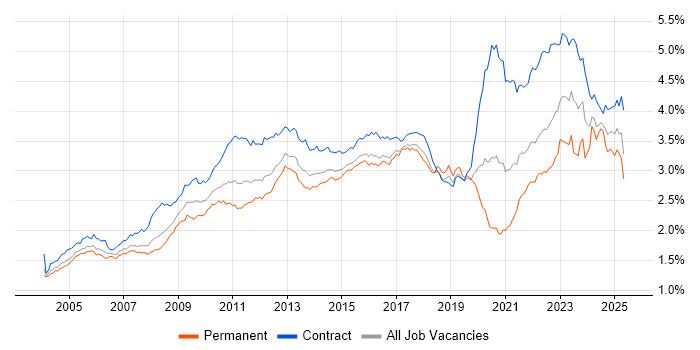
Job vacancy trend for Change Management in London

Change Management
Salary Trend in London

3-month moving average salary quoted in jobs citing Change Management in London.

Salary trend for Change Management in London

Change Management
Salary Histogram in London

Salary distribution for jobs citing Change Management in London over the 6 months to 30 May 2025.

Salary histogram for Change Management in London

Change Management
Job Locations in London

The table below looks at the demand and provides a guide to the median salaries quoted in IT jobs citing Change Management within the London region over the 6 months to 30 May 2025. The 'Rank Change' column provides an indication of the change in demand within each location based on the same 6 month period last year.

Location Rank Change
on Same Period
Last Year
Matching
Permanent
IT Job Ads
Median Salary
Past 6 Months
Median Salary
% Change
on Same Period
Last Year
Live
Jobs
Central London -7 94 £65,000 -13.33% 34
East London -14 18 £88,750 +54.35% 8
South London -15 17 £66,250 +3.11% 2
West London -47 12 £55,000 -31.25% 61
North London -11 3 - - 1
Change Management
England

Change Management
Co-occurring Skills and Capabilities in London by Category

The follow tables expand on the table above by listing co-occurrences grouped by category. The same employment type, locality and period is covered with up to 20 co-occurrences shown in each of the following categories:

Application Platforms
1 28 (6.24%) SharePoint
2 22 (4.90%) Confluence
3 18 (4.01%) Microsoft Exchange
4 3 (0.67%) Skype for Business
5 2 (0.45%) IIS
6 1 (0.22%) Apache Airflow
6 1 (0.22%) Oracle Workflow
6 1 (0.22%) Tomcat
6 1 (0.22%) WebLogic
6 1 (0.22%) WebSphere
Applications
1 52 (11.58%) Microsoft Office
2 41 (9.13%) Microsoft Excel
3 24 (5.35%) MS Visio
4 19 (4.23%) Microsoft PowerPoint
5 7 (1.56%) Microsoft Project
6 5 (1.11%) Trello
Business Applications
1 12 (2.67%) Dynamics AX
2 9 (2.00%) Raiser’s Edge
3 6 (1.34%) SAP CO
3 6 (1.34%) SAP FI
3 6 (1.34%) SAP FI/CO
4 4 (0.89%) CA PPM
5 3 (0.67%) Dynamics CRM
5 3 (0.67%) Dynamics NAV
5 3 (0.67%) iTrent
5 3 (0.67%) Oracle ERP
5 3 (0.67%) Remedy ITSM
5 3 (0.67%) SAP S/4HANA
6 2 (0.45%) Carpe Diem
6 2 (0.45%) Elite 3E
7 1 (0.22%) Endur
7 1 (0.22%) NetSuite
7 1 (0.22%) Primavera
7 1 (0.22%) Teamcenter
7 1 (0.22%) Workday HCM
Cloud Services
1 108 (24.05%) Azure
2 61 (13.59%) AWS
3 46 (10.24%) Microsoft 365
4 37 (8.24%) Power Platform
5 30 (6.68%) GCP
6 26 (5.79%) Azure Monitor
7 22 (4.90%) Entra ID
8 17 (3.79%) Azure DevOps
8 17 (3.79%) Dynamics 365
9 15 (3.34%) Azure Logic Apps
10 13 (2.90%) AWS Direct Connect
11 12 (2.67%) Azure Data Factory
12 11 (2.45%) Microsoft Copilot
12 11 (2.45%) SaaS
13 8 (1.78%) PowerApps
14 7 (1.56%) Azure Synapse Analytics
14 7 (1.56%) Miro
14 7 (1.56%) Power Automate
15 6 (1.34%) Cloud Computing
15 6 (1.34%) GitHub
Communications & Networking
1 38 (8.46%) Firewall
2 34 (7.57%) VPN
3 27 (6.01%) LAN
3 27 (6.01%) WAN
4 25 (5.57%) Broadband
4 25 (5.57%) Network Security
5 20 (4.45%) BGP
5 20 (4.45%) OSPF
6 18 (4.01%) Cisco ASA
6 18 (4.01%) SD-WAN
7 16 (3.56%) MPLS
7 16 (3.56%) WLAN
8 15 (3.34%) IPsec
9 14 (3.12%) Cisco Firepower
9 14 (3.12%) NX-OS
10 10 (2.23%) DNS
10 10 (2.23%) Wi-Fi
10 10 (2.23%) Wireless
11 9 (2.00%) TCP/IP
12 8 (1.78%) DHCP
Database & Business Intelligence
1 33 (7.35%) SQL Server
2 24 (5.35%) Relational Database
3 20 (4.45%) Data Warehouse
3 20 (4.45%) Power BI
4 15 (3.34%) Oracle Reports
5 13 (2.90%) Tableau
6 8 (1.78%) DB2
6 8 (1.78%) SQL Server Integration Services
7 6 (1.34%) MongoDB
7 6 (1.34%) PostgreSQL
8 2 (0.45%) Azure SQL Database
8 2 (0.45%) BusinessObjects
8 2 (0.45%) Data Lake
8 2 (0.45%) Electronic Patient Records
8 2 (0.45%) Looker
8 2 (0.45%) NoSQL
8 2 (0.45%) RDBMS
8 2 (0.45%) SQL Server Analysis Services
8 2 (0.45%) SQL Server Reporting Services
9 1 (0.22%) Geospatial Data
Development Applications
1 42 (9.35%) JIRA
2 8 (1.78%) Visual Studio
3 4 (0.89%) Git
3 4 (0.89%) Jenkins
4 2 (0.45%) Bitbucket
5 1 (0.22%) Artifactory
5 1 (0.22%) Eclipse
5 1 (0.22%) NetBeans
5 1 (0.22%) Subversion
General
1 188 (41.87%) Social Skills
2 154 (34.30%) Finance
3 78 (17.37%) Analytical Skills
4 46 (10.24%) Law
5 39 (8.69%) Banking
6 38 (8.46%) Games
7 31 (6.90%) Telecoms
8 28 (6.24%) Inclusion and Diversity
8 28 (6.24%) Legal
9 18 (4.01%) Presentation Skills
10 17 (3.79%) Marketing
11 15 (3.34%) Investment Banking
11 15 (3.34%) Manufacturing
12 13 (2.90%) Retail
13 11 (2.45%) Publishing
14 10 (2.23%) Documentation Skills
14 10 (2.23%) Organisational Skills
15 9 (2.00%) Financial Institution
16 7 (1.56%) Influencing Skills
16 7 (1.56%) Public Sector
Job Titles
1 115 (25.61%) Analyst
2 103 (22.94%) Senior
3 42 (9.35%) Lead
4 40 (8.91%) Senior Manager
5 36 (8.02%) Senior Analyst
6 30 (6.68%) Support Analyst
7 26 (5.79%) Engineering Manager
8 25 (5.57%) Senior Service Manager
8 25 (5.57%) ServiceNow Manager
9 23 (5.12%) Applications Support
9 23 (5.12%) Business Analyst
9 23 (5.12%) Project Manager
10 22 (4.90%) Service Analyst
11 20 (4.45%) Consultant
12 18 (4.01%) Developer
12 18 (4.01%) IT Support
13 17 (3.79%) Network Engineer
14 16 (3.56%) Support Manager
15 15 (3.34%) Change Manager
15 15 (3.34%) IT Analyst
Libraries, Frameworks & Software Standards
1 11 (2.45%) .NET
2 10 (2.23%) FIX Protocol
3 9 (2.00%) .NET Framework
4 7 (1.56%) ASP.NET
4 7 (1.56%) Middleware
5 6 (1.34%) HTML
6 4 (0.89%) CSS
6 4 (0.89%) HTML5 Canvas
6 4 (0.89%) RESTful
6 4 (0.89%) Web Services
7 3 (0.67%) Oracle Fusion
7 3 (0.67%) REST
8 2 (0.45%) .NET Core
8 2 (0.45%) 802.1X
8 2 (0.45%) Blazor
8 2 (0.45%) EDI
8 2 (0.45%) OpenTelemetry
8 2 (0.45%) PostGIS
8 2 (0.45%) Razor View Engine
8 2 (0.45%) React
Miscellaneous
1 90 (20.04%) Management Information System
2 43 (9.58%) Product Ownership
3 25 (5.57%) Video\Live Streaming
4 24 (5.35%) Data Centre
5 18 (4.01%) Onboarding
6 15 (3.34%) Self-Motivation
7 13 (2.90%) Blockchain
8 12 (2.67%) Robotics
9 9 (2.00%) Hybrid Cloud
10 8 (1.78%) Clustering
10 8 (1.78%) Security Posture
11 7 (1.56%) CMDB
11 7 (1.56%) Hedge funds
11 7 (1.56%) PACS
11 7 (1.56%) PMI
11 7 (1.56%) Virtual Team
12 5 (1.11%) Cloud Native
12 5 (1.11%) Driving Licence
12 5 (1.11%) Microsoft Licensing
12 5 (1.11%) Tandem
Operating Systems
1 57 (12.69%) Windows
2 35 (7.80%) Linux
3 31 (6.90%) Unix
4 23 (5.12%) Windows Server
5 9 (2.00%) Windows 10
6 8 (1.78%) Red Hat Enterprise Linux
7 4 (0.89%) Windows Server 2019
8 2 (0.45%) Mac OS
8 2 (0.45%) Windows Server 2012
8 2 (0.45%) Windows Server 2016
9 1 (0.22%) Apple iOS
Processes & Methodologies
1 109 (24.28%) ITIL
2 98 (21.83%) Problem-Solving
3 95 (21.16%) Agile
4 86 (19.15%) Service Delivery
5 75 (16.70%) Project Management
6 74 (16.48%) Incident Management
7 70 (15.59%) ITSM
7 70 (15.59%) Problem Management
7 70 (15.59%) Roadmaps
8 68 (15.14%) Computer Science
9 61 (13.59%) Stakeholder Management
10 58 (12.92%) Continuous Improvement
10 58 (12.92%) Service Management
11 49 (10.91%) Mentoring
12 41 (9.13%) Customer Service
13 40 (8.91%) Process Improvement
14 37 (8.24%) DevOps
15 36 (8.02%) Workflow
16 35 (7.80%) Disaster Recovery
16 35 (7.80%) Validation
Programming Languages
1 76 (16.93%) SQL
2 30 (6.68%) T-SQL
3 28 (6.24%) C#
4 24 (5.35%) PowerShell
4 24 (5.35%) Python
5 8 (1.78%) PL/SQL
5 8 (1.78%) Shell Script
6 7 (1.56%) JavaScript
6 7 (1.56%) R
6 7 (1.56%) VB.NET
7 5 (1.11%) Java
8 3 (0.67%) C++
9 2 (0.45%) VB
9 2 (0.45%) VBA
10 1 (0.22%) Gremlin
10 1 (0.22%) Perl
10 1 (0.22%) Scala
10 1 (0.22%) TypeScript
Qualifications
1 119 (26.50%) Degree
2 34 (7.57%) Computer Science Degree
3 24 (5.35%) Cisco Certification
4 19 (4.23%) CISA
4 19 (4.23%) PMI Certification
5 16 (3.56%) CCNP
6 15 (3.34%) CISSP
7 14 (3.12%) Security Cleared
8 13 (2.90%) PMP
9 12 (2.67%) ISACA
10 10 (2.23%) Azure Certification
10 10 (2.23%) Master's Degree
11 9 (2.00%) CCIE
12 8 (1.78%) AWS Certification
13 7 (1.56%) (ISC)2 CCSP
13 7 (1.56%) CCSP
14 6 (1.34%) CCNA
14 6 (1.34%) CSPO
14 6 (1.34%) SC Cleared
15 5 (1.11%) CCSA
Quality Assurance & Compliance
1 39 (8.69%) QA
2 24 (5.35%) SLA
3 19 (4.23%) PMO
4 15 (3.34%) GDPR
5 12 (2.67%) ITGC
6 9 (2.00%) ISO/IEC 27001
6 9 (2.00%) NIST
7 6 (1.34%) IFRS
7 6 (1.34%) IFRS 9
8 5 (1.11%) Data Quality
8 5 (1.11%) P3O
9 3 (0.67%) Cyber Essentials
9 3 (0.67%) ISO 9001
9 3 (0.67%) Sarbanes-Oxley
9 3 (0.67%) SOC 2
10 2 (0.45%) Accessibility
10 2 (0.45%) ISO 22301
10 2 (0.45%) PCI DSS
11 1 (0.22%) EMIR
11 1 (0.22%) Solvency II
System Software
1 29 (6.46%) Active Directory
2 12 (2.67%) VMware Infrastructure
3 7 (1.56%) Firmware
4 6 (1.34%) Virtual Desktop
5 5 (1.11%) Veritas Cluster Server
6 3 (0.67%) ProxySG
7 2 (0.45%) Docker
8 1 (0.22%) HDFS
Systems Management
1 23 (5.12%) Terraform
2 18 (4.01%) Microsoft Intune
3 14 (3.12%) Ansible
4 8 (1.78%) Grafana
4 8 (1.78%) Prometheus
5 6 (1.34%) Progress Chef
5 6 (1.34%) Puppet
6 4 (0.89%) FortiGate
6 4 (0.89%) SCCM
7 2 (0.45%) NetBackup
8 1 (0.22%) ITRS Geneos
8 1 (0.22%) Jamf Pro
8 1 (0.22%) Kubernetes
Vendors
1 121 (26.95%) Microsoft
2 62 (13.81%) ServiceNow
3 52 (11.58%) Oracle
4 45 (10.02%) Cisco
5 33 (7.35%) SAP
6 30 (6.68%) CheckPoint
7 29 (6.46%) Google
8 27 (6.01%) SolarWinds
9 24 (5.35%) Meraki
10 20 (4.45%) VMware
11 15 (3.34%) Fortinet
11 15 (3.34%) Salesforce
12 14 (3.12%) Dynatrace
13 10 (2.23%) F5
13 10 (2.23%) Infoblox
14 9 (2.00%) Symantec
15 8 (1.78%) iManage
15 8 (1.78%) Intapp
15 8 (1.78%) Red Hat
16 7 (1.56%) Workday