GAP Analysis Jobs in London

GAP Analysis
England > London

The table below provides summary statistics for permanent job vacancies advertised in London requiring GAP Analysis skills. It includes a benchmarking guide to the annual salaries offered in vacancies that cited GAP Analysis over the 6 months leading up to 17 August 2025, comparing them to the same period in the previous two years.

6 months to
17 Aug 2025
Same period 2024 Same period 2023
Rank 364 415 450
Rank change year-on-year +51 +35 +208
Permanent jobs citing GAP Analysis 37 54 83
As % of all permanent jobs advertised in London 0.29% 0.27% 0.33%
As % of the Processes & Methodologies category 0.30% 0.30% 0.35%
Number of salaries quoted 28 45 66
10th Percentile £57,750 £49,650 £45,125
25th Percentile £69,688 £51,108 £61,250
Median annual salary (50th Percentile) £78,750 £67,500 £80,000
Median % change year-on-year +16.67% -15.63% +10.34%
75th Percentile £85,625 £81,250 £90,000
90th Percentile £101,500 £87,500 £105,000
England median annual salary £65,000 £65,000 £62,500
% change year-on-year - +4.00% +13.64%

All Process and Methodology Skills
London

GAP Analysis falls under the Processes and Methodologies category. For comparison with the information above, the following table provides summary statistics for all permanent job vacancies requiring process or methodology skills in London.

Permanent vacancies with a requirement for process or methodology skills 12,223 18,010 23,560
As % of all permanent jobs advertised in London 94.61% 89.46% 94.63%
Number of salaries quoted 7,287 11,606 18,582
10th Percentile £39,750 £40,000 £42,500
25th Percentile £53,750 £52,500 £55,000
Median annual salary (50th Percentile) £75,000 £75,000 £75,000
Median % change year-on-year - - +7.14%
75th Percentile £97,500 £95,000 £95,000
90th Percentile £120,000 £120,000 £116,250
England median annual salary £55,000 £55,000 £62,500
% change year-on-year - -12.00% +4.17%

GAP Analysis
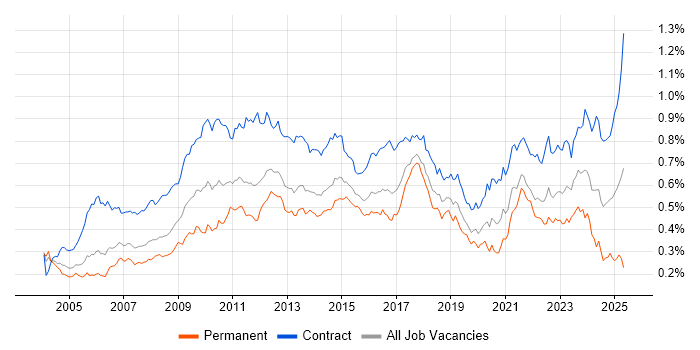
Job Vacancy Trend in London

Job postings citing GAP Analysis as a proportion of all IT jobs advertised in London.

Job vacancy trend for GAP Analysis in London

GAP Analysis
Salary Trend in London

3-month moving average salary quoted in jobs citing GAP Analysis in London.

Salary trend for GAP Analysis in London

GAP Analysis
Salary Histogram in London

Salary distribution for jobs citing GAP Analysis in London over the 6 months to 17 August 2025.

Salary histogram for GAP Analysis in London

GAP Analysis
Job Locations in London

The table below looks at the demand and provides a guide to the median salaries quoted in IT jobs citing GAP Analysis within the London region over the 6 months to 17 August 2025. The 'Rank Change' column provides an indication of the change in demand within each location based on the same 6 month period last year.

Location Rank Change
on Same Period
Last Year
Matching
Permanent
IT Job Ads
Median Salary
Past 6 Months
Median Salary
% Change
on Same Period
Last Year
Live
Jobs
Central London +35 12 £80,000 +18.52% 14
GAP Analysis
England

GAP Analysis
Co-occurring Skills and Capabilities in London by Category

The follow tables expand on the table above by listing co-occurrences grouped by category. The same employment type, locality and period is covered with up to 20 co-occurrences shown in each of the following categories:

Application Platforms
1 6 (16.22%) SharePoint
2 5 (13.51%) Confluence
3 1 (2.70%) Apache
3 1 (2.70%) Apache Airflow
Applications
1 6 (16.22%) Microsoft Excel
2 5 (13.51%) Microsoft Office
2 5 (13.51%) Microsoft PowerPoint
3 1 (2.70%) MS Visio
Business Applications
1 2 (5.41%) Bloomberg AIM
2 1 (2.70%) Dynamics AX
2 1 (2.70%) Dynamics CRM
2 1 (2.70%) SAP MM
2 1 (2.70%) SAP S/4HANA
2 1 (2.70%) SAP SD
Cloud Services
1 6 (16.22%) Azure
2 4 (10.81%) Dynamics 365
2 4 (10.81%) Power Platform
2 4 (10.81%) SaaS
3 2 (5.41%) AWS
3 2 (5.41%) Microsoft 365
4 1 (2.70%) Azure AI
4 1 (2.70%) Azure Machine Learning
4 1 (2.70%) GCP
4 1 (2.70%) OneDrive
4 1 (2.70%) Power Automate
4 1 (2.70%) PowerApps
4 1 (2.70%) Salesforce Sales Cloud
4 1 (2.70%) Salesforce Service Cloud
4 1 (2.70%) Snowflake
Database & Business Intelligence
1 4 (10.81%) Power BI
2 2 (5.41%) Data Lake
3 1 (2.70%) BigQuery
3 1 (2.70%) Data Warehouse
3 1 (2.70%) Snowflake Schema
3 1 (2.70%) Tableau
Development Applications
1 10 (27.03%) JIRA
General
1 15 (40.54%) Social Skills
2 13 (35.14%) Finance
3 8 (21.62%) Documentation Skills
4 6 (16.22%) Analytical Skills
5 4 (10.81%) Advertising
5 4 (10.81%) Organisational Skills
6 3 (8.11%) Back Office
6 3 (8.11%) Banking
6 3 (8.11%) Financial Institution
7 2 (5.41%) Legal
7 2 (5.41%) Marketing
8 1 (2.70%) Billing
8 1 (2.70%) Pharmaceutical
8 1 (2.70%) Public Sector
8 1 (2.70%) Retail
8 1 (2.70%) Telecoms
Job Titles
1 13 (35.14%) Analyst
2 10 (27.03%) Business Analyst
3 6 (16.22%) Lead
4 5 (13.51%) Architect
4 5 (13.51%) Project Manager
5 4 (10.81%) Insurance Business Analyst
5 4 (10.81%) Lead Business Analyst
5 4 (10.81%) Senior
6 3 (8.11%) Consultant
7 2 (5.41%) Business Intelligence Developer
7 2 (5.41%) Developer
7 2 (5.41%) Functional Consultant
7 2 (5.41%) Power BI Developer
7 2 (5.41%) Product Analyst
7 2 (5.41%) Product Owner
7 2 (5.41%) Senior Manager
7 2 (5.41%) Senior Project Manager
7 2 (5.41%) Solutions Architect
8 1 (2.70%) ITSM Architect
8 1 (2.70%) SOC Analyst
Libraries, Frameworks & Software Standards
1 1 (2.70%) Middleware
1 1 (2.70%) Web Services
Miscellaneous
1 6 (16.22%) Product Ownership
2 5 (13.51%) OTC Derivatives
2 5 (13.51%) Wiki
3 2 (5.41%) CMDB
3 2 (5.41%) Fixed Income
3 2 (5.41%) Management Information System
3 2 (5.41%) PMI
4 1 (2.70%) Data Structures
4 1 (2.70%) Derivative
4 1 (2.70%) Equities
4 1 (2.70%) Foreign Exchange (FX)
4 1 (2.70%) IoT
4 1 (2.70%) Life Science
4 1 (2.70%) Security Posture
Processes & Methodologies
1 21 (56.76%) Agile
2 16 (43.24%) Business Analysis
3 12 (32.43%) Stakeholder Management
4 11 (29.73%) Project Management
5 9 (24.32%) Continuous Improvement
5 9 (24.32%) Stakeholder Engagement
6 8 (21.62%) Change Management
6 8 (21.62%) Project Delivery
6 8 (21.62%) Requirements Gathering
6 8 (21.62%) User Stories
7 7 (18.92%) Performance Metrics
7 7 (18.92%) Roadmaps
8 6 (16.22%) Change Control
8 6 (16.22%) Waterfall
8 6 (16.22%) Workshop Facilitation
9 5 (13.51%) DevOps
9 5 (13.51%) Project Governance
9 5 (13.51%) Sprint Planning
9 5 (13.51%) Sprint Retrospective
9 5 (13.51%) Sprint Review
Programming Languages
1 5 (13.51%) SQL
2 1 (2.70%) C#
2 1 (2.70%) Python
2 1 (2.70%) X++
Qualifications
1 7 (18.92%) Degree
2 2 (5.41%) CBAP
2 2 (5.41%) CFA
2 2 (5.41%) CRISC
2 2 (5.41%) PMI Certification
2 2 (5.41%) TOGAF Certification
3 1 (2.70%) CISA
3 1 (2.70%) CISM
3 1 (2.70%) CISMP
3 1 (2.70%) CISSP
3 1 (2.70%) Master's Degree
3 1 (2.70%) MCP
3 1 (2.70%) Microsoft Certification
Quality Assurance & Compliance
1 8 (21.62%) Data Quality
2 7 (18.92%) MiFID
3 5 (13.51%) PMO
4 4 (10.81%) GDPR
4 4 (10.81%) QA
5 3 (8.11%) ISO/IEC 27001
6 2 (5.41%) GRC
6 2 (5.41%) NIST
6 2 (5.41%) UCITS
7 1 (2.70%) Accessibility
7 1 (2.70%) AICPA
7 1 (2.70%) GxP
7 1 (2.70%) ISO 22301
7 1 (2.70%) PCI DSS
7 1 (2.70%) SOC 2
Vendors
1 13 (35.14%) Microsoft
2 5 (13.51%) Atlassian
2 5 (13.51%) GoldenSource
3 2 (5.41%) Bloomberg
3 2 (5.41%) BMC
3 2 (5.41%) Databricks
3 2 (5.41%) Salesforce
4 1 (2.70%) Google
4 1 (2.70%) Informatica
4 1 (2.70%) MuleSoft
4 1 (2.70%) SAP
4 1 (2.70%) Talend