Back Office Jobs in London

Back Office
England > London

The table below looks at the prevalence of the term Back Office in permanent job vacancies in London. Included is a benchmarking guide to the salaries offered in vacancies that cited Back Office over the 6 months leading up to 26 July 2024, comparing them to the same period in the previous two years.

6 months to
26 Jul 2024
Same period 2023 Same period 2022
Rank 278 272 430
Rank change year-on-year -6 +158 -110
Permanent jobs citing Back Office 218 343 658
As % of all permanent jobs advertised in London 1.05% 1.26% 0.88%
As % of the General category 1.53% 1.87% 1.24%
Number of salaries quoted 145 267 322
10th Percentile £50,000 £50,250 £41,250
25th Percentile £65,000 £65,000 £52,500
Median annual salary (50th Percentile) £80,000 £82,500 £75,000
Median % change year-on-year -3.03% +10.00% -
75th Percentile £110,000 £103,750 £93,750
90th Percentile £122,000 £118,500 £105,000
England median annual salary £60,000 £75,000 £60,250
% change year-on-year -20.00% +24.48% -13.93%

All General Skills
London

Back Office falls under the General Skills category. For comparison with the information above, the following table provides summary statistics for all permanent job vacancies requiring common skills in London.

Permanent vacancies with a requirement for common skills 14,244 18,353 53,034
As % of all permanent jobs advertised in London 68.68% 67.67% 70.70%
Number of salaries quoted 9,429 13,938 24,332
10th Percentile £37,000 £41,250 £41,250
25th Percentile £51,250 £53,750 £52,500
Median annual salary (50th Percentile) £72,500 £73,993 £70,000
Median % change year-on-year -2.02% +5.70% -
75th Percentile £95,000 £95,000 £92,500
90th Percentile £122,500 £120,000 £112,500
England median annual salary £55,000 £60,000 £60,000
% change year-on-year -8.33% - +4.35%

Back Office
Job Vacancy Trend in London

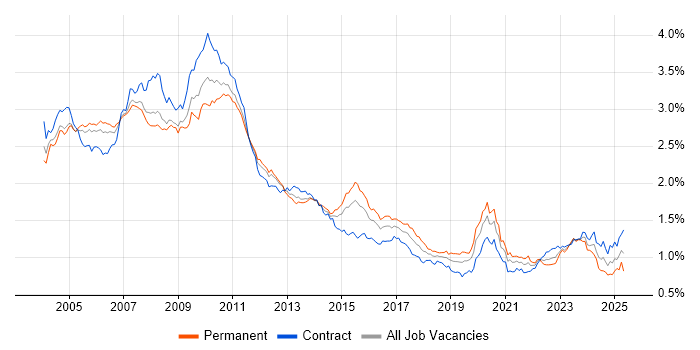
Job postings citing Back Office as a proportion of all IT jobs advertised in London.

Job vacancy trend for Back Office in London

Back Office
Salary Trend in London

3-month moving average salary quoted in jobs citing Back Office in London.

Salary trend for Back Office in London

Back Office
Salary Histogram in London

Salary distribution for jobs citing Back Office in London over the 6 months to 26 July 2024.

Salary histogram for Back Office in London

Back Office
Job Locations in London

The table below looks at the demand and provides a guide to the median salaries quoted in IT jobs citing Back Office within the London region over the 6 months to 26 July 2024. The 'Rank Change' column provides an indication of the change in demand within each location based on the same 6 month period last year.

Location Rank Change
on Same Period
Last Year
Matching
Permanent
IT Job Ads
Median Salary
Past 6 Months
Median Salary
% Change
on Same Period
Last Year
Live
Jobs
Central London +16 37 £92,500 +2.78% 4
East London +25 1 £120,000 +84.62% 1
West London -14 1 £32,500 -7.14% 1
South London -22 1 £29,000 -65.88% 1
Back Office
England

Back Office
Co-occurring Skills and Capabilities in London by Category

The follow tables expand on the table above by listing co-occurrences grouped by category. The same employment type, locality and period is covered with up to 20 co-occurrences shown in each of the following categories:

Application Platforms
1 13 (5.96%) Microsoft Exchange
2 2 (0.92%) GlassFish
2 2 (0.92%) JCAPS
2 2 (0.92%) WebLogic
2 2 (0.92%) WebSphere
2 2 (0.92%) WebSphere Application Server
3 1 (0.46%) Apache Pulsar
3 1 (0.46%) IIS
3 1 (0.46%) Oracle SOA Suite
Applications
1 25 (11.47%) Microsoft Excel
2 3 (1.38%) Microsoft Office
3 2 (0.92%) MS Visio
4 1 (0.46%) AutoCAD
Business Applications
1 7 (3.21%) NEC Housing
2 6 (2.75%) Oracle General Ledger
2 6 (2.75%) Oracle Subledger Accounting
3 5 (2.29%) Endur
4 4 (1.83%) Workday HCM
5 2 (0.92%) Adaptiv
5 2 (0.92%) Findur
5 2 (0.92%) Magento
5 2 (0.92%) Shopify
5 2 (0.92%) Unit4 Business World
6 1 (0.46%) Aladdin
6 1 (0.46%) Cognos Controller
6 1 (0.46%) Fidessa
6 1 (0.46%) Front Arena
6 1 (0.46%) IBM Planning Analytics
6 1 (0.46%) Markit EDM
6 1 (0.46%) Oracle Assets
6 1 (0.46%) Oracle Payables
6 1 (0.46%) Oracle Receivables
6 1 (0.46%) thinkFolio
Cloud Services
1 73 (33.49%) Azure
2 71 (32.57%) AWS
3 40 (18.35%) GCP
4 29 (13.30%) Power Platform
5 21 (9.63%) Azure DevOps
6 17 (7.80%) Azure Service Bus
7 14 (6.42%) Azure Monitor
7 14 (6.42%) Google Sheets
8 13 (5.96%) Azure Cosmos DB
8 13 (5.96%) Dynamics 365
8 13 (5.96%) Power Automate
9 7 (3.21%) SaaS
10 6 (2.75%) OCI
11 3 (1.38%) Google Compute Engine
11 3 (1.38%) Google Kubernetes Engine
11 3 (1.38%) Google Workspace
11 3 (1.38%) Microsoft 365
11 3 (1.38%) Virtual Private Cloud
12 1 (0.46%) Entra ID
12 1 (0.46%) npm
Communications & Networking
1 5 (2.29%) 5G
1 5 (2.29%) Broadband
2 4 (1.83%) SSH
2 4 (1.83%) TCP/IP
3 3 (1.38%) BGP
3 3 (1.38%) FTP
3 3 (1.38%) VLAN
3 3 (1.38%) VPN
4 1 (0.46%) DHCP
4 1 (0.46%) DNS
4 1 (0.46%) Firewall
Database & Business Intelligence
1 30 (13.76%) SQL Server
2 18 (8.26%) GIS
3 17 (7.80%) Power BI
4 13 (5.96%) Oracle Database
4 13 (5.96%) SQL Server Analysis Services
5 11 (5.05%) PostgreSQL
6 7 (3.21%) Data Warehouse
6 7 (3.21%) Oracle Database 12c
7 6 (2.75%) Relational Database
7 6 (2.75%) SAP BW
8 5 (2.29%) Geospatial Data
9 4 (1.83%) MongoDB
10 2 (0.92%) Big Data
10 2 (0.92%) Hadoop
10 2 (0.92%) MySQL
10 2 (0.92%) SQL Server Integration Services
10 2 (0.92%) SQL Server Reporting Services
11 1 (0.46%) Data Lake
Development Applications
1 6 (2.75%) JIRA
2 3 (1.38%) Ant
2 3 (1.38%) Maven
2 3 (1.38%) Postman
2 3 (1.38%) SpecFlow
3 2 (0.92%) Jenkins
3 2 (0.92%) JUnit
3 2 (0.92%) Selenium
3 2 (0.92%) Subversion
3 2 (0.92%) Visual Studio
4 1 (0.46%) Eclipse
4 1 (0.46%) Git
4 1 (0.46%) IntelliJ
4 1 (0.46%) Mercurial
4 1 (0.46%) SonarQube
4 1 (0.46%) Team Foundation Server
4 1 (0.46%) Visual Studio Code
General
1 128 (58.72%) Finance
2 78 (35.78%) Social Skills
3 47 (21.56%) Analytical Skills
4 45 (20.64%) Banking
4 45 (20.64%) Front Office
5 27 (12.39%) Inclusion and Diversity
6 21 (9.63%) Retail
7 20 (9.17%) Local Government
8 17 (7.80%) Public Sector
9 14 (6.42%) Organisational Skills
10 9 (4.13%) Law
11 7 (3.21%) Financial Institution
11 7 (3.21%) Police
12 6 (2.75%) General Ledger
13 5 (2.29%) Investment Banking
14 4 (1.83%) Advertising
15 3 (1.38%) Legal
15 3 (1.38%) Retail Banking
16 2 (0.92%) International Banking
16 2 (0.92%) Marketing
Job Titles
1 79 (36.24%) Senior
2 47 (21.56%) Analyst
3 42 (19.27%) Developer
4 33 (15.14%) Senior Developer
5 30 (13.76%) Lead
5 30 (13.76%) Software Engineer
6 29 (13.30%) Developer/Software Engineer
6 29 (13.30%) Senior Software Developer
6 29 (13.30%) Senior Software Engineer
7 28 (12.84%) .NET Developer
7 28 (12.84%) Architect
7 28 (12.84%) Senior .NET Developer
8 27 (12.39%) .NET Software Developer
8 27 (12.39%) .NET Software Engineer
8 27 (12.39%) Senior .NET Software Developer
8 27 (12.39%) Senior .NET Software Engineer
9 23 (10.55%) Applications Support
10 20 (9.17%) Business Analyst
11 17 (7.80%) Consultant
11 17 (7.80%) Senior Architect
Libraries, Frameworks & Software Standards
1 49 (22.48%) .NET
2 35 (16.06%) React
3 27 (12.39%) .NET Core
3 27 (12.39%) AngularJS
4 26 (11.93%) Redux
4 26 (11.93%) Vue
5 17 (7.80%) ASP.NET
5 17 (7.80%) FIX Protocol
6 13 (5.96%) ASP.NET Core
7 9 (4.13%) Pandas
8 8 (3.67%) Kafka
8 8 (3.67%) RESTful
9 7 (3.21%) REST
9 7 (3.21%) XML
10 5 (2.29%) .NET Framework
10 5 (2.29%) WCF
10 5 (2.29%) WinForms
10 5 (2.29%) XSLT
11 4 (1.83%) HTML
11 4 (1.83%) Web Services
Miscellaneous
1 43 (19.72%) Derivative
2 36 (16.51%) Equities
3 34 (15.60%) Fixed Income
3 34 (15.60%) Foreign Exchange (FX)
4 30 (13.76%) Hedge funds
5 21 (9.63%) Management Information System
6 17 (7.80%) Self-Motivation
7 15 (6.88%) Onboarding
8 13 (5.96%) Cloud Native
9 8 (3.67%) Hybrid Cloud
10 7 (3.21%) Driving Licence
11 6 (2.75%) Equity Derivative
11 6 (2.75%) Public Cloud
11 6 (2.75%) Reinsurance
12 5 (2.29%) Culture of Ownership
13 4 (1.83%) Data Centre
13 4 (1.83%) Distributed Systems
13 4 (1.83%) Product Ownership
14 3 (1.38%) Blog
14 3 (1.38%) Mainframe
Operating Systems
1 30 (13.76%) Unix
2 26 (11.93%) Windows
3 22 (10.09%) Linux
4 2 (0.92%) AIX
5 1 (0.46%) Solaris
5 1 (0.46%) Windows 10
5 1 (0.46%) Windows Server
5 1 (0.46%) Windows Server 2016
5 1 (0.46%) Windows Server 2019
Processes & Methodologies
1 62 (28.44%) Software Engineering
2 61 (27.98%) Agile
3 45 (20.64%) Asset Management
4 40 (18.35%) Problem-Solving
5 36 (16.51%) Investment Management
6 33 (15.14%) Technical Leadership
7 31 (14.22%) DevOps
8 28 (12.84%) Customer Service
9 27 (12.39%) Data Analysis
10 26 (11.93%) Continuous Improvement
11 24 (11.01%) ITIL
12 20 (9.17%) Migration
13 19 (8.72%) Coaching
13 19 (8.72%) OO
13 19 (8.72%) Roadmaps
14 18 (8.26%) Computer Science
14 18 (8.26%) Customer Experience
14 18 (8.26%) Scrum
15 17 (7.80%) Digital Transformation Programme
15 17 (7.80%) Service Management
Programming Languages
1 86 (39.45%) SQL
2 53 (24.31%) Python
3 49 (22.48%) C#
4 34 (15.60%) JavaScript
5 30 (13.76%) TypeScript
6 16 (7.34%) PowerShell
7 14 (6.42%) Bicep
7 14 (6.42%) Java
8 6 (2.75%) Shell Script
8 6 (2.75%) VBA
9 3 (1.38%) Bash
9 3 (1.38%) Go
10 2 (0.92%) XPath
Qualifications
1 44 (20.18%) Degree
2 16 (7.34%) Computer Science Degree
3 13 (5.96%) Oracle Certification
4 8 (3.67%) AWS Certification
4 8 (3.67%) Security Cleared
5 6 (2.75%) Master's Degree
6 3 (1.38%) CISM
6 3 (1.38%) ISEB
6 3 (1.38%) ISTQB
6 3 (1.38%) ISTQB Foundation Certification
7 2 (0.92%) CISA
7 2 (0.92%) ITIL Certification
7 2 (0.92%) ITIL Foundation Certificate
7 2 (0.92%) Microsoft Certification
7 2 (0.92%) Numerate Degree
8 1 (0.46%) Azure Certification
8 1 (0.46%) CISSP
8 1 (0.46%) Microsoft Certified Architect
8 1 (0.46%) SC Cleared
8 1 (0.46%) VMware Certified Professional (VCP)
Quality Assurance & Compliance
1 15 (6.88%) SLA
2 11 (5.05%) Accessibility
3 6 (2.75%) GAAP
3 6 (2.75%) IFRS
4 5 (2.29%) QA
5 4 (1.83%) EMIR
5 4 (1.83%) ISO/IEC 27001
5 4 (1.83%) MiFID
6 3 (1.38%) PCI DSS
6 3 (1.38%) SOC 2
7 2 (0.92%) COBIT
8 1 (0.46%) COSHH
8 1 (0.46%) Data Quality
8 1 (0.46%) ISO/IEC 27002 (supersedes ISO/IEC 17799)
8 1 (0.46%) NIST
System Software
1 27 (12.39%) Active Directory
2 12 (5.50%) Docker
3 2 (0.92%) VMware Infrastructure
4 1 (0.46%) Firmware
4 1 (0.46%) VMware ESXi
4 1 (0.46%) vSphere
Systems Management
1 13 (5.96%) Kubernetes
2 5 (2.29%) Control-M
3 4 (1.83%) Single Sign-On
4 1 (0.46%) Ansible
4 1 (0.46%) Hadoop YARN
4 1 (0.46%) SCOM
4 1 (0.46%) SCOrch
4 1 (0.46%) Terraform
4 1 (0.46%) vCenter Server
Vendors
1 43 (19.72%) Microsoft
2 38 (17.43%) Oracle
3 18 (8.26%) Google
4 8 (3.67%) SAP
5 7 (3.21%) NEC
6 6 (2.75%) PeopleSoft
6 6 (2.75%) ServiceNow
7 5 (2.29%) OpenLink
7 5 (2.29%) Virgin Media
8 4 (1.83%) IBM
8 4 (1.83%) Murex
8 4 (1.83%) Workday
9 3 (1.38%) Algorithmics
9 3 (1.38%) Bloomberg
9 3 (1.38%) ION Trading
9 3 (1.38%) Sophis
9 3 (1.38%) Sybase
9 3 (1.38%) VMware
10 2 (0.92%) Sun
10 2 (0.92%) Trayport