Middleware Jobs in London

Middleware
England > London

The table below provides summary statistics for permanent job vacancies advertised in London requiring Middleware skills. It includes a benchmarking guide to the annual salaries offered in vacancies that cited Middleware over the 6 months leading up to 18 July 2025, comparing them to the same period in the previous two years.

6 months to
18 Jul 2025
Same period 2024 Same period 2023
Rank 234 397 348
Rank change year-on-year +163 -49 +102
Permanent jobs citing Middleware 171 101 243
As % of all permanent jobs advertised in London 1.31% 0.45% 0.85%
As % of the Libraries, Frameworks & Software Standards category 4.81% 1.78% 2.68%
Number of salaries quoted 51 88 186
10th Percentile £56,250 £64,250 £52,500
25th Percentile £63,750 £76,250 £56,563
Median annual salary (50th Percentile) £95,000 £85,000 £65,000
Median % change year-on-year +11.76% +30.77% -7.14%
75th Percentile £126,250 £122,500 £80,938
90th Percentile £130,000 £145,000 £92,500
England median annual salary £73,000 £65,000 £65,000
% change year-on-year +12.31% - +8.33%

All Software Libraries and Frameworks
London

Middleware falls under the Software Libraries and Frameworks category. For comparison with the information above, the following table provides summary statistics for all permanent job vacancies requiring technical specification, industry standards, software libraries and framework skills in London.

Permanent vacancies with a requirement for technical specification, industry standards, software libraries and framework skills 3,558 5,664 9,058
As % of all permanent jobs advertised in London 27.26% 25.02% 31.83%
Number of salaries quoted 2,306 4,365 7,346
10th Percentile £51,250 £47,500 £50,000
25th Percentile £62,531 £61,250 £62,500
Median annual salary (50th Percentile) £82,500 £82,500 £80,000
Median % change year-on-year - +3.13% +6.67%
75th Percentile £111,250 £110,000 £100,000
90th Percentile £135,000 £142,500 £120,000
England median annual salary £67,500 £60,000 £67,500
% change year-on-year +12.50% -11.11% +3.85%

Middleware
Job Vacancy Trend in London

Job postings citing Middleware as a proportion of all IT jobs advertised in London.
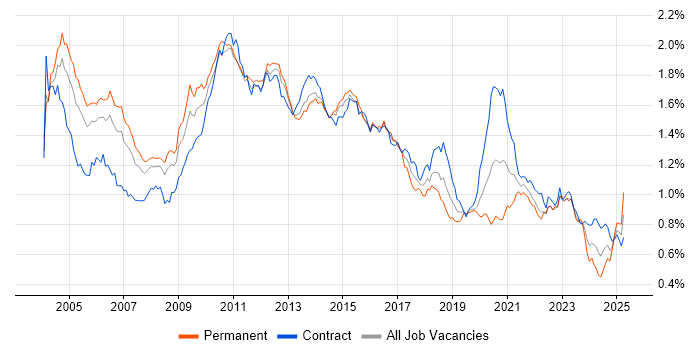
Job vacancy trend for Middleware in London

Middleware
Salary Trend in London

3-month moving average salary quoted in jobs citing Middleware in London.

Salary trend for Middleware in London

Middleware
Salary Histogram in London

Salary distribution for jobs citing Middleware in London over the 6 months to 18 July 2025.

Salary histogram for Middleware in London

Middleware
Job Locations in London

The table below looks at the demand and provides a guide to the median salaries quoted in IT jobs citing Middleware within the London region over the 6 months to 18 July 2025. The 'Rank Change' column provides an indication of the change in demand within each location based on the same 6 month period last year.

Location Rank Change
on Same Period
Last Year
Matching
Permanent
IT Job Ads
Median Salary
Past 6 Months
Median Salary
% Change
on Same Period
Last Year
Live
Jobs
Central London +50 23 £115,000 +24.32% 3
South London - 20 - - 7
West London - 16 - - 2
East London -12 10 - - 1
North London - 7 - -
Middleware
England

Middleware
Co-occurring Skills and Capabilities in London by Category

The follow tables expand on the table above by listing co-occurrences grouped by category. The same employment type, locality and period is covered with up to 20 co-occurrences shown in each of the following categories:

Application Platforms
1 4 (2.34%) Apache
1 4 (2.34%) Jupyter
2 3 (1.75%) BizTalk Server
2 3 (1.75%) WebSphere
3 2 (1.17%) GemFire
3 2 (1.17%) JBoss
4 1 (0.58%) Apache Airflow
4 1 (0.58%) Confluence
4 1 (0.58%) Drupal
4 1 (0.58%) Microsoft Exchange
4 1 (0.58%) nginx
4 1 (0.58%) SharePoint
4 1 (0.58%) WebLogic
4 1 (0.58%) WildFly
Applications
1 8 (4.68%) Maya
2 2 (1.17%) MS Visio
3 1 (0.58%) Microsoft Office
3 1 (0.58%) Microsoft Project
Business Applications
1 10 (5.85%) SAP IBP
1 10 (5.85%) SAP S/4HANA
2 3 (1.75%) Oracle EBS
2 3 (1.75%) Orchestrade
3 2 (1.17%) SAP Payroll
4 1 (0.58%) Dynamics NAV
4 1 (0.58%) Endur
4 1 (0.58%) Oracle Applications
Cloud Services
1 43 (25.15%) Azure
2 27 (15.79%) AWS
3 17 (9.94%) GCP
4 7 (4.09%) Salesforce Service Cloud
5 6 (3.51%) PaaS
6 4 (2.34%) Azure Synapse Analytics
6 4 (2.34%) Boomi
6 4 (2.34%) IaaS
6 4 (2.34%) Microsoft Purview
6 4 (2.34%) OCI
6 4 (2.34%) Power Platform
7 3 (1.75%) Azure Logic Apps
7 3 (1.75%) SaaS
7 3 (1.75%) Salesforce Sales Cloud
8 2 (1.17%) Azure DevOps
8 2 (1.17%) Dynamics 365
8 2 (1.17%) Kong
8 2 (1.17%) OpenShift
8 2 (1.17%) Serverless
8 2 (1.17%) SuccessFactors
Communications & Networking
1 67 (39.18%) Broadband
2 3 (1.75%) BGP
2 3 (1.75%) Cisco IOS
2 3 (1.75%) NX-OS
2 3 (1.75%) OSPF
2 3 (1.75%) Software-Defined Networking
2 3 (1.75%) TCP/IP
2 3 (1.75%) VXLAN
3 2 (1.17%) SSH
4 1 (0.58%) Firewall
4 1 (0.58%) NetScaler
4 1 (0.58%) Network Security
4 1 (0.58%) SSL
4 1 (0.58%) SWIFTNet
Database & Business Intelligence
1 11 (6.43%) Data Warehouse
2 10 (5.85%) SAP BW
3 7 (4.09%) RDBMS
3 7 (4.09%) Relational Database
4 6 (3.51%) SQL Server
5 4 (2.34%) KDB
5 4 (2.34%) Kdb+
5 4 (2.34%) Power BI
6 2 (1.17%) Redis
7 1 (0.58%) Azure SQL Database
7 1 (0.58%) BigQuery
7 1 (0.58%) Data Lake
7 1 (0.58%) NoSQL
7 1 (0.58%) Oracle Database
7 1 (0.58%) Oracle Exadata
7 1 (0.58%) Oracle Reports
Development Applications
1 75 (43.86%) JIRA
2 11 (6.43%) Git
3 4 (2.34%) Bitbucket
3 4 (2.34%) Jenkins
4 3 (1.75%) Artifactory
4 3 (1.75%) TeamCity
5 2 (1.17%) Ant
5 2 (1.17%) Cucumber
5 2 (1.17%) Maven
5 2 (1.17%) Mocha
5 2 (1.17%) Postman
5 2 (1.17%) Sonatype Nexus
6 1 (0.58%) Crucible
6 1 (0.58%) JUnit
6 1 (0.58%) Moq
6 1 (0.58%) NUnit
6 1 (0.58%) SoapUI
General
1 40 (23.39%) Social Skills
2 35 (20.47%) Finance
3 32 (18.71%) Banking
4 21 (12.28%) Analytical Skills
5 16 (9.36%) Law
6 11 (6.43%) Inclusion and Diversity
7 8 (4.68%) Automotive
7 8 (4.68%) Games
7 8 (4.68%) Manufacturing
7 8 (4.68%) Public Sector
7 8 (4.68%) Telecoms
8 7 (4.09%) Investment Banking
9 4 (2.34%) Front Office
9 4 (2.34%) Legal
10 3 (1.75%) French Language
10 3 (1.75%) Retail
11 2 (1.17%) Advertising
11 2 (1.17%) Local Government
12 1 (0.58%) Back Office
12 1 (0.58%) Financial Institution
Job Titles
1 67 (39.18%) Embedded Engineer
1 67 (39.18%) Release Engineer
2 32 (18.71%) Senior
3 30 (17.54%) Developer
4 24 (14.04%) Architect
5 20 (11.70%) Lead
6 19 (11.11%) C# Developer
7 12 (7.02%) Senior Developer
8 10 (5.85%) IT Architect
8 10 (5.85%) SAP Architect
8 10 (5.85%) Senior Architect
9 9 (5.26%) .NET Developer
9 9 (5.26%) C# .NET Developer
9 9 (5.26%) Senior C# Developer
10 8 (4.68%) SAP Functional Architect
11 7 (4.09%) C# Developer - Commodities
12 6 (3.51%) Lead Architect
12 6 (3.51%) Messaging Developer
12 6 (3.51%) Senior .NET Developer
12 6 (3.51%) Senior C# .NET Developer
Libraries, Frameworks & Software Standards
1 28 (16.37%) REST
2 22 (12.87%) FIX Protocol
3 21 (12.28%) .NET
4 15 (8.77%) SOAP
5 13 (7.60%) XML
6 11 (6.43%) .NET Core
7 9 (5.26%) Lightning Web Components
8 8 (4.68%) Oracle Fusion
8 8 (4.68%) RESTful
8 8 (4.68%) Web Services
9 7 (4.09%) AngularJS
9 7 (4.09%) Kafka
10 6 (3.51%) WebSockets
11 5 (2.92%) Visualforce
12 4 (2.34%) ADO
12 4 (2.34%) Elastic Stack
12 4 (2.34%) MERN Stack
12 4 (2.34%) Pandas
13 3 (1.75%) JWT
13 3 (1.75%) React
Miscellaneous
1 67 (39.18%) Embedded Systems
2 11 (6.43%) Foreign Exchange (FX)
3 9 (5.26%) Enterprise Software
4 8 (4.68%) PMI
4 8 (4.68%) Product Ownership
4 8 (4.68%) Reinsurance
5 6 (3.51%) Data Structures
6 4 (2.34%) Derivative
6 4 (2.34%) Equities
6 4 (2.34%) Public Cloud
7 3 (1.75%) Data Centre
7 3 (1.75%) Data Protection Act
8 2 (1.17%) Algorithms
8 2 (1.17%) Augmented Reality
8 2 (1.17%) Cloud Native
8 2 (1.17%) Fixed Income
8 2 (1.17%) Management Information System
8 2 (1.17%) Online Banking
8 2 (1.17%) SCADA
9 1 (0.58%) Clustering
Operating Systems
1 11 (6.43%) Linux
2 5 (2.92%) Red Hat Enterprise Linux
3 4 (2.34%) Unix
3 4 (2.34%) Windows
4 1 (0.58%) Amazon Linux
4 1 (0.58%) Debian
4 1 (0.58%) Solaris
4 1 (0.58%) Windows Server
4 1 (0.58%) zOS
Processes & Methodologies
1 128 (74.85%) Agile
2 95 (55.56%) CI/CD
3 93 (54.39%) Roadmaps
4 76 (44.44%) Artificial Intelligence
5 72 (42.11%) Software Delivery
6 70 (40.94%) Continuous Deployment
7 69 (40.35%) Strategic Thinking
8 67 (39.18%) Release Automation
9 35 (20.47%) DevOps
10 21 (12.28%) Microservices
11 20 (11.70%) Analytics
11 20 (11.70%) Continuous Integration
11 20 (11.70%) Mentoring
11 20 (11.70%) Problem-Solving
12 19 (11.11%) Stakeholder Management
13 17 (9.94%) Cybersecurity
13 17 (9.94%) ERP
14 16 (9.36%) Risk Management
15 15 (8.77%) Test Automation
16 14 (8.19%) Project Management
Programming Languages
1 22 (12.87%) C#
2 18 (10.53%) Java
2 18 (10.53%) SQL
3 17 (9.94%) Python
4 9 (5.26%) Apex Code
5 7 (4.09%) C++
6 6 (3.51%) JavaScript
7 4 (2.34%) Bash
7 4 (2.34%) Shell Script
8 3 (1.75%) PowerShell
9 2 (1.17%) C
9 2 (1.17%) Groovy
10 1 (0.58%) ActionScript
10 1 (0.58%) ActionScript 2.0
10 1 (0.58%) PL/SQL
10 1 (0.58%) Scala
10 1 (0.58%) TypeScript
Qualifications
1 13 (7.60%) Degree
2 9 (5.26%) PMI Certification
3 5 (2.92%) SC Cleared
3 5 (2.92%) Security Cleared
4 3 (1.75%) Azure Certification
5 2 (1.17%) Computer Science Degree
5 2 (1.17%) Master's Degree
6 1 (0.58%) ISEB
6 1 (0.58%) ISEB Practitioner
6 1 (0.58%) ISTQB
6 1 (0.58%) ISTQB Advanced Certification
6 1 (0.58%) ISTQB Foundation Certification
6 1 (0.58%) ITIL Foundation Certificate
6 1 (0.58%) PMP
Quality Assurance & Compliance
1 7 (4.09%) QA
2 4 (2.34%) Accessibility
3 3 (1.75%) Data Quality
3 3 (1.75%) ISO/IEC 27001
3 3 (1.75%) Sarbanes-Oxley
3 3 (1.75%) WCAG
4 2 (1.17%) Cyber Essentials
4 2 (1.17%) GDPR
5 1 (0.58%) ISO 20022
5 1 (0.58%) PMO
System Software
1 9 (5.26%) Docker
2 1 (0.58%) Active Directory
2 1 (0.58%) Firmware
2 1 (0.58%) Virtual Machines
2 1 (0.58%) VMware ESXi
Systems Management
1 11 (6.43%) Kubernetes
2 7 (4.09%) Ansible
3 4 (2.34%) Terraform
4 2 (1.17%) Grafana
4 2 (1.17%) Podman
4 2 (1.17%) Prometheus
4 2 (1.17%) Puppet
5 1 (0.58%) HP ALM
5 1 (0.58%) Oracle RMAN
Vendors
1 13 (7.60%) SAP
2 12 (7.02%) Salesforce
3 11 (6.43%) MuleSoft
4 10 (5.85%) Ariba
4 10 (5.85%) Oracle
5 4 (2.34%) Databricks
5 4 (2.34%) Microsoft
6 3 (1.75%) Avaloq
6 3 (1.75%) Barracuda Networks
6 3 (1.75%) Cisco
6 3 (1.75%) TIBCO
7 2 (1.17%) Red Hat
7 2 (1.17%) Splunk
7 2 (1.17%) Trayport
8 1 (0.58%) DocuSign
8 1 (0.58%) FIS
8 1 (0.58%) FXall
8 1 (0.58%) Jitterbit
8 1 (0.58%) ServiceNow
8 1 (0.58%) Zuora