Validation Jobs in London

Validation
England > London

The following table provides summary statistics for permanent job vacancies advertised in London with a requirement for Validation skills. Included is a benchmarking guide to the salaries offered in vacancies that have cited Validation over the 6 months to 27 April 2024 with a comparison to the same period in the previous 2 years.

6 months to
27 Apr 2024
Same period 2023 Same period 2022
Rank 251 217 235
Rank change year-on-year -34 +18 +67
Permanent jobs citing Validation 281 600 1,186
As % of all permanent jobs advertised in London 1.20% 1.68% 1.81%
As % of the Processes & Methodologies category 1.31% 1.76% 1.87%
Number of salaries quoted 172 271 446
10th Percentile £48,000 £45,000 £50,813
25th Percentile £63,000 £52,500 £60,000
Median annual salary (50th Percentile) £75,000 £70,000 £78,800
Median % change year-on-year +7.14% -11.17% +31.33%
75th Percentile £97,500 £88,750 £92,500
90th Percentile £118,750 £95,000 £105,000
England median annual salary £55,000 £62,500 £60,000
% change year-on-year -12.00% +4.17% +13.21%

All Process and Methodology Skills
London

Validation is in the Processes and Methodologies category. The following table is for comparison with the above and provides summary statistics for all permanent job vacancies advertised in London with a requirement for process or methodology skills.

Permanent vacancies with a requirement for process or methodology skills 21,454 34,168 63,282
As % of all permanent jobs advertised in London 91.39% 95.40% 96.83%
Number of salaries quoted 15,999 24,428 34,404
10th Percentile £38,000 £43,750 £42,500
25th Percentile £52,250 £55,000 £53,750
Median annual salary (50th Percentile) £70,000 £75,000 £70,000
Median % change year-on-year -6.67% +7.14% -
75th Percentile £95,000 £95,000 £92,500
90th Percentile £115,000 £115,000 £111,250
England median annual salary £55,000 £62,500 £60,000
% change year-on-year -12.00% +4.17% +9.09%

Validation
Job Vacancy Trend in London

Job postings citing Validation as a proportion of all IT jobs advertised in London.
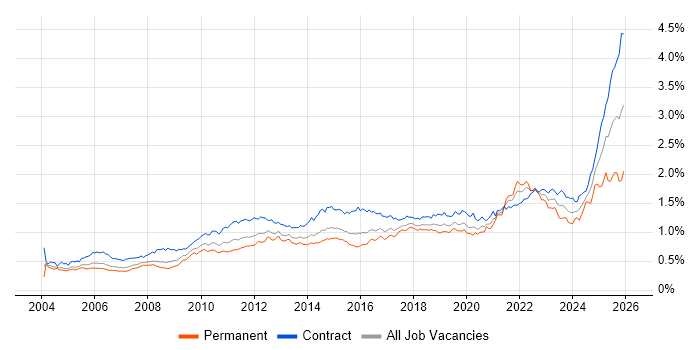
Job vacancy trend for Validation in London

Validation
Salary Trend in London

3-month moving average salary quoted in jobs citing Validation in London.

Salary trend for Validation in London

Validation
Salary Histogram in London

Salary distribution for jobs citing Validation in London over the 6 months to 27 April 2024.

Salary histogram for Validation in London

Validation
Job Locations in London

The table below looks at the demand and provides a guide to the median salaries quoted in IT jobs citing Validation within the London region over the 6 months to 27 April 2024. The 'Rank Change' column provides an indication of the change in demand within each location based on the same 6 month period last year.

Location Rank Change
on Same Period
Last Year
Matching
Permanent
IT Job Ads
Median Salary
Past 6 Months
Median Salary
% Change
on Same Period
Last Year
Live
Jobs
Central London +51 61 £72,500 -14.71% 12
South London +6 16 £70,000 +30.84% 2
West London -3 7 £75,000 +36.36% 10
North London - 2 £71,250 -
Validation
England

Validation
Co-occurring Skills and Capabilities in London by Category

The follow tables expand on the table above by listing co-occurrences grouped by category. The same employment type, locality and period is covered with up to 20 co-occurrences shown in each of the following categories:

Application Platforms
1 13 (4.63%) SAS
2 9 (3.20%) Apache Spark
3 5 (1.78%) Apache
4 4 (1.42%) Jupyter
5 3 (1.07%) Smallworld
6 2 (0.71%) Confluence
7 1 (0.36%) Anypoint
7 1 (0.36%) SharePoint
Applications
1 8 (2.85%) Microsoft Excel
2 7 (2.49%) Microsoft PowerPoint
2 7 (2.49%) MS Visio
3 3 (1.07%) AutoCAD
3 3 (1.07%) Microsoft Office
4 2 (0.71%) Adobe After Effects
4 2 (0.71%) Adobe Premiere
4 2 (0.71%) Photoshop
5 1 (0.36%) Spreadsheet
5 1 (0.36%) Windchill
Business Applications
1 14 (4.98%) Dynamics CRM
2 8 (2.85%) SAP S/4HANA
3 4 (1.42%) SAP BPC
3 4 (1.42%) SAP CO
3 4 (1.42%) SAP CRM
3 4 (1.42%) SAP FI
3 4 (1.42%) SAP FI/CO
4 3 (1.07%) SAP PM
5 2 (0.71%) Teamcenter
6 1 (0.36%) Aladdin
6 1 (0.36%) Dynamics AX
6 1 (0.36%) NetSuite
6 1 (0.36%) Oracle Financials
6 1 (0.36%) SAP HCM
6 1 (0.36%) thinkFolio
Cloud Services
1 37 (13.17%) Azure
2 26 (9.25%) AWS
2 26 (9.25%) Power Platform
3 20 (7.12%) Microsoft 365
4 12 (4.27%) Azure DevOps
4 12 (4.27%) Cloud Computing
5 9 (3.20%) Dynamics 365
5 9 (3.20%) Microsoft Purview
6 8 (2.85%) Azure Sentinel
6 8 (2.85%) SaaS
7 6 (2.14%) dbt
7 6 (2.14%) GitHub
7 6 (2.14%) Serverless
8 5 (1.78%) Amazon S3
8 5 (1.78%) IaaS
8 5 (1.78%) PaaS
9 4 (1.42%) GCP
9 4 (1.42%) Prefect
10 3 (1.07%) Azure Data Factory
10 3 (1.07%) Azure Synapse Analytics
Communications & Networking
1 31 (11.03%) VSAT
2 14 (4.98%) Firewall
3 9 (3.20%) LAN
3 9 (3.20%) TCP/IP
3 9 (3.20%) Wireshark
4 8 (2.85%) Network Security
4 8 (2.85%) WAN
5 2 (0.71%) Wireless
6 1 (0.36%) BGP
6 1 (0.36%) Cisco Nexus
6 1 (0.36%) DHCP
6 1 (0.36%) DNS
6 1 (0.36%) Internet
6 1 (0.36%) MPLS
6 1 (0.36%) NX-OS
6 1 (0.36%) Radio Access Network
6 1 (0.36%) SNMP
6 1 (0.36%) tcpdump
6 1 (0.36%) VXLAN
6 1 (0.36%) Wi-Fi
Database & Business Intelligence
1 24 (8.54%) Data Warehouse
2 20 (7.12%) SQL Server
3 18 (6.41%) Power BI
4 11 (3.91%) GIS
5 10 (3.56%) Tableau
6 9 (3.20%) Data Lake
7 7 (2.49%) Amazon QuickSight
7 7 (2.49%) Data Mining
7 7 (2.49%) Metadata
7 7 (2.49%) Oracle Reports
8 6 (2.14%) Amazon Redshift
8 6 (2.14%) Big Data
8 6 (2.14%) SAP HANA
9 4 (1.42%) NoSQL
9 4 (1.42%) QGIS
9 4 (1.42%) SAP BW
9 4 (1.42%) SQL Server Integration Services
10 3 (1.07%) Geospatial Data
10 3 (1.07%) OLAP
10 3 (1.07%) Spatial Data
Development Applications
1 8 (2.85%) JIRA
2 7 (2.49%) Git
3 5 (1.78%) GitLab
4 4 (1.42%) Jenkins
5 3 (1.07%) ER Studio
5 3 (1.07%) ERwin
5 3 (1.07%) Maven
6 2 (0.71%) Cypress.io
6 2 (0.71%) Selenium
7 1 (0.36%) Appium
7 1 (0.36%) JMeter
7 1 (0.36%) Postman
7 1 (0.36%) XCUITest
General
1 109 (38.79%) Finance
2 79 (28.11%) Social Skills
3 50 (17.79%) Analytical Skills
4 20 (7.12%) Pharmaceutical
5 16 (5.69%) Banking
5 16 (5.69%) Retail
6 13 (4.63%) Legal
7 12 (4.27%) Law
8 10 (3.56%) Inclusion and Diversity
9 8 (2.85%) Documentation Skills
9 8 (2.85%) Influencing Skills
10 7 (2.49%) Financial Institution
10 7 (2.49%) German Language
10 7 (2.49%) Marketing
11 6 (2.14%) Presentation Skills
12 5 (1.78%) Advertising
13 4 (1.42%) Front Office
13 4 (1.42%) International Banking
13 4 (1.42%) Japanese Language
13 4 (1.42%) Spanish Language
Job Titles
1 59 (21.00%) Analyst
2 51 (18.15%) Senior
3 48 (17.08%) Architect
4 31 (11.03%) Software Architect
5 26 (9.25%) Business Analyst
5 26 (9.25%) Lead
6 16 (5.69%) Data Engineer
6 16 (5.69%) Senior Manager
7 14 (4.98%) Senior Analyst
8 13 (4.63%) Engineering Manager
9 12 (4.27%) Consultant
9 12 (4.27%) Developer
10 10 (3.56%) Lead Software Engineer
10 10 (3.56%) Security Engineer
10 10 (3.56%) Software Engineer
10 10 (3.56%) Systems Analyst
11 9 (3.20%) Insurance Business Analyst
11 9 (3.20%) IT Manager
12 8 (2.85%) Technical Leader
12 8 (2.85%) Test Analyst
Libraries, Frameworks & Software Standards
1 16 (5.69%) XML
2 12 (4.27%) JSON
3 11 (3.91%) .NET
4 10 (3.56%) .NET Core
4 10 (3.56%) HTML
4 10 (3.56%) Pandas
5 8 (2.85%) .NET Framework
5 8 (2.85%) Akka.NET
5 8 (2.85%) AngularJS
5 8 (2.85%) CSS
5 8 (2.85%) jQuery
6 7 (2.49%) NumPy
7 6 (2.14%) Oracle Fusion
8 5 (1.78%) ATL
8 5 (1.78%) PySpark
8 5 (1.78%) Shiny
9 4 (1.42%) Kafka
10 3 (1.07%) D3.js
10 3 (1.07%) Node.js
10 3 (1.07%) REST
Miscellaneous
1 25 (8.90%) Management Information System
2 17 (6.05%) Self-Motivation
3 13 (4.63%) Onboarding
4 12 (4.27%) Product Ownership
5 8 (2.85%) Algorithms
5 8 (2.85%) Greenfield Project
5 8 (2.85%) PDA
5 8 (2.85%) Security Operations Centre
6 6 (2.14%) Cloud Native
6 6 (2.14%) NHS
7 5 (1.78%) Cloud Security Posture
7 5 (1.78%) Credit Risk
7 5 (1.78%) iPhone
7 5 (1.78%) Robotics
7 5 (1.78%) Security Posture
8 4 (1.42%) Foreign Exchange (FX)
8 4 (1.42%) Life Science
8 4 (1.42%) Public Cloud
8 4 (1.42%) SWIFT Messaging Network
9 3 (1.07%) Data Structures
Operating Systems
1 13 (4.63%) Apple iOS
2 11 (3.91%) Windows
3 8 (2.85%) Android
4 3 (1.07%) Linux
4 3 (1.07%) Unix
Processes & Methodologies
1 71 (25.27%) Agile
2 52 (18.51%) Problem-Solving
3 49 (17.44%) Decision-Making
4 48 (17.08%) Model Validation
5 46 (16.37%) Data Validation
6 41 (14.59%) Project Management
7 40 (14.23%) Actionable Insight
8 39 (13.88%) Technical Architecture
9 36 (12.81%) Data Science
10 35 (12.46%) Data Modelling
10 35 (12.46%) User Acceptance Testing
11 33 (11.74%) Analytics
11 33 (11.74%) Requirements Management
12 31 (11.03%) Network Architecture
12 31 (11.03%) Network Management
12 31 (11.03%) TOGAF
13 30 (10.68%) Cybersecurity
13 30 (10.68%) Mentoring
13 30 (10.68%) Migration
14 29 (10.32%) Computer Science
Programming Languages
1 64 (22.78%) Python
2 52 (18.51%) SQL
3 16 (5.69%) R
4 14 (4.98%) Java
5 12 (4.27%) C#
6 11 (3.91%) JavaScript
7 10 (3.56%) PowerShell
8 9 (3.20%) T-SQL
9 8 (2.85%) C++
10 5 (1.78%) MATLAB
11 4 (1.42%) C
12 3 (1.07%) Kotlin
13 2 (0.71%) Go
13 2 (0.71%) Google Apps Script
13 2 (0.71%) Rust
13 2 (0.71%) Scala
13 2 (0.71%) Shell Script
14 1 (0.36%) Data Analysis Expressions
14 1 (0.36%) SPARQL
14 1 (0.36%) TypeScript
Qualifications
1 51 (18.15%) Degree
2 16 (5.69%) CISSP
3 14 (4.98%) Cisco Certification
4 13 (4.63%) (ISC)2 CCSP
4 13 (4.63%) CCSP
4 13 (4.63%) Security Cleared
5 10 (3.56%) ISEB
6 9 (3.20%) Computer Science Degree
6 9 (3.20%) Master's Degree
7 8 (2.85%) CEH
7 8 (2.85%) Microsoft Certification
7 8 (2.85%) SANS
7 8 (2.85%) SSCP
8 6 (2.14%) SC Cleared
9 5 (1.78%) CCSK
10 3 (1.07%) BPSS Clearance
10 3 (1.07%) CESG Certified Professional
10 3 (1.07%) CLAS
10 3 (1.07%) DV Cleared
10 3 (1.07%) PCI QSA
Quality Assurance & Compliance
1 22 (7.83%) ISO/IEC 27001
2 20 (7.12%) Data Quality
2 20 (7.12%) NIST
2 20 (7.12%) QA
3 13 (4.63%) PCI DSS
4 8 (2.85%) GDPR
4 8 (2.85%) ISO/IEC 17025
5 6 (2.14%) Def Stans
5 6 (2.14%) ISO 9001
6 5 (1.78%) Good Clinical Practice
6 5 (1.78%) NIST 800
6 5 (1.78%) PMO
7 4 (1.42%) CDISC
8 3 (1.07%) HMG Security Policy Framework
8 3 (1.07%) IFRS
8 3 (1.07%) IFRS 9
8 3 (1.07%) JSP 440
8 3 (1.07%) RMADS
8 3 (1.07%) SLA
9 2 (0.71%) ISO 20022
System Software
1 8 (2.85%) Virtual Desktop
2 6 (2.14%) Active Directory
3 2 (0.71%) Docker
3 2 (0.71%) VMware Infrastructure
4 1 (0.36%) VMware ESXi
Systems Management
1 9 (3.20%) Nmap
2 8 (2.85%) Microsoft Intune
3 5 (1.78%) Single Sign-On
3 5 (1.78%) Terraform
4 2 (0.71%) Kibana
4 2 (0.71%) Kubernetes
5 1 (0.36%) Ansible
5 1 (0.36%) Jamf Pro
5 1 (0.36%) OpenNMS
5 1 (0.36%) Podman
Vendors
1 50 (17.79%) Microsoft
2 19 (6.76%) SAP
3 11 (3.91%) Oracle
4 10 (3.56%) Databricks
5 9 (3.20%) Google
5 9 (3.20%) Splunk
6 8 (2.85%) Qualys
6 8 (2.85%) Rapid7
6 8 (2.85%) Thycotic
7 6 (2.14%) CA
8 5 (1.78%) Alteryx
8 5 (1.78%) Anaplan
9 4 (1.42%) Cisco
9 4 (1.42%) IBM
9 4 (1.42%) Informatica
10 3 (1.07%) Cloudera
10 3 (1.07%) Embarcadero
10 3 (1.07%) Salesforce
10 3 (1.07%) Snow
10 3 (1.07%) VMware