GCP Jobs in the South East

Google Cloud Platform (GCP)
England > South East

The table below provides summary statistics for permanent job vacancies advertised in the South East requiring GCP skills. It includes a benchmarking guide to the annual salaries offered in vacancies that cited GCP over the 6 months leading up to 31 May 2025, comparing them to the same period in the previous two years.

6 months to
31 May 2025
Same period 2024 Same period 2023
Rank 155 194 104
Rank change year-on-year +39 -90 +2
Permanent jobs citing GCP 179 226 419
As % of all permanent jobs advertised in the South East 1.85% 1.28% 3.01%
As % of the Cloud Services category 8.49% 4.29% 8.16%
Number of salaries quoted 71 118 196
10th Percentile £28,750 £41,250 £46,250
25th Percentile £53,125 £48,750 £52,500
Median annual salary (50th Percentile) £65,000 £61,750 £70,000
Median % change year-on-year +5.26% -11.79% -
75th Percentile £75,000 £81,250 £92,500
90th Percentile £82,500 £96,250 £100,000
England median annual salary £82,500 £80,000 £80,000
% change year-on-year +3.13% - -

All Cloud Skills
South East

GCP falls under the Cloud Services category. For comparison with the information above, the following table provides summary statistics for all permanent job vacancies requiring cloud computing skills in the South East.

Permanent vacancies with a requirement for cloud computing skills 2,108 5,271 5,136
As % of all permanent jobs advertised in the South East 21.77% 29.91% 36.93%
Number of salaries quoted 1,250 4,062 3,588
10th Percentile £28,500 £28,000 £30,500
25th Percentile £37,500 £37,500 £41,250
Median annual salary (50th Percentile) £55,000 £50,000 £55,875
Median % change year-on-year +10.00% -10.51% +1.59%
75th Percentile £69,840 £65,000 £75,000
90th Percentile £83,750 £80,000 £90,000
England median annual salary £60,000 £57,500 £65,000
% change year-on-year +4.35% -11.54% +4.00%

GCP
Job Vacancy Trend in the South East

Job postings citing GCP as a proportion of all IT jobs advertised in the South East.
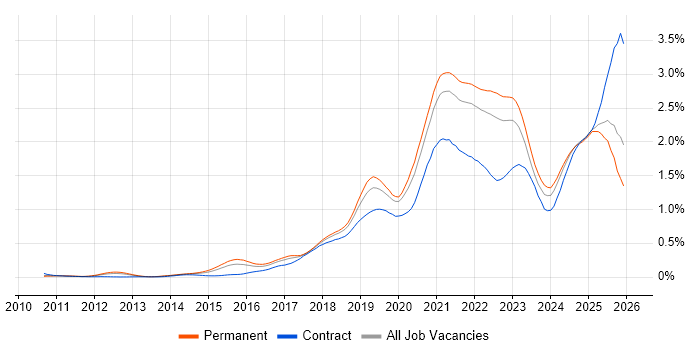
Job vacancy trend for GCP in the South East

GCP
Salary Trend in the South East

3-month moving average salary quoted in jobs citing GCP in the South East.

Salary trend for GCP in the South East

GCP
Salary Histogram in the South East

Salary distribution for jobs citing GCP in the South East over the 6 months to 31 May 2025.

Salary histogram for GCP in the South East

GCP
Job Locations in the South East

The table below looks at the demand and provides a guide to the median salaries quoted in IT jobs citing GCP within the South East region over the 6 months to 31 May 2025. The 'Rank Change' column provides an indication of the change in demand within each location based on the same 6 month period last year.

Location Rank Change
on Same Period
Last Year
Matching
Permanent
IT Job Ads
Median Salary
Past 6 Months
Median Salary
% Change
on Same Period
Last Year
Live
Jobs
Thames Valley +63 97 £56,250 -13.46% 53
Berkshire +80 68 £77,500 -3.13% 31
Hampshire +65 28 £65,000 +13.04% 28
Surrey +43 24 £72,500 +16.00% 12
Oxfordshire +15 19 £42,500 -29.17% 18
Middlesex -2 15 £90,000 - 3
Buckinghamshire +15 10 £56,250 +45.16% 7
Kent +11 9 £70,000 -1.41% 3
East Sussex +5 5 £75,000 +42.86% 2
GCP
England

GCP
Co-occurring Skills and Capabilities in the South East by Category

The follow tables expand on the table above by listing co-occurrences grouped by category. The same employment type, locality and period is covered with up to 20 co-occurrences shown in each of the following categories:

Application Platforms
1 11 (6.15%) Apache Spark
2 8 (4.47%) Confluence
3 6 (3.35%) Microsoft Exchange
4 2 (1.12%) Apache
5 1 (0.56%) OpenStack
Applications
1 7 (3.91%) Microsoft Office
Cloud Services
1 155 (86.59%) Azure
2 151 (84.36%) AWS
3 31 (17.32%) Serverless
4 26 (14.53%) AWS Lambda
5 24 (13.41%) Snowflake
6 13 (7.26%) Azure Monitor
7 10 (5.59%) SaaS
8 9 (5.03%) Azure Data Factory
8 9 (5.03%) Azure Synapse Analytics
8 9 (5.03%) PaaS
9 7 (3.91%) Microsoft 365
10 6 (3.35%) OpenShift
11 5 (2.79%) GitHub
12 4 (2.23%) Azure DevOps
12 4 (2.23%) Azure Sentinel
12 4 (2.23%) Cloud Computing
12 4 (2.23%) dbt
12 4 (2.23%) Google Kubernetes Engine
12 4 (2.23%) Power Platform
13 3 (1.68%) IaaS
Communications & Networking
1 25 (13.97%) Broadband
2 13 (7.26%) DHCP
2 13 (7.26%) DNS
3 11 (6.15%) Firewall
4 8 (4.47%) Network Security
5 7 (3.91%) TCP/IP
6 6 (3.35%) Remote Desktop
6 6 (3.35%) SMTP
7 4 (2.23%) VPN
8 3 (1.68%) LAN
8 3 (1.68%) WAN
9 1 (0.56%) MQTT
Database & Business Intelligence
1 35 (19.55%) Data Lake
1 35 (19.55%) Data Warehouse
2 29 (16.20%) Metadata
3 15 (8.38%) MongoDB
4 11 (6.15%) Big Data
4 11 (6.15%) Hadoop
4 11 (6.15%) NoSQL
5 10 (5.59%) SQL Server
6 9 (5.03%) Data Mining
7 7 (3.91%) MySQL
8 6 (3.35%) Amazon RDS
8 6 (3.35%) PostgreSQL
9 4 (2.23%) Looker
10 3 (1.68%) BigQuery
10 3 (1.68%) Redis
11 2 (1.12%) Apache Hive
11 2 (1.12%) Bigtable
11 2 (1.12%) HBase
11 2 (1.12%) Impala
11 2 (1.12%) Tableau
Development Applications
1 15 (8.38%) Git
2 13 (7.26%) GitLab
3 12 (6.70%) Jenkins
4 9 (5.03%) JIRA
5 8 (4.47%) Bitbucket
5 8 (4.47%) Cucumber
5 8 (4.47%) Maven
5 8 (4.47%) Selenium
5 8 (4.47%) SonarQube
5 8 (4.47%) Sonatype Nexus
6 3 (1.68%) JUnit
6 3 (1.68%) Mockito
7 1 (0.56%) Burp Suite
7 1 (0.56%) Cypress.io
7 1 (0.56%) ESLint
7 1 (0.56%) Gatling
7 1 (0.56%) JMeter
General
1 69 (38.55%) Law
2 68 (37.99%) Social Skills
3 50 (27.93%) Analytical Skills
4 26 (14.53%) Finance
5 20 (11.17%) Inclusion and Diversity
6 14 (7.82%) Retail
7 13 (7.26%) Legal
7 13 (7.26%) Telecoms
8 8 (4.47%) Banking
9 3 (1.68%) Public Sector
10 2 (1.12%) Pharmaceutical
11 1 (0.56%) Manufacturing
Job Titles
1 107 (59.78%) Senior
2 37 (20.67%) Lead
3 25 (13.97%) Machine Learning Engineer
4 19 (10.61%) Developer
5 15 (8.38%) Software Engineer
6 14 (7.82%) Support Engineer
7 13 (7.26%) Senior Manager
8 11 (6.15%) Infrastructure Engineer
9 10 (5.59%) Cloud Engineer
9 10 (5.59%) Platform Engineer
10 9 (5.03%) Data Analytics Director
10 9 (5.03%) Senior Developer
11 8 (4.47%) IT Engineer
11 8 (4.47%) Java Developer
12 7 (3.91%) IT Support
12 7 (3.91%) IT Support Engineer
12 7 (3.91%) Senior Cloud Engineer
13 6 (3.35%) Infrastructure Support Engineer
13 6 (3.35%) Node.js Developer
13 6 (3.35%) Security Engineer
Libraries, Frameworks & Software Standards
1 25 (13.97%) Kafka
2 21 (11.73%) Node.js
2 21 (11.73%) React
3 16 (8.94%) Spring Boot
4 13 (7.26%) CSS
4 13 (7.26%) HTML
4 13 (7.26%) Hugging Face
4 13 (7.26%) LangChain
4 13 (7.26%) PyTorch
4 13 (7.26%) TensorFlow
5 11 (6.15%) Hibernate
5 11 (6.15%) Spring
6 8 (4.47%) JPA
6 8 (4.47%) Redux
7 7 (3.91%) .NET
7 7 (3.91%) Next.js
7 7 (3.91%) RabbitMQ
8 6 (3.35%) .NET Core
8 6 (3.35%) AngularJS
8 6 (3.35%) LAMP
Miscellaneous
1 25 (13.97%) Self-Motivation
2 19 (10.61%) Management Information System
3 16 (8.94%) Cloud Native
4 13 (7.26%) Public Cloud
5 10 (5.59%) Product Ownership
6 9 (5.03%) Algorithms
7 8 (4.47%) Enterprise Software
8 6 (3.35%) Clustering
8 6 (3.35%) Greenfield Project
8 6 (3.35%) Legacy Systems
8 6 (3.35%) PKI
9 4 (2.23%) Hackathon
9 4 (2.23%) Security Posture
10 2 (1.12%) Hybrid Cloud
10 2 (1.12%) Low-Code
10 2 (1.12%) Virtual Team
11 1 (0.56%) IoT
11 1 (0.56%) Private Cloud
11 1 (0.56%) Video Conferencing
Operating Systems
1 22 (12.29%) Windows
2 20 (11.17%) Linux
3 6 (3.35%) Windows Server
4 1 (0.56%) Windows Server 2003
Processes & Methodologies
1 76 (42.46%) CI/CD
2 68 (37.99%) Agile
3 62 (34.64%) Analytics
3 62 (34.64%) Problem-Solving
4 58 (32.40%) Data Science
5 56 (31.28%) Machine Learning
6 55 (30.73%) DevOps
7 43 (24.02%) Data Engineering
8 40 (22.35%) Data Modelling
8 40 (22.35%) High Availability
9 38 (21.23%) Clean Code
9 38 (21.23%) Data Governance
10 37 (20.67%) Artificial Intelligence
10 37 (20.67%) Incident Management
11 36 (20.11%) Computer Science
11 36 (20.11%) Data Architecture
11 36 (20.11%) Use Case
12 34 (18.99%) Mentoring
12 34 (18.99%) Stakeholder Management
13 33 (18.44%) ETL
Programming Languages
1 77 (43.02%) Python
2 55 (30.73%) SQL
3 28 (15.64%) TypeScript
4 23 (12.85%) Java
4 23 (12.85%) JavaScript
5 17 (9.50%) PowerShell
6 8 (4.47%) Go
7 6 (3.35%) Bash
7 6 (3.35%) PHP
8 4 (2.23%) Kusto Query Language
9 2 (1.12%) Ruby
Qualifications
1 94 (52.51%) Degree
2 26 (14.53%) Computer Science Degree
3 25 (13.97%) Master's Degree
3 25 (13.97%) PhD
4 13 (7.26%) Security Cleared
5 11 (6.15%) AWS Certification
6 10 (5.59%) Azure Certification
7 9 (5.03%) Microsoft Certification
8 7 (3.91%) A+ Certification
8 7 (3.91%) DV Cleared
8 7 (3.91%) MCP
9 6 (3.35%) CISSP
9 6 (3.35%) SC Cleared
10 4 (2.23%) CEH
10 4 (2.23%) CISM
10 4 (2.23%) CompTIA Security+
10 4 (2.23%) OSCP
11 2 (1.12%) CCFP
11 2 (1.12%) GCFE
11 2 (1.12%) GREM
Quality Assurance & Compliance
1 32 (17.88%) QA
2 26 (14.53%) Accessibility
2 26 (14.53%) Data Quality
3 14 (7.82%) GDPR
4 9 (5.03%) California Consumer Privacy Act
5 5 (2.79%) HIPAA
5 5 (2.79%) ISO/IEC 27001
6 4 (2.23%) NIST
7 1 (0.56%) SOC 2
System Software
1 40 (22.35%) Docker
2 16 (8.94%) Active Directory
3 10 (5.59%) Hyper-V
3 10 (5.59%) VMware Infrastructure
4 7 (3.91%) vSphere
5 6 (3.35%) BitLocker
5 6 (3.35%) Microsoft App-V
5 6 (3.35%) Terminal Services
5 6 (3.35%) VMware ESXi
6 3 (1.68%) Virtual Desktop
7 2 (1.12%) HDFS
7 2 (1.12%) Virtual Machines
Systems Management
1 56 (31.28%) Kubernetes
2 29 (16.20%) Terraform
3 23 (12.85%) Ansible
4 22 (12.29%) Grafana
4 22 (12.29%) Prometheus
5 10 (5.59%) Puppet
6 6 (3.35%) Nagios
6 6 (3.35%) vCenter Server
6 6 (3.35%) vMotion
7 4 (2.23%) QRadar
8 3 (1.68%) SCCM
9 2 (1.12%) EnCase
9 2 (1.12%) FTK
9 2 (1.12%) Hadoop YARN
9 2 (1.12%) RSA Security Analytics
10 1 (0.56%) Argo
10 1 (0.56%) Progress Chef
Vendors
1 44 (24.58%) Google
2 31 (17.32%) Microsoft
3 13 (7.26%) OpenAI
3 13 (7.26%) VMware
4 10 (5.59%) Citrix
4 10 (5.59%) Databricks
5 8 (4.47%) Solace
6 7 (3.91%) HP
7 6 (3.35%) Splunk
7 6 (3.35%) Symantec
8 5 (2.79%) Cisco
8 5 (2.79%) Palo Alto
9 3 (1.68%) SolarWinds
10 2 (1.12%) Cloudera
10 2 (1.12%) Dataiku
10 2 (1.12%) FireEye
10 2 (1.12%) MapR
10 2 (1.12%) NetWitness
11 1 (0.56%) Bloomberg
11 1 (0.56%) CheckPoint