Business Intelligence Jobs in the South East

Business Intelligence (BI)
England > South East

The table below provides summary statistics for permanent job vacancies advertised in the South East requiring Business Intelligence skills. It includes a benchmarking guide to the annual salaries offered in vacancies that cited Business Intelligence over the 6 months leading up to 31 May 2025, comparing them to the same period in the previous two years.

6 months to
31 May 2025
Same period 2024 Same period 2023
Rank 69 61 67
Rank change year-on-year -8 +6 -16
Permanent jobs citing Business Intelligence 379 660 598
As % of all permanent jobs advertised in the South East 3.91% 3.75% 4.30%
As % of the Processes & Methodologies category 4.25% 4.49% 4.55%
Number of salaries quoted 217 501 396
10th Percentile £35,000 £32,500 £35,000
25th Percentile £41,250 £41,500 £41,250
Median annual salary (50th Percentile) £52,500 £53,100 £52,500
Median % change year-on-year -1.13% +1.14% -4.55%
75th Percentile £65,000 £67,500 £65,000
90th Percentile £73,500 £81,250 £77,500
England median annual salary £60,000 £55,000 £57,500
% change year-on-year +9.09% -4.35% +4.55%

All Process and Methodology Skills
South East

Business Intelligence falls under the Processes and Methodologies category. For comparison with the information above, the following table provides summary statistics for all permanent job vacancies requiring process or methodology skills in the South East.

Permanent vacancies with a requirement for process or methodology skills 8,915 14,700 13,131
As % of all permanent jobs advertised in the South East 92.05% 83.43% 94.43%
Number of salaries quoted 4,320 10,114 7,701
10th Percentile £29,000 £27,750 £30,625
25th Percentile £39,500 £36,906 £41,250
Median annual salary (50th Percentile) £55,000 £50,000 £55,000
Median % change year-on-year +10.00% -9.09% -
75th Percentile £70,000 £65,000 £72,500
90th Percentile £78,750 £77,750 £85,000
England median annual salary £57,500 £55,000 £62,500
% change year-on-year +4.55% -12.00% +4.17%

Business Intelligence
Job Vacancy Trend in the South East

Job postings citing Business Intelligence as a proportion of all IT jobs advertised in the South East.
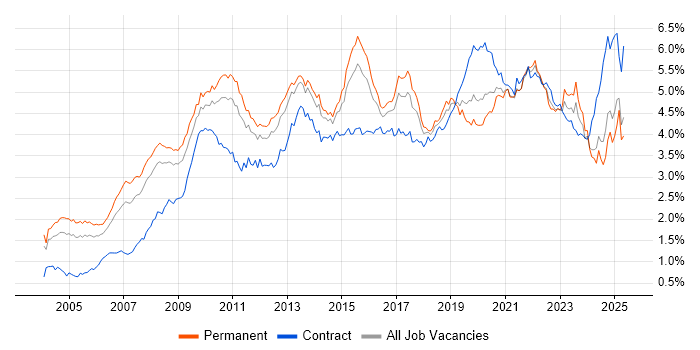
Job vacancy trend for Business Intelligence in the South East

Business Intelligence
Salary Trend in the South East

3-month moving average salary quoted in jobs citing Business Intelligence in the South East.

Salary trend for Business Intelligence in the South East

Business Intelligence
Salary Histogram in the South East

Salary distribution for jobs citing Business Intelligence in the South East over the 6 months to 31 May 2025.

Salary histogram for Business Intelligence in the South East

Business Intelligence
Job Locations in the South East

The table below looks at the demand and provides a guide to the median salaries quoted in IT jobs citing Business Intelligence within the South East region over the 6 months to 31 May 2025. The 'Rank Change' column provides an indication of the change in demand within each location based on the same 6 month period last year.

Location Rank Change
on Same Period
Last Year
Matching
Permanent
IT Job Ads
Median Salary
Past 6 Months
Median Salary
% Change
on Same Period
Last Year
Live
Jobs
Thames Valley +13 202 £50,000 - 104
Berkshire +34 144 £45,000 -18.18% 51
Surrey +21 77 £45,000 -10.00% 35
Hampshire +1 41 £50,000 -8.88% 64
Buckinghamshire -19 39 £60,000 +26.32% 30
Kent +3 22 £55,000 -4.35% 18
East Sussex -6 21 £57,500 -13.21% 15
Oxfordshire +15 19 £45,000 -10.00% 34
Isle of Wight - 6 £60,000 -
West Sussex +20 4 £50,000 -13.04% 22
Middlesex -21 3 - - 3
Sussex +14 2 £42,500 -19.05% 22
Business Intelligence
England

Business Intelligence
Co-occurring Skills and Capabilities in the South East by Category

The follow tables expand on the table above by listing co-occurrences grouped by category. The same employment type, locality and period is covered with up to 20 co-occurrences shown in each of the following categories:

Application Platforms
1 57 (15.04%) SharePoint
2 23 (6.07%) Apache Spark
3 14 (3.69%) IBM Domino
4 11 (2.90%) Apache
5 6 (1.58%) Microsoft Exchange
6 5 (1.32%) Skype for Business
7 3 (0.79%) Exchange Server 2007
7 3 (0.79%) Exchange Server 2010
7 3 (0.79%) Exchange Server 2013
7 3 (0.79%) Office Communications Server
7 3 (0.79%) SharePoint Server
8 2 (0.53%) Oracle Workflow
9 1 (0.26%) Apache Airflow
9 1 (0.26%) ArcGIS
Applications
1 60 (15.83%) Microsoft Excel
2 13 (3.43%) Microsoft Office
3 1 (0.26%) Microsoft PowerPoint
3 1 (0.26%) Microsoft Project
3 1 (0.26%) MS Visio
3 1 (0.26%) Spreadsheet
Business Applications
1 14 (3.69%) Sage 200
2 11 (2.90%) NetSuite
2 11 (2.90%) Sage CRM
3 9 (2.37%) SAP BPC
4 8 (2.11%) Infor LN
5 5 (1.32%) Dynamics CRM
5 5 (1.32%) Dynamics GP
6 4 (1.06%) ResourceLink
7 3 (0.79%) Oracle EBS R12
7 3 (0.79%) Oracle Financials
8 2 (0.53%) Oracle EBS
8 2 (0.53%) Oracle ERP
8 2 (0.53%) Sage 1000
8 2 (0.53%) SAP S/4HANA
9 1 (0.26%) Maximo
9 1 (0.26%) Payment Gateway
9 1 (0.26%) SAP GRC
9 1 (0.26%) Sprinklr
Cloud Services
1 214 (56.46%) Power Platform
2 129 (34.04%) Azure
3 49 (12.93%) Power Automate
4 46 (12.14%) PowerApps
5 36 (9.50%) Microsoft 365
6 22 (5.80%) AWS
7 18 (4.75%) Azure Data Factory
8 16 (4.22%) Azure DevOps
9 12 (3.17%) Dynamics 365
9 12 (3.17%) GCP
10 9 (2.37%) Azure Synapse Analytics
11 7 (1.85%) Amazon S3
12 6 (1.58%) GitHub
12 6 (1.58%) GitHub Actions
12 6 (1.58%) SaaS
13 5 (1.32%) Google Analytics
14 4 (1.06%) Entra ID
15 3 (0.79%) Google Tag Manager
15 3 (0.79%) IaaS
15 3 (0.79%) PaaS
Communications & Networking
1 8 (2.11%) Firewall
1 8 (2.11%) VPN
2 4 (1.06%) DHCP
2 4 (1.06%) DNS
2 4 (1.06%) Internet
2 4 (1.06%) Intrusion Detection
2 4 (1.06%) Network Security
2 4 (1.06%) TCP/IP
3 2 (0.53%) Ethernet
3 2 (0.53%) RS-485
3 2 (0.53%) VoIP
4 1 (0.26%) 3G
4 1 (0.26%) Bluetooth
4 1 (0.26%) Broadband
4 1 (0.26%) GPRS
4 1 (0.26%) HTTP
4 1 (0.26%) LTE
4 1 (0.26%) Modbus
4 1 (0.26%) RS-232
4 1 (0.26%) Wireless
Database & Business Intelligence
1 214 (56.46%) Power BI
2 64 (16.89%) Data Warehouse
3 59 (15.57%) Data Lake
3 59 (15.57%) Tableau
4 53 (13.98%) Big Data
5 40 (10.55%) SQL Server Integration Services
6 31 (8.18%) SQL Server
7 29 (7.65%) SQL Server Reporting Services
8 14 (3.69%) Azure SQL Database
9 13 (3.43%) Hadoop
9 13 (3.43%) NoSQL
10 6 (1.58%) Microsoft Analysis Services
11 5 (1.32%) Metadata
12 4 (1.06%) BigQuery
12 4 (1.06%) Data Mining
12 4 (1.06%) Parquet
13 3 (0.79%) Crystal Reports
13 3 (0.79%) Oracle BI Publisher
13 3 (0.79%) Relational Database
14 2 (0.53%) MySQL
Development Applications
1 10 (2.64%) Oracle Forms
2 5 (1.32%) Eclipse
2 5 (1.32%) Eclipse RCP
2 5 (1.32%) Visual Studio
3 4 (1.06%) JIRA
4 2 (0.53%) SQL Server Management Studio (SSMS)
5 1 (0.26%) ERwin
5 1 (0.26%) Git
5 1 (0.26%) Jenkins
5 1 (0.26%) Selenium
General
1 134 (35.36%) Social Skills
2 91 (24.01%) Finance
3 90 (23.75%) Law
4 64 (16.89%) Analytical Skills
5 35 (9.23%) Marketing
6 33 (8.71%) Manufacturing
7 18 (4.75%) Telecoms
8 15 (3.96%) Inclusion and Diversity
8 15 (3.96%) Public Sector
9 13 (3.43%) Electronics
9 13 (3.43%) Retail
10 12 (3.17%) Automotive
11 9 (2.37%) Organisational Skills
11 9 (2.37%) Publishing
12 8 (2.11%) Police
13 7 (1.85%) Legal
14 4 (1.06%) Documentation Skills
14 4 (1.06%) Games
15 3 (0.79%) Advertising
16 2 (0.53%) Swedish Language
Job Titles
1 105 (27.70%) Lead
2 86 (22.69%) Analyst
3 47 (12.40%) Senior
4 38 (10.03%) Developer
5 27 (7.12%) Financial Analyst
6 22 (5.80%) Data Analyst
7 19 (5.01%) Business Analyst
8 16 (4.22%) Data Engineer
8 16 (4.22%) Support Engineer
9 15 (3.96%) Finance Business Analyst
10 14 (3.69%) Business Intelligence Analyst
11 12 (3.17%) Data Manager
12 11 (2.90%) Microsoft 365 Engineer
12 11 (2.90%) Sage 200 Support
12 11 (2.90%) Sage Support
12 11 (2.90%) SharePoint Engineer
12 11 (2.90%) SharePoint Support
12 11 (2.90%) Support Analyst
13 9 (2.37%) Data Analytics Director
13 9 (2.37%) Senior Analyst
Libraries, Frameworks & Software Standards
1 20 (5.28%) .NET
2 11 (2.90%) ASP.NET
2 11 (2.90%) Kafka
2 11 (2.90%) XML
3 10 (2.64%) .NET Framework
4 8 (2.11%) JSON
5 7 (1.85%) CSS
5 7 (1.85%) HTML
5 7 (1.85%) Pandas
6 6 (1.58%) Middleware
7 5 (1.32%) .NET Core
7 5 (1.32%) JSP
7 5 (1.32%) React
8 4 (1.06%) EDI
8 4 (1.06%) REST
9 2 (0.53%) Oracle Fusion
10 1 (0.26%) jQuery
10 1 (0.26%) NumPy
10 1 (0.26%) RabbitMQ
10 1 (0.26%) SQLAlchemy
Miscellaneous
1 36 (9.50%) Product Ownership
2 26 (6.86%) Management Information System
3 14 (3.69%) Self-Motivation
4 11 (2.90%) Cloud Native
5 10 (2.64%) Algorithms
6 9 (2.37%) Social Media
7 5 (1.32%) Analytical Mindset
7 5 (1.32%) Mobile App
8 4 (1.06%) Operational Technology
8 4 (1.06%) Security Posture
9 3 (0.79%) Data Structures
9 3 (0.79%) Driving Licence
9 3 (0.79%) Replication
10 2 (0.53%) Embedded Systems
10 2 (0.53%) Enterprise Software
10 2 (0.53%) Hybrid Cloud
10 2 (0.53%) NHS
10 2 (0.53%) Pricing Data
10 2 (0.53%) Public Cloud
10 2 (0.53%) SCADA
Operating Systems
1 16 (4.22%) Windows
2 9 (2.37%) Linux
3 6 (1.58%) Windows Server
4 3 (0.79%) Windows Server 2003
5 2 (0.53%) Ubuntu
6 1 (0.26%) Robot Operating System
Processes & Methodologies
1 158 (41.69%) Analytics
2 94 (24.80%) Decision-Making
3 83 (21.90%) Data Modelling
4 80 (21.11%) Problem-Solving
5 75 (19.79%) Data Management
6 74 (19.53%) Data Governance
7 68 (17.94%) Data Engineering
8 65 (17.15%) Data Analysis
8 65 (17.15%) ERP
9 59 (15.57%) Data Science
10 56 (14.78%) Data Architecture
11 55 (14.51%) Project Management
11 55 (14.51%) Visualisation
12 53 (13.98%) Business Transformation
13 51 (13.46%) Data Analytics
14 50 (13.19%) Stakeholder Management
15 49 (12.93%) Data Integration
16 46 (12.14%) Actionable Insight
16 46 (12.14%) ETL
17 45 (11.87%) Computer Science
Programming Languages
1 153 (40.37%) SQL
2 73 (19.26%) Python
3 26 (6.86%) T-SQL
4 24 (6.33%) C#
5 19 (5.01%) Data Analysis Expressions
5 19 (5.01%) PowerShell
6 10 (2.64%) Java
6 10 (2.64%) VB.NET
7 7 (1.85%) Bash
7 7 (1.85%) PL/SQL
7 7 (1.85%) R
8 6 (1.58%) VBA
9 5 (1.32%) Ada
9 5 (1.32%) Rust
10 4 (1.06%) JavaScript
11 3 (0.79%) C++
11 3 (0.79%) X++
12 2 (0.53%) Ruby
13 1 (0.26%) C
13 1 (0.26%) VBScript
Qualifications
1 100 (26.39%) Degree
2 22 (5.80%) Azure Certification
3 18 (4.75%) ACCA
3 18 (4.75%) CIMA
4 17 (4.49%) Computer Science Degree
4 17 (4.49%) Master's Degree
5 16 (4.22%) BPSS Clearance
6 10 (2.64%) AWS Certification
7 8 (2.11%) SC Cleared
7 8 (2.11%) Security Cleared
8 7 (1.85%) DBS Check
8 7 (1.85%) Microsoft Certification
9 5 (1.32%) DV Cleared
10 2 (0.53%) ISTQB
11 1 (0.26%) CFA
11 1 (0.26%) CISSP
11 1 (0.26%) HND
11 1 (0.26%) ISEB
11 1 (0.26%) ITIL Certification
11 1 (0.26%) PMP
Quality Assurance & Compliance
1 56 (14.78%) Data Quality
2 15 (3.96%) GDPR
3 10 (2.64%) Accessibility
4 9 (2.37%) California Consumer Privacy Act
5 8 (2.11%) GAAP
5 8 (2.11%) IFRS
6 6 (1.58%) SLA
7 5 (1.32%) QA
8 4 (1.06%) Cyber Essentials
9 3 (0.79%) ISO/IEC 27001
10 1 (0.26%) ISO 22301
10 1 (0.26%) ISO 9001
10 1 (0.26%) PMO
System Software
1 8 (2.11%) Active Directory
2 5 (1.32%) VMware Infrastructure
3 4 (1.06%) Hyper-V
4 3 (0.79%) ISA Server
4 3 (0.79%) Virtual Machines
5 2 (0.53%) Docker
5 2 (0.53%) HDFS
6 1 (0.26%) Embedded Firmware
6 1 (0.26%) Firmware
6 1 (0.26%) IAG
Systems Management
1 5 (1.32%) FortiGate
2 4 (1.06%) Kubernetes
3 2 (0.53%) Hadoop YARN
3 2 (0.53%) Microsoft Intune
4 1 (0.26%) Single Sign-On
4 1 (0.26%) Terraform
Vendors
1 148 (39.05%) Microsoft
2 61 (16.09%) SAP
3 28 (7.39%) ServiceNow
4 19 (5.01%) Salesforce
5 18 (4.75%) Databricks
6 17 (4.49%) Oracle
7 16 (4.22%) Google
7 16 (4.22%) Sage
8 15 (3.96%) Cognos
9 10 (2.64%) Anaplan
10 8 (2.11%) Infor
11 5 (1.32%) VMware
12 4 (1.06%) Fortinet
13 3 (0.79%) HubSpot
13 3 (0.79%) IBM
14 2 (0.53%) Cisco
14 2 (0.53%) Cloudera
14 2 (0.53%) Concur
14 2 (0.53%) Freescale
14 2 (0.53%) MapR