Benchmarking Jobs in the UK excluding London

Benchmarking
UK > UK excluding London

The following table provides summary statistics for permanent job vacancies advertised in the UK excluding London with a requirement for Benchmarking skills. Included is a benchmarking guide to the salaries offered in vacancies that have cited Benchmarking over the 6 months to 25 April 2024 with a comparison to the same period in the previous 2 years.

6 months to
25 Apr 2024
Same period 2023 Same period 2022
Rank 491 497 565
Rank change year-on-year +6 +68 +11
Permanent jobs citing Benchmarking 289 282 296
As % of all permanent jobs advertised in the UK excluding London 0.41% 0.45% 0.42%
As % of the Processes & Methodologies category 0.49% 0.48% 0.45%
Number of salaries quoted 65 120 114
10th Percentile £26,600 - £32,996
25th Percentile £35,413 £35,500 £40,000
Median annual salary (50th Percentile) £50,000 £38,750 £52,500
Median % change year-on-year +29.03% -26.19% +2.94%
75th Percentile £60,000 £47,500 £67,500
90th Percentile £71,000 £57,750 £72,500
UK median annual salary £55,000 £48,250 £55,742
% change year-on-year +13.99% -13.44% -3.06%

All Process and Methodology Skills
UK excluding London

Benchmarking is in the Processes and Methodologies category. The following table is for comparison with the above and provides summary statistics for all permanent job vacancies advertised in the UK excluding London with a requirement for process or methodology skills.

Permanent vacancies with a requirement for process or methodology skills 59,217 59,337 66,337
As % of all permanent jobs advertised in the UK excluding London 84.49% 95.62% 94.08%
Number of salaries quoted 41,096 30,395 41,344
10th Percentile £27,234 £30,500 £30,000
25th Percentile £36,250 £40,000 £38,750
Median annual salary (50th Percentile) £50,000 £55,000 £52,500
Median % change year-on-year -9.09% +4.76% +9.38%
75th Percentile £65,000 £70,000 £67,500
90th Percentile £77,500 £82,500 £80,000
UK median annual salary £55,000 £61,700 £60,000
% change year-on-year -10.86% +2.83% +9.09%

Benchmarking
Job Vacancy Trend in the UK excluding London

Job postings citing Benchmarking as a proportion of all IT jobs advertised in the UK excluding London.
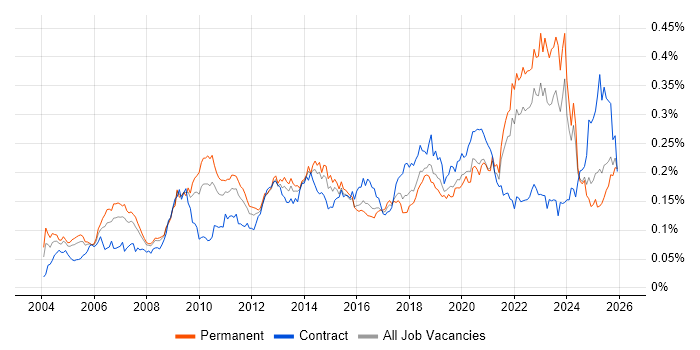
Job vacancy trend for Benchmarking in the UK excluding London

Benchmarking
Salary Trend in the UK excluding London

3-month moving average salary quoted in jobs citing Benchmarking in the UK excluding London.

Salary trend for Benchmarking in the UK excluding London

Benchmarking
Salary Histogram in the UK excluding London

Salary distribution for jobs citing Benchmarking in the UK excluding London over the 6 months to 25 April 2024.

Salary histogram for Benchmarking in the UK excluding London

Benchmarking
Job Locations in the UK excluding London

The table below looks at the demand and provides a guide to the median salaries quoted in IT jobs citing Benchmarking within the UK excluding London region over the 6 months to 25 April 2024. The 'Rank Change' column provides an indication of the change in demand within each location based on the same 6 month period last year.

Location Rank Change
on Same Period
Last Year
Matching
Permanent
IT Job Ads
Median Salary
Past 6 Months
Median Salary
% Change
on Same Period
Last Year
Live
Jobs
Wales - 73 £40,000 - 1
Scotland -13 54 £60,000 +100.00% 6
Midlands -81 44 £54,650 +43.82% 18
North of England +48 39 £55,000 +22.22% 18
East of England +39 37 £51,250 +2.50% 13
South East +2 31 £29,000 -25.64% 32
West Midlands -90 28 £55,900 +47.11% 13
North West +17 20 £55,000 +48.06% 9
East Midlands 0 16 £50,000 -28.57% 5
Yorkshire +88 15 £35,413 -21.30% 7
South West -37 8 £83,577 +63.88% 11
North East +1 4 - - 3
Northern Ireland - 3 - - 1
Benchmarking
UK

Benchmarking
Co-occurring Skills and Capabilities in the UK excluding London by Category

The follow tables expand on the table above by listing co-occurrences grouped by category. The same employment type, locality and period is covered with up to 20 co-occurrences shown in each of the following categories:

Application Platforms
1 36 (12.46%) SAS
2 7 (2.42%) Apache
3 3 (1.04%) CMS
3 3 (1.04%) Microsoft Exchange
4 2 (0.69%) OpenStack
Applications
1 35 (12.11%) UserZoom
2 15 (5.19%) Microsoft Excel
3 7 (2.42%) Microsoft PowerPoint
4 4 (1.38%) Microsoft Office
5 3 (1.04%) Abaqus
6 2 (0.69%) Microsoft Project
Cloud Services
1 32 (11.07%) Figma
1 32 (11.07%) SurveyMonkey
2 5 (1.73%) AWS
2 5 (1.73%) AWS IoT
2 5 (1.73%) Cloud Computing
3 4 (1.38%) OCI
3 4 (1.38%) Power Platform
4 3 (1.04%) GCP
4 3 (1.04%) Microsoft 365
5 2 (0.69%) dbt
5 2 (0.69%) GitHub
5 2 (0.69%) Salesforce Service Cloud
Communications & Networking
1 22 (7.61%) SAN
2 9 (3.11%) Internet
3 5 (1.73%) Wireless
4 2 (0.69%) Ethernet
4 2 (0.69%) InfiniBand
4 2 (0.69%) Intranet
5 1 (0.35%) Fibre Channel
Database & Business Intelligence
1 5 (1.73%) Relational Database
2 4 (1.38%) MariaDB
2 4 (1.38%) Metadata
2 4 (1.38%) Oracle Database
2 4 (1.38%) Power BI
2 4 (1.38%) SQL Server
3 2 (0.69%) Hadoop
3 2 (0.69%) Looker
3 2 (0.69%) Tableau
4 1 (0.35%) Apache Cassandra
4 1 (0.35%) Electronic Patient Records
4 1 (0.35%) MySQL
4 1 (0.35%) PostgreSQL
Development Applications
1 36 (12.46%) Jenkins
2 13 (4.50%) Git
3 5 (1.73%) JIRA
3 5 (1.73%) Xcode
4 3 (1.04%) GitLab
5 1 (0.35%) Artifactory
5 1 (0.35%) TeamCity
General
1 202 (69.90%) Social Skills
2 105 (36.33%) Law
3 93 (32.18%) Finance
4 76 (26.30%) Influencing Skills
5 75 (25.95%) Manufacturing
5 75 (25.95%) Presentation Skills
6 59 (20.42%) Legal
7 56 (19.38%) Analytical Skills
8 48 (16.61%) Inclusion and Diversity
9 46 (15.92%) Banking
10 41 (14.19%) Marketing
11 37 (12.80%) Publishing
12 21 (7.27%) Telecoms
13 14 (4.84%) Retail
14 12 (4.15%) Local Government
15 11 (3.81%) Public Sector
16 9 (3.11%) Automotive
17 7 (2.42%) Mandarin Language
18 2 (0.69%) Financial Institution
18 2 (0.69%) Investment Banking
Job Titles
1 68 (23.53%) Automation Engineer
1 68 (23.53%) Graduate
1 68 (23.53%) Graduate IT Engineer
1 68 (23.53%) IT Engineer
1 68 (23.53%) IT Graduate
2 46 (15.92%) Senior
3 37 (12.80%) User Experience Researcher
4 36 (12.46%) Senior Data Warehouse Specialist
5 22 (7.61%) Administrator
6 21 (7.27%) IT Administrator
6 21 (7.27%) Server Administrator
7 15 (5.19%) Analyst
8 14 (4.84%) Lead
9 11 (3.81%) IT Manager
10 9 (3.11%) Planning Manager
11 8 (2.77%) Procurement Manager
12 7 (2.42%) Applications Support
12 7 (2.42%) Developer
12 7 (2.42%) IT Procurement Manager
12 7 (2.42%) Support Analyst
Libraries, Frameworks & Software Standards
1 13 (4.50%) RESTful
2 5 (1.73%) Android Jetpack
2 5 (1.73%) Android SDK
2 5 (1.73%) Apache Cordova
2 5 (1.73%) Core Animation
2 5 (1.73%) Core Data
2 5 (1.73%) Jetpack Compose
2 5 (1.73%) Web Services
3 3 (1.04%) CSS
3 3 (1.04%) HTML
3 3 (1.04%) HTML5
3 3 (1.04%) OpenCV
3 3 (1.04%) OpenVINO
4 2 (0.69%) CSS3
4 2 (0.69%) Dagger
4 2 (0.69%) OpenMP
4 2 (0.69%) Retrofit
4 2 (0.69%) RxJava
5 1 (0.35%) Flask
5 1 (0.35%) React
Miscellaneous
1 68 (23.53%) FMCG
2 36 (12.46%) Credit Risk
3 23 (7.96%) Self-Motivation
4 21 (7.27%) Data Centre
5 14 (4.84%) Algorithms
6 11 (3.81%) PACS
7 10 (3.46%) Renewable Energy
8 8 (2.77%) Management Information System
9 6 (2.08%) IoT
10 5 (1.73%) Animation
10 5 (1.73%) Data Structures
10 5 (1.73%) Distributed Computing
11 3 (1.04%) Analytical Mindset
11 3 (1.04%) Mobile App
11 3 (1.04%) Online Banking
11 3 (1.04%) Product Ownership
11 3 (1.04%) Social Media
12 2 (0.69%) Beowulf
12 2 (0.69%) Driving Licence
12 2 (0.69%) Video\Live Streaming
Operating Systems
1 37 (12.80%) Linux
2 28 (9.69%) Windows
3 21 (7.27%) Windows Server
4 10 (3.46%) Unix
5 5 (1.73%) Android
5 5 (1.73%) Apple iOS
6 2 (0.69%) SUSE
6 2 (0.69%) SUSE Linux Enterprise Server
7 1 (0.35%) Solaris
Processes & Methodologies
1 106 (36.68%) Problem-Solving
2 93 (32.18%) Continuous Improvement
3 74 (25.61%) Analytics
4 69 (23.88%) Six Sigma
5 68 (23.53%) Lean Manufacturing
5 68 (23.53%) Lean Six Sigma
5 68 (23.53%) Order Management
6 62 (21.45%) Agile
7 47 (16.26%) User Experience
8 41 (14.19%) Data Analysis
8 41 (14.19%) Mentoring
8 41 (14.19%) Roadmaps
9 37 (12.80%) Actionable Insight
9 37 (12.80%) Design Thinking
9 37 (12.80%) Product Management
9 37 (12.80%) Risk Management
9 37 (12.80%) User Research
9 37 (12.80%) UX Research
10 36 (12.46%) Budget Responsibility
10 36 (12.46%) Market Research
Programming Languages
1 21 (7.27%) PowerShell
2 19 (6.57%) SQL
3 15 (5.19%) Python
4 12 (4.15%) C++
4 12 (4.15%) JavaScript
5 10 (3.46%) Kotlin
6 7 (2.42%) Java
7 5 (1.73%) C
7 5 (1.73%) Fortran
7 5 (1.73%) Go
7 5 (1.73%) Rust
7 5 (1.73%) Swift
8 4 (1.38%) Bash
9 3 (1.04%) Perl
9 3 (1.04%) R
9 3 (1.04%) Shell Script
10 1 (0.35%) AWK
10 1 (0.35%) Data Analysis Expressions
10 1 (0.35%) Korn
10 1 (0.35%) T-SQL
Qualifications
1 145 (50.17%) Degree
2 68 (23.53%) Six Sigma Yellow Belt
3 34 (11.76%) Security Cleared
4 24 (8.30%) SC Cleared
5 20 (6.92%) Master's Degree
6 16 (5.54%) PhD
7 4 (1.38%) ITIL Foundation Certificate
8 3 (1.04%) Computer Science Degree
9 2 (0.69%) DBS Check
9 2 (0.69%) DV Cleared
10 1 (0.35%) CCDP
10 1 (0.35%) CCNP
10 1 (0.35%) CCSP
10 1 (0.35%) Cisco Certification
10 1 (0.35%) Numerate Degree
10 1 (0.35%) RHCE
10 1 (0.35%) RHCSA
Quality Assurance & Compliance
1 36 (12.46%) IFRS
1 36 (12.46%) IFRS 9
2 32 (11.07%) Actionable Recommendations
3 8 (2.77%) GDPR
4 7 (2.42%) ISO 14000
4 7 (2.42%) QA
5 4 (1.38%) SLA
6 2 (0.69%) Accessibility
6 2 (0.69%) Data Quality
6 2 (0.69%) PMO
7 1 (0.35%) Solvency II
System Software
1 21 (7.27%) Active Directory
2 2 (0.69%) Docker
2 2 (0.69%) Lustre
2 2 (0.69%) Slurm Workload Manager
3 1 (0.35%) Firmware
Systems Management
1 1 (0.35%) Ansible
1 1 (0.35%) NetBackup
1 1 (0.35%) Oracle ZFS
1 1 (0.35%) Red Hat Satellite
1 1 (0.35%) yum
Vendors
1 40 (13.84%) Microsoft
2 35 (12.11%) Qualtrics
3 23 (7.96%) NetApp
4 21 (7.27%) Citrix
4 21 (7.27%) VMware
5 8 (2.77%) Apple
6 5 (1.73%) Google
7 4 (1.38%) Oracle
8 3 (1.04%) Computacenter
8 3 (1.04%) EMC
8 3 (1.04%) Red Hat
8 3 (1.04%) Salesforce
9 2 (0.69%) BT
9 2 (0.69%) IBM
9 2 (0.69%) Intel
9 2 (0.69%) Mellanox
10 1 (0.35%) Qubit
10 1 (0.35%) SAP
10 1 (0.35%) Veritas