Computer Science Degree Job Trends in the UK excluding London

Computer Science Degree
UK > UK excluding London

The table below provides summary statistics for permanent job vacancies advertised in the UK excluding London with a requirement for Computer Science Degree qualifications. It includes a benchmarking guide to the salaries offered over the 6 months leading up to 19 November 2025, comparing them to the same period in the previous two years.

6 months to
19 Nov 2025
Same period 2024 Same period 2023
Rank 182 93 112
Rank change year-on-year -89 +19 +40
Permanent jobs citing Computer Science Degree 468 1,200 831
As % of all permanent jobs in the UK excluding London 1.28% 2.54% 2.76%
As % of the Qualifications category 3.87% 8.42% 8.06%
Number of salaries quoted 314 532 652
10th Percentile £25,000 £32,500 £36,250
25th Percentile £32,500 £40,000 £47,793
Median annual salary (50th Percentile) £50,000 £53,000 £60,000
Median % change year-on-year -5.66% -11.67% +20.00%
75th Percentile £68,750 £75,000 £71,250
90th Percentile £85,700 £85,000 £82,500
UK median annual salary £62,500 £62,500 £65,000
% change year-on-year - -3.85% +13.04%

All Academic and Professional Certifications
UK excluding London

Computer Science Degree falls under the Academic Qualifications and Professional Certifications category. For comparison with the information above, the following table provides summary statistics for all permanent job vacancies requiring academic qualifications or professional certifications in the UK excluding London.

Permanent vacancies requiring academic qualifications or professional certifications 12,081 14,245 10,305
As % of all permanent jobs advertised in the UK excluding London 32.98% 30.16% 34.18%
Number of salaries quoted 5,200 5,480 6,815
10th Percentile £27,781 £31,250 £28,500
25th Percentile £31,750 £41,500 £38,500
Median annual salary (50th Percentile) £47,520 £55,000 £52,500
Median % change year-on-year -13.60% +4.76% +5.00%
75th Percentile £66,000 £70,000 £66,250
90th Percentile £80,000 £82,500 £78,750
UK median annual salary £55,000 £58,500 £57,500
% change year-on-year -5.98% +1.74% +1.77%

Computer Science Degree
Job Vacancy Trend in the UK excluding London

Historical trend showing the proportion of permanent IT job postings citing Computer Science Degree relative to all permanent IT jobs advertised in the UK excluding London.
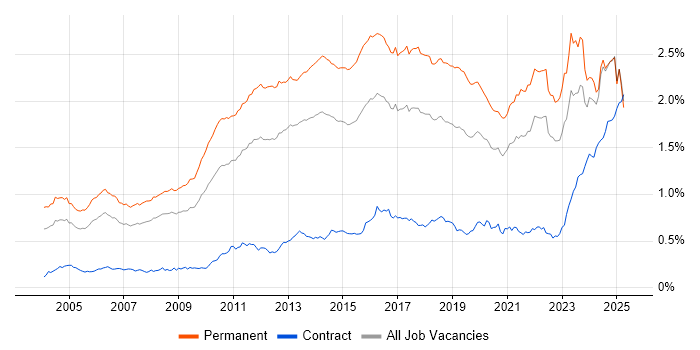
Computer Science Degree job vacancy trend in the UK excluding London

Computer Science Degree
Salary Trend in the UK excluding London

Salary distribution trend for jobs in the UK excluding London citing Computer Science Degree.

Salary distribution trend for jobs in the UK excluding London citing Computer Science Degree

Computer Science Degree
Salary Histogram in the UK excluding London

Salary distribution for jobs citing Computer Science Degree in the UK excluding London over the 6 months to 19 November 2025.

Salary histogram for Computer Science Degree in the UK excluding London

Computer Science Degree
Job Locations in the UK excluding London

The table below looks at the demand and provides a guide to the median salaries quoted in IT jobs citing Computer Science Degree within the UK excluding London region over the 6 months to 19 November 2025. The 'Rank Change' column provides an indication of the change in demand within each location based on the same 6 month period last year.

Location Rank Change
on Same Period
Last Year
Matching
Permanent
IT Job Ads
Median Salary
Past 6 Months
Median Salary
% Change
on Same Period
Last Year
Live
Jobs
South East -49 152 £50,000 -23.08% 138
North of England -29 110 £55,000 +10.00% 64
Midlands -86 72 £41,434 +18.38% 64
West Midlands -59 56 £41,434 +18.38% 36
East of England -46 46 £45,000 -20.70% 54
North West -48 46 £56,250 +12.50% 31
South West -6 45 £47,500 -24.00% 40
Yorkshire -3 44 £55,000 +19.18% 23
Scotland -25 22 £60,000 +9.09% 41
North East +3 20 £51,500 +14.44% 11
East Midlands -50 19 £39,000 +11.43% 27
Wales -6 13 £56,250 +25.92% 12
Northern Ireland -21 8 £36,000 -31.43% 15
Isle of Man +10 1 - -
Computer Science Degree
UK

Computer Science Degree
Co-Occurring Skills & Capabilities in the UK excluding London by Category

The following tables expand on the one above by listing co-occurrences grouped by category. They cover the same employment type, locality and period, with up to 20 co-occurrences shown in each category:

Application Platforms
1 25 (5.34%) IIS
2 8 (1.71%) Confluence
3 6 (1.28%) Apache Spark
4 3 (0.64%) CMS
4 3 (0.64%) Microsoft Exchange
4 3 (0.64%) SAS
4 3 (0.64%) Umbraco
5 2 (0.43%) Apache Airflow
5 2 (0.43%) ArcGIS
5 2 (0.43%) SharePoint
6 1 (0.21%) WordPress
Applications
1 18 (3.85%) Microsoft Office
2 12 (2.56%) Microsoft Excel
3 9 (1.92%) MS Visio
4 8 (1.71%) AutoCAD
4 8 (1.71%) SOLIDWORKS
5 3 (0.64%) Microsoft Project
6 2 (0.43%) EPLAN
6 2 (0.43%) Microsoft PowerPoint
7 1 (0.21%) Windchill
Business Applications
1 6 (1.28%) Dynamics CRM
1 6 (1.28%) Dynamics NAV
1 6 (1.28%) NetSuite
2 5 (1.07%) Remedy ITSM
3 1 (0.21%) Pegasus Opera
3 1 (0.21%) SAP S/4HANA
3 1 (0.21%) Teamcenter
Cloud Services
1 178 (38.03%) Azure
2 107 (22.86%) AWS
3 39 (8.33%) GCP
4 32 (6.84%) Azure DevOps
5 31 (6.62%) Power Platform
6 29 (6.20%) SaaS
7 25 (5.34%) GitHub
8 24 (5.13%) Serverless
9 13 (2.78%) Azure Monitor
10 12 (2.56%) Microsoft 365
11 11 (2.35%) Dynamics 365
11 11 (2.35%) Google Workspace
12 10 (2.14%) PaaS
13 9 (1.92%) Amazon S3
13 9 (1.92%) AWS Lambda
13 9 (1.92%) Cloud Computing
14 7 (1.50%) Amazon EC2
15 6 (1.28%) Entra ID
16 4 (0.85%) Amazon EMR
16 4 (0.85%) Firebase
Communications & Networking
1 23 (4.91%) Firewall
2 17 (3.63%) VLAN
3 12 (2.56%) SAN
3 12 (2.56%) TCP/IP
4 10 (2.14%) Network Security
5 9 (1.92%) DNS
5 9 (1.92%) VPN
6 8 (1.71%) DHCP
7 7 (1.50%) Modbus
7 7 (1.50%) Wi-Fi
7 7 (1.50%) Wireshark
8 5 (1.07%) Bluetooth
8 5 (1.07%) Intrusion Detection
8 5 (1.07%) VoIP
9 4 (0.85%) HTTP
9 4 (0.85%) Internet
9 4 (0.85%) WAN
9 4 (0.85%) ZigBee
10 3 (0.64%) Cisco IOS
10 3 (0.64%) NAS
Database & Business Intelligence
1 81 (17.31%) SQL Server
2 41 (8.76%) MySQL
3 26 (5.56%) Power BI
4 18 (3.85%) Data Warehouse
5 14 (2.99%) NoSQL
5 14 (2.99%) Relational Database
5 14 (2.99%) SQL Server Reporting Services
6 11 (2.35%) Data Lake
6 11 (2.35%) PostgreSQL
7 9 (1.92%) Big Data
7 9 (1.92%) Metadata
8 6 (1.28%) Hadoop
8 6 (1.28%) MongoDB
8 6 (1.28%) Oracle Database
9 5 (1.07%) Amazon RDS
9 5 (1.07%) Data Mining
9 5 (1.07%) Tableau
10 4 (0.85%) Amazon Athena
10 4 (0.85%) Electronic Patient Records
10 4 (0.85%) Oracle BI Publisher
Development Applications
1 48 (10.26%) JIRA
2 35 (7.48%) Git
3 14 (2.99%) Bitbucket
4 9 (1.92%) Jenkins
5 8 (1.71%) Cypress.io
6 7 (1.50%) Octopus Deploy
7 6 (1.28%) GitLab
8 5 (1.07%) Visual Studio
9 4 (0.85%) Artifactory
9 4 (0.85%) Burp Suite
9 4 (0.85%) Maven
9 4 (0.85%) Metasploit
9 4 (0.85%) Selenium
9 4 (0.85%) SonarQube
9 4 (0.85%) TeamCity
10 3 (0.64%) ERwin
10 3 (0.64%) PowerDesigner
10 3 (0.64%) Visual Studio Code
10 3 (0.64%) Vite
10 3 (0.64%) WebDriver
General
1 250 (53.42%) Social Skills
2 120 (25.64%) Finance
3 73 (15.60%) Analytical Skills
4 35 (7.48%) Law
5 31 (6.62%) Manufacturing
6 16 (3.42%) Documentation Skills
6 16 (3.42%) Inclusion and Diversity
6 16 (3.42%) Legal
7 14 (2.99%) Banking
7 14 (2.99%) Retail
8 13 (2.78%) Marketing
8 13 (2.78%) Organisational Skills
9 12 (2.56%) Advertising
9 12 (2.56%) Public Sector
10 11 (2.35%) Aerospace
11 10 (2.14%) Electronics
12 9 (1.92%) Back Office
12 9 (1.92%) Pharmaceutical
13 8 (1.71%) Presentation Skills
13 8 (1.71%) Telecoms
Job Titles
1 122 (26.07%) Developer
2 62 (13.25%) Architect
3 52 (11.11%) Graduate
4 47 (10.04%) Senior
5 42 (8.97%) Software Engineer
6 40 (8.55%) Support Engineer
7 37 (7.91%) Graduate Developer
8 34 (7.26%) Analyst
9 33 (7.05%) Software Architect
10 30 (6.41%) IT Graduate
11 26 (5.56%) Software Developer
12 23 (4.91%) IT Support
13 22 (4.70%) Technical Support
14 21 (4.49%) C# Developer
14 21 (4.49%) IT Engineer
15 19 (4.06%) Lead
16 18 (3.85%) IT Support Engineer
17 17 (3.63%) Full-Stack Developer
17 17 (3.63%) Junior
17 17 (3.63%) SQL Developer
Libraries, Frameworks & Software Standards
1 75 (16.03%) .NET
2 67 (14.32%) CSS
3 42 (8.97%) ASP.NET
4 37 (7.91%) jQuery
5 34 (7.26%) React
6 33 (7.05%) HTML
7 27 (5.77%) Middleware
8 24 (5.13%) .NET Framework
8 24 (5.13%) REST
9 22 (4.70%) WinForms
10 19 (4.06%) PyTorch
10 19 (4.06%) TensorFlow
11 14 (2.99%) Hugging Face
11 14 (2.99%) LangChain
11 14 (2.99%) RESTful
12 13 (2.78%) AngularJS
12 13 (2.78%) Vue
12 13 (2.78%) WPF
13 12 (2.56%) Entity Framework
13 12 (2.56%) Node.js
Miscellaneous
1 42 (8.97%) Management Information System
2 26 (5.56%) Self-Motivation
3 25 (5.34%) Enterprise Software
4 19 (4.06%) Onboarding
5 18 (3.85%) Product Ownership
6 12 (2.56%) Operational Technology
7 11 (2.35%) Driving Licence
7 11 (2.35%) Security Posture
7 11 (2.35%) Virtual Team
8 9 (1.92%) Data Structures
8 9 (1.92%) SCADA
9 7 (1.50%) Algorithms
9 7 (1.50%) Data Centre
9 7 (1.50%) IoT
9 7 (1.50%) Mobile App
9 7 (1.50%) Renewable Energy
9 7 (1.50%) Team-Oriented Environment
10 6 (1.28%) Cyber Threat
10 6 (1.28%) NHS
11 5 (1.07%) Analytical Mindset
Operating Systems
1 66 (14.10%) Windows
2 60 (12.82%) Linux
3 8 (1.71%) Mac OS
4 6 (1.28%) Android
4 6 (1.28%) Windows Server
5 5 (1.07%) Mac OS X
6 4 (0.85%) Kali Linux
6 4 (0.85%) Ubuntu
7 3 (0.64%) Red Hat Enterprise Linux
8 2 (0.43%) Unix
Processes & Methodologies
1 452 (96.58%) Computer Science
2 163 (34.83%) Problem-Solving
3 162 (34.62%) Agile
4 123 (26.28%) Continuous Improvement
5 116 (24.79%) DevOps
6 87 (18.59%) Mentoring
7 82 (17.52%) Software Engineering
8 77 (16.45%) CI/CD
9 63 (13.46%) AI
10 60 (12.82%) SDLC
11 57 (12.18%) ITIL
12 53 (11.32%) OOP
13 47 (10.04%) Business Intelligence
13 47 (10.04%) Cybersecurity
14 46 (9.83%) Machine Learning
15 44 (9.40%) Analytics
15 44 (9.40%) Test Automation
16 43 (9.19%) OO
17 42 (8.97%) Project Management
18 41 (8.76%) MVC
Programming Languages
1 120 (25.64%) C#
2 118 (25.21%) SQL
3 106 (22.65%) Java
4 86 (18.38%) Python
5 75 (16.03%) JavaScript
6 57 (12.18%) C++
7 46 (9.83%) PHP
8 25 (5.34%) TypeScript
9 22 (4.70%) PowerShell
10 21 (4.49%) C
11 17 (3.63%) T-SQL
12 10 (2.14%) Bash
13 9 (1.92%) PL/SQL
13 9 (1.92%) R
14 7 (1.50%) Delphi
15 5 (1.07%) Rust
16 4 (0.85%) Go
16 4 (0.85%) Julia
17 3 (0.64%) Perl
17 3 (0.64%) VBA
Qualifications
1 465 (99.36%) Degree
2 58 (12.39%) Master's Degree
3 42 (8.97%) Microsoft Certification
3 42 (8.97%) Security Cleared
4 39 (8.33%) BPSS Clearance
5 28 (5.98%) Azure Certification
6 26 (5.56%) SC Cleared
7 25 (5.34%) Chartered Engineer
8 22 (4.70%) AWS Certification
8 22 (4.70%) TOGAF Certification
9 18 (3.85%) AWS Certified Solutions Architect
10 11 (2.35%) Cisco Certification
11 9 (1.92%) A+ Certification
11 9 (1.92%) CISSP
11 9 (1.92%) DV Cleared
11 9 (1.92%) MCP
11 9 (1.92%) MCSE
11 9 (1.92%) PMI Certification
11 9 (1.92%) PMP
12 7 (1.50%) CCNP
Quality Assurance & Compliance
1 26 (5.56%) ISO/IEC 27001
2 25 (5.34%) ISO/IEC 12207
3 17 (3.63%) NIST
4 16 (3.42%) QA
5 14 (2.99%) Accessibility
6 13 (2.78%) Data Quality
6 13 (2.78%) GDPR
7 11 (2.35%) NCSC
8 10 (2.14%) IEC 61131
9 6 (1.28%) ISO 9001
10 3 (0.64%) California Consumer Privacy Act
10 3 (0.64%) HIPAA
11 2 (0.43%) Cyber Essentials
11 2 (0.43%) Cyber Essentials PLUS
11 2 (0.43%) Def Stans
11 2 (0.43%) ECSS
11 2 (0.43%) NIST 800
11 2 (0.43%) SLA
11 2 (0.43%) SOC 2
12 1 (0.21%) GxP
System Software
1 28 (5.98%) Docker
2 17 (3.63%) VMware Infrastructure
3 12 (2.56%) Active Directory
4 10 (2.14%) Firmware
5 8 (1.71%) vSphere
6 5 (1.07%) Hyper-V
7 4 (0.85%) Embedded Firmware
8 3 (0.64%) GPFS
8 3 (0.64%) Lustre
8 3 (0.64%) NFS
9 2 (0.43%) Virtual Machines
Systems Management
1 28 (5.98%) Kubernetes
2 25 (5.34%) Grafana
3 23 (4.91%) Prometheus
4 17 (3.63%) Terraform
5 12 (2.56%) Control-M
6 9 (1.92%) Ansible
7 4 (0.85%) Active Directory Federation Services
7 4 (0.85%) Docker Swarm
7 4 (0.85%) Nessus
7 4 (0.85%) Nmap
7 4 (0.85%) vCenter Server
8 3 (0.64%) Nagios
8 3 (0.64%) SCCM
8 3 (0.64%) ZABBIX
9 2 (0.43%) Kibana
10 1 (0.21%) CSIRT
10 1 (0.21%) Microsoft Intune
10 1 (0.21%) Podman
10 1 (0.21%) Red Hat Satellite
Vendors
1 115 (24.57%) Microsoft
2 24 (5.13%) Oracle
3 19 (4.06%) Google
4 18 (3.85%) VMware
5 13 (2.78%) OpenAI
6 12 (2.56%) Sage
6 12 (2.56%) Xamarin
7 10 (2.14%) Cisco
7 10 (2.14%) SAP
7 10 (2.14%) Splunk
8 9 (1.92%) Fortinet
9 7 (1.50%) Dell
10 6 (1.28%) Palo Alto
10 6 (1.28%) Red Hat
10 6 (1.28%) Remedy
10 6 (1.28%) Salesforce
10 6 (1.28%) Veeam
11 5 (1.07%) Syncfusion
11 5 (1.07%) Telerik
11 5 (1.07%) Zoho