Internet Jobs in the UK excluding London

Internet
UK > UK excluding London

The table below provides summary statistics for permanent job vacancies advertised in the UK excluding London requiring Internet skills. It includes a benchmarking guide to the annual salaries offered in vacancies that cited Internet over the 6 months leading up to 25 April 2025, comparing them to the same period in the previous two years.

6 months to
25 Apr 2025
Same period 2024 Same period 2023
Rank 284 247 308
Rank change year-on-year -37 +61 -67
Permanent jobs citing Internet 308 807 664
As % of all permanent jobs advertised in the UK excluding London 0.84% 1.15% 1.07%
As % of the Communications & Networking category 5.86% 8.25% 6.00%
Number of salaries quoted 166 616 378
10th Percentile £26,625 £26,000 £27,750
25th Percentile £35,688 £32,500 £31,250
Median annual salary (50th Percentile) £44,000 £47,000 £47,500
Median % change year-on-year -6.38% -1.05% -
75th Percentile £68,075 £63,750 £67,500
90th Percentile £88,625 £70,000 £84,017
UK median annual salary £46,500 £50,000 £55,000
% change year-on-year -7.00% -9.09% -

All Communications and Computer Networking Skills
UK excluding London

Internet falls under the Communications and Computer Networking category. For comparison with the information above, the following table provides summary statistics for all permanent job vacancies requiring communications or computer networking skills in the UK excluding London.

Permanent vacancies with a requirement for communications or computer networking skills 5,253 9,777 11,064
As % of all permanent jobs advertised in the UK excluding London 14.32% 13.99% 17.78%
Number of salaries quoted 3,088 7,126 4,920
10th Percentile £23,504 £25,750 £26,250
25th Percentile £27,000 £31,250 £31,750
Median annual salary (50th Percentile) £40,000 £43,500 £45,000
Median % change year-on-year -8.05% -3.33% -
75th Percentile £57,500 £57,500 £60,000
90th Percentile £73,750 £68,750 £75,000
UK median annual salary £47,500 £47,500 £51,000
% change year-on-year - -6.86% -2.86%

Internet
Job Vacancy Trend in the UK excluding London

Job postings citing Internet as a proportion of all IT jobs advertised in the UK excluding London.
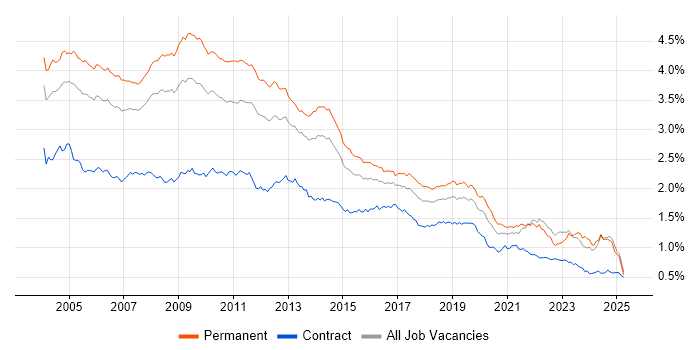
Job vacancy trend for Internet in the UK excluding London

Internet
Salary Trend in the UK excluding London

3-month moving average salary quoted in jobs citing Internet in the UK excluding London.

Salary trend for Internet in the UK excluding London

Internet
Salary Histogram in the UK excluding London

Salary distribution for jobs citing Internet in the UK excluding London over the 6 months to 25 April 2025.

Salary histogram for Internet in the UK excluding London

Internet
Job Locations in the UK excluding London

The table below looks at the demand and provides a guide to the median salaries quoted in IT jobs citing Internet within the UK excluding London region over the 6 months to 25 April 2025. The 'Rank Change' column provides an indication of the change in demand within each location based on the same 6 month period last year.

Location Rank Change
on Same Period
Last Year
Matching
Permanent
IT Job Ads
Median Salary
Past 6 Months
Median Salary
% Change
on Same Period
Last Year
Live
Jobs
Midlands +53 110 £54,000 +54.29% 64
West Midlands +82 84 £53,688 +53.39% 36
South East -8 59 £40,000 -19.46% 141
North of England -97 52 £53,000 +17.78% 127
Scotland +123 36 £72,500 +54.26% 24
North West -66 27 £56,250 +25.00% 55
East Midlands +4 26 £55,500 +58.57% 25
South West +68 25 £42,250 -21.40% 50
Yorkshire +17 23 £37,500 -11.76% 60
East of England -32 19 £62,000 +12.73% 60
Wales +30 8 £37,500 +36.36% 8
North East +25 2 £33,198 -39.64% 19
Internet
UK

Internet
Co-occurring Skills and Capabilities in the UK excluding London by Category

The follow tables expand on the table above by listing co-occurrences grouped by category. The same employment type, locality and period is covered with up to 20 co-occurrences shown in each of the following categories:

Application Platforms
1 23 (7.47%) Microsoft Exchange
2 9 (2.92%) SharePoint
3 5 (1.62%) Confluence
3 5 (1.62%) IBM Domino
4 3 (0.97%) SAS
5 2 (0.65%) Apache Airflow
5 2 (0.65%) IIS
6 1 (0.32%) Solana
6 1 (0.32%) WordPress
Applications
1 21 (6.82%) Microsoft Office
2 12 (3.90%) Microsoft Excel
3 8 (2.60%) Microsoft PowerPoint
4 1 (0.32%) FrameMaker
4 1 (0.32%) MadCap Flare
4 1 (0.32%) Microsoft Project
Business Applications
1 9 (2.92%) Magento
1 9 (2.92%) NetSuite
1 9 (2.92%) Payment Gateway
Cloud Services
1 31 (10.06%) Microsoft 365
2 29 (9.42%) Azure
3 26 (8.44%) AWS
4 21 (6.82%) SaaS
5 10 (3.25%) Microsoft Purview
6 9 (2.92%) Salesforce Commerce Cloud
7 8 (2.60%) Entra ID
8 6 (1.95%) Amazon EC2
8 6 (1.95%) Azure Sentinel
8 6 (1.95%) Serverless
9 5 (1.62%) Amazon S3
9 5 (1.62%) Figma
9 5 (1.62%) Kibo
10 4 (1.30%) AWS CloudFormation
10 4 (1.30%) AWS CodeBuild
10 4 (1.30%) AWS Lambda
10 4 (1.30%) Cloud Computing
10 4 (1.30%) Power Platform
11 3 (0.97%) Cloudflare
12 2 (0.65%) AWS CodeCommit
Communications & Networking
1 118 (38.31%) Network Security
2 98 (31.82%) WLAN
3 52 (16.88%) WAN
4 51 (16.56%) LAN
5 38 (12.34%) Firewall
6 33 (10.71%) Wireless
7 22 (7.14%) TCP/IP
8 18 (5.84%) VPN
9 17 (5.52%) Wi-Fi
10 16 (5.19%) SMTP
11 11 (3.57%) DNS
11 11 (3.57%) MPLS
12 10 (3.25%) DKIM
12 10 (3.25%) DMARC
12 10 (3.25%) DNSSEC
13 8 (2.60%) Broadband
13 8 (2.60%) VoIP
14 7 (2.27%) HTTP
14 7 (2.27%) VLAN
15 6 (1.95%) FTP
Database & Business Intelligence
1 15 (4.87%) MySQL
2 10 (3.25%) Relational Database
3 8 (2.60%) PostgreSQL
4 6 (1.95%) Amazon RDS
5 5 (1.62%) NoSQL
6 4 (1.30%) Power BI
6 4 (1.30%) SQL Server
7 3 (0.97%) Big Data
7 3 (0.97%) Data Warehouse
8 2 (0.65%) EDMS
8 2 (0.65%) Elasticsearch
8 2 (0.65%) GIS
8 2 (0.65%) Redis
9 1 (0.32%) Amazon Athena
9 1 (0.32%) Amazon QuickSight
9 1 (0.32%) Amazon Redshift
9 1 (0.32%) Data Lake
9 1 (0.32%) MongoDB
9 1 (0.32%) SQLite
9 1 (0.32%) Tableau
Development Applications
1 11 (3.57%) Jenkins
2 8 (2.60%) Maven
3 5 (1.62%) Git
3 5 (1.62%) JIRA
4 2 (0.65%) Burp Suite
4 2 (0.65%) GitLab
4 2 (0.65%) Metasploit
5 1 (0.32%) Cypress.io
5 1 (0.32%) Jasmine
5 1 (0.32%) Karma Test Runner
5 1 (0.32%) Robot Framework
5 1 (0.32%) TeamCity
General
1 51 (16.56%) Social Skills
2 41 (13.31%) Finance
3 34 (11.04%) Inclusion and Diversity
4 20 (6.49%) Banking
5 19 (6.17%) Manufacturing
5 19 (6.17%) Marketing
6 18 (5.84%) Telecoms
7 10 (3.25%) Legal
8 9 (2.92%) Aerospace
8 9 (2.92%) Retail
9 6 (1.95%) Analytical Skills
9 6 (1.95%) Automotive
9 6 (1.95%) Public Sector
10 5 (1.62%) Police
11 4 (1.30%) Pharmaceutical
12 2 (0.65%) Advertising
12 2 (0.65%) Front Office
12 2 (0.65%) Organisational Skills
13 1 (0.32%) Presentation Skills
13 1 (0.32%) Public Speaking
Job Titles
1 107 (34.74%) IT Support
2 104 (33.77%) Support Engineer
3 97 (31.49%) IT Engineer
4 96 (31.17%) IT Support Engineer
5 32 (10.39%) Lead
6 24 (7.79%) Senior
7 20 (6.49%) Infrastructure Support
8 19 (6.17%) Network Support
9 15 (4.87%) Developer
10 13 (4.22%) Technical Support
11 12 (3.90%) Infrastructure Engineer
12 11 (3.57%) Architect
13 10 (3.25%) Analyst
13 10 (3.25%) Android Engineer
13 10 (3.25%) Delivery Manager
13 10 (3.25%) Lead Infrastructure Engineer
13 10 (3.25%) Service Delivery Manager
13 10 (3.25%) Service Manager
14 9 (2.92%) Magento Developer
14 9 (2.92%) Senior Magento Developer
Libraries, Frameworks & Software Standards
1 14 (4.55%) HTML
2 12 (3.90%) CSS
3 10 (3.25%) Android Jetpack
3 10 (3.25%) Jetpack Compose
3 10 (3.25%) XML
4 8 (2.60%) RESTful
5 6 (1.95%) AngularJS
5 6 (1.95%) LDAP
5 6 (1.95%) React
6 5 (1.62%) .NET
6 5 (1.62%) Vue
7 4 (1.30%) .NET Core
7 4 (1.30%) Laravel
7 4 (1.30%) Symfony
8 3 (0.97%) Middleware
9 2 (0.65%) Django
9 2 (0.65%) HTML5
9 2 (0.65%) Kafka
9 2 (0.65%) Spring
9 2 (0.65%) Web Services
Miscellaneous
1 99 (32.14%) Driving Licence
2 28 (9.09%) Virtual Team
3 16 (5.19%) IoT
3 16 (5.19%) Product Ownership
4 12 (3.90%) Cloud Native
4 12 (3.90%) Onboarding
5 11 (3.57%) Online Banking
5 11 (3.57%) Security Operations Centre
6 10 (3.25%) Management Information System
6 10 (3.25%) Mobile App
7 9 (2.92%) Client/Server
8 8 (2.60%) Social Network
9 6 (1.95%) Cyber Threat
9 6 (1.95%) PKI
9 6 (1.95%) Self-Motivation
10 4 (1.30%) Operational Technology
11 3 (0.97%) CCTV
11 3 (0.97%) Greenfield Project
11 3 (0.97%) NHS
11 3 (0.97%) Private Cloud
Operating Systems
1 151 (49.03%) Windows
2 106 (34.42%) Linux
3 19 (6.17%) Android
4 11 (3.57%) Windows Server
5 7 (2.27%) Apple iOS
6 6 (1.95%) Windows 10
7 5 (1.62%) Mac OS
8 2 (0.65%) Unix
9 1 (0.32%) Windows Server 2012
Processes & Methodologies
1 128 (41.56%) Problem-Solving
2 113 (36.69%) ITIL
3 110 (35.71%) Computer Science
4 103 (33.44%) Mentoring
5 97 (31.49%) Network Management
6 96 (31.17%) Asset Management
7 95 (30.84%) IT Asset Management
8 34 (11.04%) Cybersecurity
9 25 (8.12%) User Experience
10 24 (7.79%) Agile
11 23 (7.47%) B2B
11 23 (7.47%) Customer Service
12 18 (5.84%) Roadmaps
12 18 (5.84%) UX Design
13 17 (5.52%) Containerisation
13 17 (5.52%) Service Delivery
14 16 (5.19%) CI/CD
14 16 (5.19%) Line Management
14 16 (5.19%) Microservices
14 16 (5.19%) Security Operations
Programming Languages
1 22 (7.14%) JavaScript
2 21 (6.82%) Python
3 19 (6.17%) PowerShell
4 14 (4.55%) PHP
5 10 (3.25%) Bash
5 10 (3.25%) C#
6 9 (2.92%) Kotlin
7 7 (2.27%) C++
8 6 (1.95%) Perl
9 5 (1.62%) Go
9 5 (1.62%) SQL
10 3 (0.97%) Java
11 2 (0.65%) Progress 4GL
11 2 (0.65%) TypeScript
11 2 (0.65%) VBScript
12 1 (0.32%) C
12 1 (0.32%) Rust
12 1 (0.32%) Scala
12 1 (0.32%) Swift
12 1 (0.32%) T-SQL
Qualifications
1 138 (44.81%) Degree
2 106 (34.42%) Computer Science Degree
3 103 (33.44%) Cisco Certification
4 101 (32.79%) CCNA
4 101 (32.79%) CCNP
5 96 (31.17%) Microsoft Certification
6 95 (30.84%) LPIC
6 95 (30.84%) MCP
6 95 (30.84%) MCSE
7 22 (7.14%) Master's Degree
8 19 (6.17%) MBA
9 14 (4.55%) SC Cleared
9 14 (4.55%) Security Cleared
10 6 (1.95%) DV Cleared
11 5 (1.62%) AWS Certification
11 5 (1.62%) CCIE
12 3 (0.97%) AWS Certified Solutions Architect
12 3 (0.97%) CISSP
12 3 (0.97%) CITP
12 3 (0.97%) CompTIA Security+
Quality Assurance & Compliance
1 4 (1.30%) GMP
1 4 (1.30%) ISO/IEC 27001
1 4 (1.30%) NCSC
2 3 (0.97%) NIST
3 2 (0.65%) Actionable Recommendations
3 2 (0.65%) QA
4 1 (0.32%) Accessibility
4 1 (0.32%) Data Quality
4 1 (0.32%) GDPR
4 1 (0.32%) ISO 9001
4 1 (0.32%) PCI DSS
4 1 (0.32%) SLA
System Software
1 28 (9.09%) Docker
2 22 (7.14%) Active Directory
3 5 (1.62%) Terminal Services
4 2 (0.65%) Hyper-V
4 2 (0.65%) Virtual Machines
5 1 (0.32%) Firmware
5 1 (0.32%) Virtual Servers
5 1 (0.32%) VMware Infrastructure
5 1 (0.32%) VMware NSX
Systems Management
1 16 (5.19%) Terraform
2 15 (4.87%) Kubernetes
3 8 (2.60%) QRadar
4 5 (1.62%) Ansible
5 4 (1.30%) Microsoft Intune
6 3 (0.97%) Graylog
6 3 (0.97%) Nessus
7 2 (0.65%) AWS Copilot
7 2 (0.65%) Nmap
7 2 (0.65%) Progress Chef
7 2 (0.65%) Puppet
7 2 (0.65%) SCCM
8 1 (0.32%) Computer Emergency Response Teams
8 1 (0.32%) Failover Clustering
8 1 (0.32%) Microsoft Clustering
8 1 (0.32%) SCOM
Vendors
1 167 (54.22%) Microsoft
2 124 (40.26%) Cisco
3 19 (6.17%) Unisys
4 10 (3.25%) Adobe
4 10 (3.25%) IronPort
4 10 (3.25%) Veritas
5 9 (2.92%) New Relic
6 8 (2.60%) Apple
6 8 (2.60%) Splunk
7 7 (2.27%) Meraki
7 7 (2.27%) VMware
8 5 (1.62%) Fortinet
8 5 (1.62%) Google
8 5 (1.62%) Juniper
9 4 (1.30%) HP
10 3 (0.97%) Aruba
10 3 (0.97%) Ruckus Wireless
11 2 (0.65%) Kaseya
11 2 (0.65%) SolarWinds
11 2 (0.65%) Sun