Senior Analyst Jobs in the UK excluding London

Senior Analyst
UK > UK excluding London

The median Senior Analyst salary in the UK excluding London is £50,000 per year, according to job vacancies posted during the 6 months leading to 20 September 2024.

The table below provides salary benchmarking and summary statistics, comparing them to the same period in the previous two years.

6 months to
20 Sep 2024
Same period 2023 Same period 2022
Rank 169 269 242
Rank change year-on-year +100 -27 +70
Permanent jobs requiring a Senior Analyst 899 462 1,081
As % of all permanent jobs advertised in the UK excluding London 1.53% 1.23% 1.50%
As % of the Job Titles category 1.60% 1.31% 1.58%
Number of salaries quoted 258 311 655
10th Percentile £33,200 £35,733 £32,700
25th Percentile £40,000 £41,250 £41,825
Median annual salary (50th Percentile) £50,000 £50,139 £50,000
Median % change year-on-year -0.28% +0.28% +5.26%
75th Percentile £62,188 £61,250 £60,000
90th Percentile £70,600 £70,250 £67,500
UK median annual salary £60,000 £57,896 £55,000
% change year-on-year +3.63% +5.27% +4.76%

All Permanent IT Job Vacancies
UK excluding London

For comparison with the information above, the following table provides summary statistics for all permanent IT job vacancies in the UK excluding London. Most job vacancies include a discernible job title that can be normalized. As such, the figures in the second row provide an indication of the number of permanent jobs in our overall sample.

Permanent vacancies in the UK excluding London with a recognized job title 56,175 35,323 68,428
% of permanent jobs with a recognized job title 95.45% 94.08% 95.15%
Number of salaries quoted 30,795 24,269 41,326
10th Percentile £30,000 £28,250 £30,000
25th Percentile £38,750 £38,750 £38,750
Median annual salary (50th Percentile) £50,000 £52,500 £52,500
Median % change year-on-year -4.76% - +5.00%
75th Percentile £65,000 £68,750 £67,500
90th Percentile £80,000 £80,000 £81,250
UK median annual salary £55,000 £60,000 £60,000
% change year-on-year -8.33% - +9.09%

Senior Analyst
Job Vacancy Trend in the UK excluding London

Job postings that featured Senior Analyst in the job title as a proportion of all IT jobs advertised in the UK excluding London.
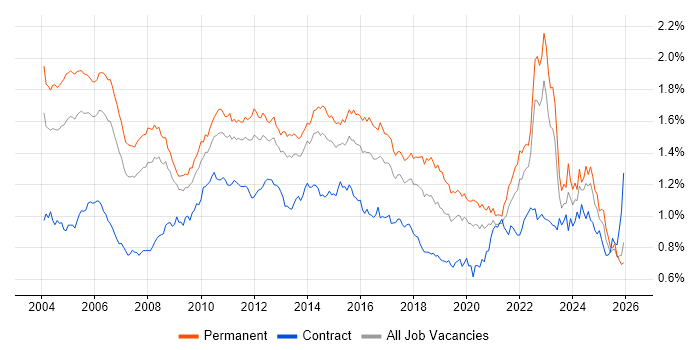
Job vacancy trend for Senior Analyst in the UK excluding London

Senior Analyst
Salary Trend in the UK excluding London

3-month moving average salary quoted in jobs citing Senior Analyst in the UK excluding London.

Salary trend for Senior Analyst in the UK excluding London

Senior Analyst
Salary Histogram in the UK excluding London

Salary distribution for jobs citing Senior Analyst in the UK excluding London over the 6 months to 20 September 2024.

Salary histogram for Senior Analyst in the UK excluding London

Senior Analyst
Job Locations in the UK excluding London

The table below looks at the demand and provides a guide to the median salaries quoted in IT jobs citing Senior Analyst within the UK excluding London region over the 6 months to 20 September 2024. The 'Rank Change' column provides an indication of the change in demand within each location based on the same 6 month period last year.

Location Rank Change
on Same Period
Last Year
Matching
Permanent
IT Job Ads
Median Salary
Past 6 Months
Median Salary
% Change
on Same Period
Last Year
Live
Jobs
South East +90 266 £57,500 - 28
South West +112 196 £60,000 +20.00% 16
North of England +34 158 £45,000 -10.25% 12
Midlands +27 147 £50,000 -4.76% 30
West Midlands +16 98 £50,000 -4.76% 18
North West +13 82 £45,000 - 6
Yorkshire +10 57 £45,000 -18.18% 5
Scotland -17 55 £50,000 -0.28% 8
East of England +2 50 £35,000 -10.56% 10
East Midlands -13 47 £55,000 +14.58% 12
Wales +13 26 £45,000 -5.26% 5
North East -8 19 £52,500 +25.75% 1
Northern Ireland +23 2 £40,000 -15.79% 1
Channel Islands - 1 £67,500 -
Senior Analyst
UK

Senior Analyst Skill Set
Top 30 Co-occurring Skills and Capabilities in the UK excluding London

For the 6 months to 20 September 2024, Senior Analyst job roles required the following skills and capabilities in order of popularity. The figures indicate the absolute number co-occurrences and as a proportion of all permanent job ads across the UK excluding London region featuring Senior Analyst in the job title.

1 483 (53.73%) Social Skills
2 344 (38.26%) Finance
3 325 (36.15%) Broadband
4 304 (33.82%) Analytical Skills
5 287 (31.92%) Microsoft
6 266 (29.59%) Influencing Skills
7 261 (29.03%) Problem-Solving
8 256 (28.48%) Analytics
9 243 (27.03%) Agile
10 211 (23.47%) Customer Experience
11 210 (23.36%) Data Management
12 205 (22.80%) Data Governance
13 199 (22.14%) SQL
13 199 (22.14%) Microsoft Excel
14 183 (20.36%) Data Transformation
14 183 (20.36%) Data Hub
15 180 (20.02%) GCP
16 178 (19.80%) Continuous Improvement
17 173 (19.24%) Decision-Making
18 167 (18.58%) Data Analysis
19 166 (18.46%) Actionable Insight
20 153 (17.02%) CISA
21 152 (16.91%) Sarbanes-Oxley
22 142 (15.80%) Mentoring
23 137 (15.24%) ACCA
23 137 (15.24%) CIMA
23 137 (15.24%) Legal
24 132 (14.68%) Business Case
25 130 (14.46%) Google
26 128 (14.24%) Banking

Senior Analyst Skill Set
Co-occurring Skills and Capabilities in the UK excluding London by Category

The follow tables expand on the table above by listing co-occurrences grouped by category. The same employment type, locality and period is covered with up to 20 co-occurrences shown in each of the following categories:

Application Platforms
1 71 (7.90%) SAS
2 17 (1.89%) Mule
3 12 (1.33%) SharePoint
4 8 (0.89%) Confluence
5 6 (0.67%) Microsoft Exchange
6 4 (0.44%) Oracle Workflow
7 1 (0.11%) WebSphere
7 1 (0.11%) WebSphere Application Server
Applications
1 199 (22.14%) Microsoft Excel
2 46 (5.12%) Microsoft Office
3 13 (1.45%) Microsoft PowerPoint
4 5 (0.56%) Spreadsheet
5 2 (0.22%) Chatbot
5 2 (0.22%) MS Visio
Business Applications
1 7 (0.78%) Unit4 Business World
2 6 (0.67%) Oracle Applications
3 5 (0.56%) Dynamics CRM
4 2 (0.22%) NetSuite
4 2 (0.22%) Oracle EBS
4 2 (0.22%) Oracle EBS R12
4 2 (0.22%) Oracle Financials
4 2 (0.22%) Oracle Manufacturing
4 2 (0.22%) Oracle SCM
4 2 (0.22%) SAP Business One
5 1 (0.11%) SAP Payroll
Cloud Services
1 180 (20.02%) GCP
2 77 (8.57%) Azure
3 59 (6.56%) Power Platform
4 57 (6.34%) Entra ID
5 48 (5.34%) AWS
6 37 (4.12%) Collibra
7 30 (3.34%) Microsoft 365
8 18 (2.00%) SaaS
9 12 (1.33%) Azure DevOps
10 11 (1.22%) PowerApps
11 10 (1.11%) Cloud Computing
12 8 (0.89%) Dynamics 365
13 7 (0.78%) Azure Sentinel
14 5 (0.56%) IaaS
14 5 (0.56%) PaaS
15 4 (0.44%) Azure ExpressRoute
16 3 (0.33%) Salesforce Sales Cloud
16 3 (0.33%) Salesforce Service Cloud
17 2 (0.22%) Google Sheets
17 2 (0.22%) Power Automate
Communications & Networking
1 325 (36.15%) Broadband
2 45 (5.01%) Firewall
3 21 (2.34%) Network Security
4 16 (1.78%) Internet
5 12 (1.33%) TCP/IP
6 11 (1.22%) VoIP
7 9 (1.00%) Wireless
8 6 (0.67%) DHCP
8 6 (0.67%) DNS
9 5 (0.56%) WPA
10 3 (0.33%) HTTP
10 3 (0.33%) Remote Desktop
10 3 (0.33%) Wi-Fi
11 2 (0.22%) Cisco ASA
11 2 (0.22%) DMZ
11 2 (0.22%) Intrusion Detection
11 2 (0.22%) LAN
11 2 (0.22%) WAN
12 1 (0.11%) Cisco ISE
12 1 (0.11%) VLAN
Database & Business Intelligence
1 183 (20.36%) Data Hub
2 56 (6.23%) Power BI
3 39 (4.34%) BigQuery
4 37 (4.12%) Metadata
5 30 (3.34%) Tableau
6 10 (1.11%) Qlik Sense
7 7 (0.78%) Data Mining
7 7 (0.78%) Data Warehouse
7 7 (0.78%) Geospatial Data
8 5 (0.56%) Oracle Reports
9 4 (0.44%) MS Access
9 4 (0.44%) SQL Server
10 3 (0.33%) Looker
10 3 (0.33%) SQL Server Reporting Services
11 2 (0.22%) Data Lake
11 2 (0.22%) Relational Database
12 1 (0.11%) Business Intelligence Development Studio
12 1 (0.11%) Enterprise Data Warehouse
12 1 (0.11%) NonStop SQL
12 1 (0.11%) Sisense
Development Applications
1 18 (2.00%) JIRA
2 16 (1.78%) Git
3 14 (1.56%) Selenium
4 10 (1.11%) JMeter
5 8 (0.89%) WebDriver
6 7 (0.78%) Postman
7 5 (0.56%) JUnit
7 5 (0.56%) SpecFlow
7 5 (0.56%) TeamCity
7 5 (0.56%) TestNG
8 4 (0.44%) Oracle Forms
8 4 (0.44%) Subversion
9 3 (0.33%) SoapUI
9 3 (0.33%) Team Foundation Server
10 1 (0.11%) Cucumber
10 1 (0.11%) NUnit
10 1 (0.11%) Oracle APEX
10 1 (0.11%) SQL Server Management Studio (SSMS)
10 1 (0.11%) Zephyr
General
1 483 (53.73%) Social Skills
2 344 (38.26%) Finance
3 304 (33.82%) Analytical Skills
4 266 (29.59%) Influencing Skills
5 137 (15.24%) Legal
6 128 (14.24%) Banking
7 33 (3.67%) Retail
8 23 (2.56%) Presentation Skills
9 19 (2.11%) Manufacturing
9 19 (2.11%) Organisational Skills
10 13 (1.45%) Marketing
11 12 (1.33%) Inclusion and Diversity
12 10 (1.11%) Automotive
12 10 (1.11%) General Ledger
12 10 (1.11%) Pharmaceutical
12 10 (1.11%) Public Sector
13 9 (1.00%) Retail Banking
14 8 (0.89%) Law
15 5 (0.56%) Aerospace
16 4 (0.44%) Advertising
Libraries, Frameworks & Software Standards
1 5 (0.56%) .NET
1 5 (0.56%) Gherkin
1 5 (0.56%) Lightning Web Components
2 3 (0.33%) HTML
2 3 (0.33%) SOAP
3 2 (0.22%) .NET Framework
3 2 (0.22%) LDAP
3 2 (0.22%) SailPoint
4 1 (0.11%) GraphQL
4 1 (0.11%) Playwright
4 1 (0.11%) REST
Miscellaneous
1 77 (8.57%) Management Information System
2 37 (4.12%) Over-the-Top Content
3 33 (3.67%) Credit Risk
4 26 (2.89%) Cyber Threat
5 21 (2.34%) Onboarding
6 19 (2.11%) Social Media
7 17 (1.89%) Cyberattack
8 10 (1.11%) Hybrid Cloud
8 10 (1.11%) Operational Technology
9 9 (1.00%) Biopharmaceutical
9 9 (1.00%) Cloud Native
9 9 (1.00%) Product Ownership
9 9 (1.00%) Smartphone
9 9 (1.00%) Video Conferencing
10 8 (0.89%) Cyber Defence
10 8 (0.89%) Security Posture
11 7 (0.78%) Driving Licence
11 7 (0.78%) Self-Motivation
12 6 (0.67%) Analytical Mindset
12 6 (0.67%) Security Operations Centre
Operating Systems
1 29 (3.23%) Windows
2 15 (1.67%) Windows Server
3 9 (1.00%) Linux
4 7 (0.78%) Windows 10
5 4 (0.44%) Unix
6 2 (0.22%) Windows Server 2016
Processes & Methodologies
1 261 (29.03%) Problem-Solving
2 256 (28.48%) Analytics
3 243 (27.03%) Agile
4 211 (23.47%) Customer Experience
5 210 (23.36%) Data Management
6 205 (22.80%) Data Governance
7 183 (20.36%) Data Transformation
8 178 (19.80%) Continuous Improvement
9 173 (19.24%) Decision-Making
10 167 (18.58%) Data Analysis
11 166 (18.46%) Actionable Insight
12 142 (15.80%) Mentoring
13 132 (14.68%) Business Case
14 127 (14.13%) Budgeting and Forecasting
15 118 (13.13%) Budgeting
16 106 (11.79%) IT Audit
17 104 (11.57%) Cybersecurity
18 83 (9.23%) Information Security
19 68 (7.56%) Customer Service
20 64 (7.12%) Coaching
Programming Languages
1 199 (22.14%) SQL
2 66 (7.34%) Python
3 50 (5.56%) PowerShell
4 19 (2.11%) VBA
5 18 (2.00%) R
6 14 (1.56%) C#
7 6 (0.67%) JavaScript
7 6 (0.67%) PL/SQL
8 4 (0.44%) Bicep
8 4 (0.44%) Julia
9 2 (0.22%) Bash
10 1 (0.11%) Data Analysis Expressions
10 1 (0.11%) Java
10 1 (0.11%) Kusto Query Language
10 1 (0.11%) PHP
10 1 (0.11%) RPG
10 1 (0.11%) TypeScript
Qualifications
1 153 (17.02%) CISA
2 137 (15.24%) ACCA
2 137 (15.24%) CIMA
3 122 (13.57%) Degree
4 30 (3.34%) Security Cleared
5 25 (2.78%) CISSP
6 23 (2.56%) SC Cleared
7 19 (2.11%) Master's Degree
8 16 (1.78%) CISM
9 14 (1.56%) DBS Check
10 10 (1.11%) Computer Science Degree
11 9 (1.00%) ISTQB
12 8 (0.89%) CompTIA Security+
12 8 (0.89%) MBA
12 8 (0.89%) SSCP
13 7 (0.78%) DV Cleared
13 7 (0.78%) GIAC
14 5 (0.56%) CEH
14 5 (0.56%) Cisco Certification
15 4 (0.44%) PMI Certification
Quality Assurance & Compliance
1 152 (16.91%) Sarbanes-Oxley
2 49 (5.45%) Data Quality
3 41 (4.56%) ISO/IEC 27001
4 40 (4.45%) GDPR
5 29 (3.23%) NIST
6 16 (1.78%) QA
7 14 (1.56%) SLA
8 9 (1.00%) HIPAA
8 9 (1.00%) IFRS
8 9 (1.00%) PCI DSS
9 5 (0.56%) Cyber Essentials
9 5 (0.56%) GRC
9 5 (0.56%) ISO 22301
9 5 (0.56%) ISO/IEC 27002 (supersedes ISO/IEC 17799)
10 4 (0.44%) SOC 2
11 3 (0.33%) PMO
12 2 (0.22%) Accessibility
12 2 (0.22%) COBIT
13 1 (0.11%) FedRAMP
13 1 (0.11%) GMP
System Software
1 68 (7.56%) Active Directory
2 44 (4.89%) RACF
3 10 (1.11%) VMware Infrastructure
4 9 (1.00%) Docker
5 5 (0.56%) Virtual Machines
6 4 (0.44%) Hyper-V
7 3 (0.33%) Virtual Desktop
7 3 (0.33%) Virtual Servers
8 2 (0.22%) Microsoft Virtual Server
Systems Management
1 9 (1.00%) Kubernetes
2 6 (0.67%) CSIRT
3 5 (0.56%) SCCM
4 4 (0.44%) Terraform
5 2 (0.22%) CASB
6 1 (0.11%) Host Intrusion Detection System
6 1 (0.11%) Microsoft Intune
6 1 (0.11%) Nessus
6 1 (0.11%) SCOM
Vendors
1 287 (31.92%) Microsoft
2 130 (14.46%) Google
3 54 (6.01%) Oracle
4 48 (5.34%) CyberArk
5 38 (4.23%) Informatica
6 37 (4.12%) Cloudera
7 17 (1.89%) SAP
8 16 (1.78%) CA
9 13 (1.45%) Databricks
10 12 (1.33%) VMware
11 10 (1.11%) Cisco
12 9 (1.00%) Avaya
12 9 (1.00%) Hyperion
12 9 (1.00%) PeopleSoft
12 9 (1.00%) Salesforce
13 6 (0.67%) Palo Alto
14 4 (0.44%) Citrix
15 3 (0.33%) Intel
15 3 (0.33%) Meraki
15 3 (0.33%) Splunk