Process Improvement Jobs in the UK excluding London

Process Improvement
UK > UK excluding London

The table below provides summary statistics for permanent job vacancies advertised in the UK excluding London requiring Process Improvement skills. It includes a benchmarking guide to the annual salaries offered in vacancies that cited Process Improvement over the 6 months leading up to 31 May 2025, comparing them to the same period in the previous two years.

6 months to
31 May 2025
Same period 2024 Same period 2023
Rank 177 135 195
Rank change year-on-year -42 +60 +2
Permanent jobs citing Process Improvement 705 1,517 1,078
As % of all permanent jobs advertised in the UK excluding London 1.78% 2.03% 1.88%
As % of the Processes & Methodologies category 1.92% 2.46% 1.97%
Number of salaries quoted 417 699 500
10th Percentile £28,250 £29,000 £32,500
25th Percentile £32,750 £37,750 £42,500
Median annual salary (50th Percentile) £47,500 £50,000 £52,500
Median % change year-on-year -5.00% -4.76% +0.96%
75th Percentile £58,750 £63,750 £66,250
90th Percentile £77,500 £75,000 £72,500
UK median annual salary £53,000 £53,500 £60,000
% change year-on-year -0.93% -10.83% +4.35%

All Process and Methodology Skills
UK excluding London

Process Improvement falls under the Processes and Methodologies category. For comparison with the information above, the following table provides summary statistics for all permanent job vacancies requiring process or methodology skills in the UK excluding London.

Permanent vacancies with a requirement for process or methodology skills 36,721 61,614 54,758
As % of all permanent jobs advertised in the UK excluding London 92.53% 82.28% 95.52%
Number of salaries quoted 17,560 42,296 28,644
10th Percentile £26,250 £27,250 £30,500
25th Percentile £36,250 £36,250 £40,000
Median annual salary (50th Percentile) £51,564 £50,000 £55,000
Median % change year-on-year +3.13% -9.09% +4.76%
75th Percentile £65,000 £65,000 £70,000
90th Percentile £77,500 £77,500 £82,500
UK median annual salary £57,000 £55,000 £60,899
% change year-on-year +3.64% -9.69% +1.50%

Process Improvement
Job Vacancy Trend in the UK excluding London

Job postings citing Process Improvement as a proportion of all IT jobs advertised in the UK excluding London.
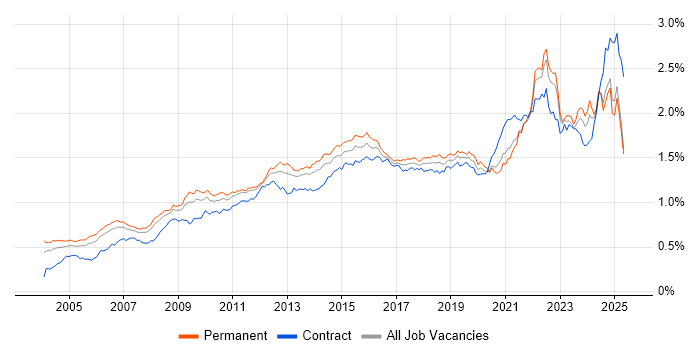
Job vacancy trend for Process Improvement in the UK excluding London

Process Improvement
Salary Trend in the UK excluding London

3-month moving average salary quoted in jobs citing Process Improvement in the UK excluding London.

Salary trend for Process Improvement in the UK excluding London

Process Improvement
Salary Histogram in the UK excluding London

Salary distribution for jobs citing Process Improvement in the UK excluding London over the 6 months to 31 May 2025.

Salary histogram for Process Improvement in the UK excluding London

Process Improvement
Job Locations in the UK excluding London

The table below looks at the demand and provides a guide to the median salaries quoted in IT jobs citing Process Improvement within the UK excluding London region over the 6 months to 31 May 2025. The 'Rank Change' column provides an indication of the change in demand within each location based on the same 6 month period last year.

Location Rank Change
on Same Period
Last Year
Matching
Permanent
IT Job Ads
Median Salary
Past 6 Months
Median Salary
% Change
on Same Period
Last Year
Live
Jobs
North of England +2 270 £45,000 -5.26% 243
North West +3 198 £47,000 -1.05% 121
South East -8 181 £57,500 +27.78% 190
Midlands -113 96 £45,362 -13.60% 136
East of England +30 73 £35,000 -30.00% 64
West Midlands -85 62 £48,000 -12.73% 91
Yorkshire +2 55 £42,500 -5.56% 92
South West +8 45 £53,750 +2.59% 68
East Midlands -52 33 £42,500 -3.41% 43
Scotland +71 19 £65,000 +17.37% 45
North East +17 17 £38,800 -8.71% 32
Northern Ireland +28 10 £32,500 -13.33% 26
Wales +27 10 £47,500 +13.10% 27
Channel Islands - 2 £78,750 - 10
Isle of Man - 1 - -
Process Improvement
UK

Process Improvement
Co-occurring Skills and Capabilities in the UK excluding London by Category

The follow tables expand on the table above by listing co-occurrences grouped by category. The same employment type, locality and period is covered with up to 20 co-occurrences shown in each of the following categories:

Application Platforms
1 49 (6.95%) SharePoint
2 11 (1.56%) IIS
3 10 (1.42%) Microsoft Exchange
4 4 (0.57%) Confluence
5 2 (0.28%) ThingWorx
5 2 (0.28%) WebLogic
6 1 (0.14%) CMS
6 1 (0.14%) Moodle
6 1 (0.14%) Oracle SOA Suite
6 1 (0.14%) Oracle Workflow
6 1 (0.14%) SugarCRM
Applications
1 103 (14.61%) Microsoft Excel
2 43 (6.10%) Microsoft Office
3 24 (3.40%) Microsoft Project
4 20 (2.84%) Trello
5 9 (1.28%) MS Visio
6 8 (1.13%) Microsoft PowerPoint
7 6 (0.85%) Chatbot
8 1 (0.14%) Simulink
8 1 (0.14%) Spreadsheet
Business Applications
1 46 (6.52%) SAP S/4HANA
2 15 (2.13%) NetSuite
3 8 (1.13%) Salesforce CRM
4 5 (0.71%) Maximo
4 5 (0.71%) SAP ERP
5 4 (0.57%) SAP Business One
6 3 (0.43%) Dynamics NAV
6 3 (0.43%) Infor CloudSuite
6 3 (0.43%) Infor CloudSuite Industrial (formerly SyteLine)
7 2 (0.28%) iTrent
7 2 (0.28%) Oracle BPM
7 2 (0.28%) Sage 1000
7 2 (0.28%) SAP GRC
7 2 (0.28%) SAP GTS
7 2 (0.28%) SAP HCM
7 2 (0.28%) SAP SCM
8 1 (0.14%) Oracle ERP
8 1 (0.14%) ResourceLink
8 1 (0.14%) SAP QM
8 1 (0.14%) TrackWise
Cloud Services
1 97 (13.76%) Power Platform
2 83 (11.77%) Azure
3 79 (11.21%) Microsoft 365
4 35 (4.96%) AWS
5 26 (3.69%) SaaS
6 13 (1.84%) PowerApps
7 11 (1.56%) Entra ID
8 9 (1.28%) Cloud Computing
8 9 (1.28%) Dynamics 365
8 9 (1.28%) Power Automate
9 8 (1.13%) Miro
10 7 (0.99%) Amazon CloudWatch
10 7 (0.99%) Amazon EC2
10 7 (0.99%) Amazon S3
10 7 (0.99%) Virtual Private Cloud
11 6 (0.85%) OneDrive
12 5 (0.71%) Azure DevOps
12 5 (0.71%) SuccessFactors
13 3 (0.43%) GitHub
13 3 (0.43%) PaaS
Communications & Networking
1 29 (4.11%) Firewall
2 16 (2.27%) VPN
3 11 (1.56%) Network Security
4 10 (1.42%) DNS
5 9 (1.28%) DHCP
6 7 (0.99%) TCP/IP
7 6 (0.85%) VoIP
8 5 (0.71%) Internet
9 4 (0.57%) LAN
9 4 (0.57%) WAN
10 3 (0.43%) Broadband
11 2 (0.28%) ATM
11 2 (0.28%) Cisco IOS
11 2 (0.28%) Wi-Fi
11 2 (0.28%) Wireless
11 2 (0.28%) WLAN
12 1 (0.14%) IP Telephony
12 1 (0.14%) VLAN
12 1 (0.14%) Wireless Security
12 1 (0.14%) Wireshark
Database & Business Intelligence
1 88 (12.48%) Power BI
2 30 (4.26%) Big Data
2 30 (4.26%) SQL Server
3 11 (1.56%) Tableau
4 9 (1.28%) Power Query
5 7 (0.99%) PostgreSQL
5 7 (0.99%) SQL Server Reporting Services
6 6 (0.85%) Relational Database
6 6 (0.85%) SAP HANA
7 4 (0.57%) Data Lake
7 4 (0.57%) PowerPivot
8 3 (0.43%) Data Warehouse
8 3 (0.43%) GIS
8 3 (0.43%) MS Access
8 3 (0.43%) Oracle Database
8 3 (0.43%) SQL Server Integration Services
9 2 (0.28%) BigQuery
9 2 (0.28%) NoSQL
9 2 (0.28%) Oracle Database 11g
9 2 (0.28%) Oracle Database 12c
Development Applications
1 49 (6.95%) JIRA
2 15 (2.13%) Selenium
3 9 (1.28%) Git
4 6 (0.85%) SpecFlow
5 4 (0.57%) Visual Studio
6 3 (0.43%) Jenkins
6 3 (0.43%) Oracle Forms
6 3 (0.43%) Postman
7 2 (0.28%) NUnit
7 2 (0.28%) Visual Studio Code
7 2 (0.28%) WebDriver
8 1 (0.14%) Jasmine
8 1 (0.14%) JDeveloper
8 1 (0.14%) JMeter
8 1 (0.14%) Karma Test Runner
8 1 (0.14%) LoadRunner
General
1 360 (51.06%) Social Skills
2 237 (33.62%) Finance
3 199 (28.23%) Analytical Skills
4 65 (9.22%) Law
5 54 (7.66%) Manufacturing
5 54 (7.66%) Marketing
6 39 (5.53%) Advertising
7 38 (5.39%) Legal
8 30 (4.26%) Inclusion and Diversity
9 24 (3.40%) Organisational Skills
10 18 (2.55%) Aviation
11 17 (2.41%) Retail
12 14 (1.99%) Banking
13 12 (1.70%) Aerospace
13 12 (1.70%) Pharmaceutical
13 12 (1.70%) Public Sector
14 11 (1.56%) Presentation Skills
14 11 (1.56%) Telecoms
15 8 (1.13%) Documentation Skills
16 7 (0.99%) Automotive
Job Titles
1 208 (29.50%) Analyst
2 77 (10.92%) Lead
3 72 (10.21%) Senior
4 53 (7.52%) Financial Analyst
5 42 (5.96%) Administrator
6 41 (5.82%) Business Analyst
7 39 (5.53%) Senior Manager
8 37 (5.25%) Systems Analyst
9 36 (5.11%) Project Manager
10 33 (4.68%) Data Analyst
11 32 (4.54%) Team Leader
12 30 (4.26%) Account Manager
12 30 (4.26%) Senior Account Manager
12 30 (4.26%) Support Analyst
13 29 (4.11%) Developer
14 26 (3.69%) Procurement Analyst
15 24 (3.40%) Finance Systems Analyst
16 22 (3.12%) IT Support
17 20 (2.84%) Systems Administrator
18 19 (2.70%) IT Manager
Libraries, Frameworks & Software Standards
1 25 (3.55%) .NET
2 15 (2.13%) React
3 11 (1.56%) CSS
3 11 (1.56%) HTML
4 7 (0.99%) REST
5 6 (0.85%) AngularJS
6 5 (0.71%) ASP.NET
6 5 (0.71%) Lightning Web Components
6 5 (0.71%) Oracle Fusion
6 5 (0.71%) SAP Fiori
6 5 (0.71%) SAPUI5
7 3 (0.43%) HTML5 Canvas
7 3 (0.43%) Node.js
8 2 (0.28%) .NET Core
8 2 (0.28%) Flutter
8 2 (0.28%) Jest
8 2 (0.28%) JSON
8 2 (0.28%) Middleware
8 2 (0.28%) RESTful
8 2 (0.28%) Web Services
Miscellaneous
1 107 (15.18%) Management Information System
2 39 (5.53%) Social Media
3 32 (4.54%) Product Ownership
4 30 (4.26%) Digital Media
4 30 (4.26%) Marketing Technology
5 25 (3.55%) Analytical Mindset
6 22 (3.12%) Onboarding
7 20 (2.84%) Self-Motivation
8 16 (2.27%) Data Protection Act
9 14 (1.99%) Legacy Systems
10 12 (1.70%) Client/Server
11 9 (1.28%) Driving Licence
11 9 (1.28%) Private Cloud
12 8 (1.13%) Market Risk
12 8 (1.13%) Operational Technology
12 8 (1.13%) Taxonomies
13 7 (0.99%) Data Centre
14 6 (0.85%) Robotics
15 5 (0.71%) Enterprise Software
15 5 (0.71%) Security Posture
Operating Systems
1 63 (8.94%) Windows
2 31 (4.40%) Windows Server
3 13 (1.84%) Apple iOS
4 10 (1.42%) Linux
5 9 (1.28%) Android
6 6 (0.85%) Windows Vista
7 5 (0.71%) CentOS
7 5 (0.71%) Rocky
7 5 (0.71%) Ubuntu
8 4 (0.57%) Windows 10
9 1 (0.14%) Embedded Linux
9 1 (0.14%) Windows Server 2016
Processes & Methodologies
1 314 (44.54%) Problem-Solving
2 187 (26.52%) Project Management
3 158 (22.41%) Agile
4 155 (21.99%) ERP
5 144 (20.43%) Continuous Improvement
6 103 (14.61%) Data Analysis
6 103 (14.61%) Stakeholder Management
7 98 (13.90%) Decision-Making
8 88 (12.48%) Change Management
9 80 (11.35%) Analytics
10 78 (11.06%) Customer Service
11 77 (10.92%) Business Intelligence
12 76 (10.78%) ITIL
12 76 (10.78%) Project Delivery
13 72 (10.21%) Collaborative Working
14 68 (9.65%) Data Management
15 66 (9.36%) PRINCE2
15 66 (9.36%) Service Delivery
16 61 (8.65%) Data Analytics
17 60 (8.51%) Roadmaps
Programming Languages
1 53 (7.52%) SQL
2 30 (4.26%) JavaScript
3 16 (2.27%) Python
4 14 (1.99%) C#
5 12 (1.70%) Java
6 8 (1.13%) T-SQL
7 7 (0.99%) PowerShell
8 6 (0.85%) Data Analysis Expressions
9 5 (0.71%) TypeScript
10 4 (0.57%) Apex Code
11 3 (0.43%) PHP
11 3 (0.43%) VB.NET
11 3 (0.43%) VBA
12 2 (0.28%) ABAP
12 2 (0.28%) Dart
13 1 (0.14%) C
13 1 (0.14%) C++
13 1 (0.14%) PL/SQL
13 1 (0.14%) R
13 1 (0.14%) VBScript
Qualifications
1 197 (27.94%) Degree
2 54 (7.66%) PMI Certification
2 54 (7.66%) PMP
3 52 (7.38%) DBS Check
4 40 (5.67%) ACCA
5 38 (5.39%) CIMA
6 34 (4.82%) BPSS Clearance
7 29 (4.11%) Computer Science Degree
8 19 (2.70%) Security Cleared
9 16 (2.27%) CCAB
9 16 (2.27%) SC Cleared
10 12 (1.70%) Microsoft Certification
11 11 (1.56%) Master's Degree
12 10 (1.42%) ITIL Certification
13 9 (1.28%) HNC
13 9 (1.28%) ISTQB
14 7 (0.99%) Azure Certification
14 7 (0.99%) NVQ Level 3
14 7 (0.99%) NVQ Level 4
15 5 (0.71%) MCSE
Quality Assurance & Compliance
1 69 (9.79%) Data Quality
2 58 (8.23%) QA
3 53 (7.52%) SLA
4 19 (2.70%) GDPR
5 10 (1.42%) Accessibility
5 10 (1.42%) ISO/IEC 27001
6 9 (1.28%) Sarbanes-Oxley
7 8 (1.13%) GLP
7 8 (1.13%) GMP
8 6 (0.85%) Cyber Essentials
8 6 (0.85%) Cyber Essentials PLUS
8 6 (0.85%) PMO
9 5 (0.71%) COBIT
10 3 (0.43%) GRC
10 3 (0.43%) PCI DSS
10 3 (0.43%) PMBOK
11 2 (0.28%) IFRS
11 2 (0.28%) NIST
12 1 (0.14%) SOC 2
12 1 (0.14%) WCAG
System Software
1 40 (5.67%) Active Directory
2 13 (1.84%) Hyper-V
3 12 (1.70%) VMware Infrastructure
4 5 (0.71%) Virtual Machines
5 4 (0.57%) Docker
5 4 (0.57%) VMware ESXi
6 2 (0.28%) Firmware
7 1 (0.14%) NDS
Systems Management
1 9 (1.28%) QRadar
2 6 (0.85%) Ansible
2 6 (0.85%) ArcSight ESM
2 6 (0.85%) Microsoft Intune
3 4 (0.57%) Kubernetes
4 3 (0.43%) FortiGate
5 2 (0.28%) Terraform
6 1 (0.14%) CA Single Sign-On
6 1 (0.14%) Computer Emergency Response Teams
6 1 (0.14%) Functional Safety
6 1 (0.14%) Grafana
6 1 (0.14%) Kibana
6 1 (0.14%) PingFederate
6 1 (0.14%) SCCM
6 1 (0.14%) Single Sign-On
Vendors
1 155 (21.99%) Microsoft
2 137 (19.43%) SAP
3 44 (6.24%) Salesforce
4 29 (4.11%) Workday
5 28 (3.97%) Oracle
6 24 (3.40%) Concur
7 19 (2.70%) VMware
8 16 (2.27%) Google
9 14 (1.99%) Cisco
10 11 (1.56%) ServiceNow
11 10 (1.42%) Anaplan
11 10 (1.42%) Splunk
12 6 (0.85%) ArcSight
12 6 (0.85%) LogLogic
12 6 (0.85%) McAfee
13 5 (0.71%) Facebook
13 5 (0.71%) JD Edwards
13 5 (0.71%) Liquidlogic
14 4 (0.57%) Databricks
14 4 (0.57%) Sage