RESTful Jobs in the UK excluding London

RESTful
UK > UK excluding London

The table below provides summary statistics for permanent job vacancies advertised in the UK excluding London requiring RESTful skills. It includes a benchmarking guide to the annual salaries offered in vacancies that cited RESTful over the 6 months leading up to 26 July 2024, comparing them to the same period in the previous two years.

6 months to
26 Jul 2024
Same period 2023 Same period 2022
Rank 183 213 149
Rank change year-on-year +30 -64 -60
Permanent jobs citing RESTful 920 811 1,904
As % of all permanent jobs advertised in the UK excluding London 1.41% 1.68% 2.43%
As % of the Libraries, Frameworks & Software Standards category 7.91% 6.70% 7.79%
Number of salaries quoted 652 637 1,116
10th Percentile £39,522 £42,500 £37,500
25th Percentile £46,625 £46,250 £42,521
Median annual salary (50th Percentile) £60,000 £55,000 £55,140
Median % change year-on-year +9.09% -0.25% +5.03%
75th Percentile £70,000 £75,000 £67,500
90th Percentile £75,772 £97,290 £80,250
UK median annual salary £60,000 £65,500 £65,000
% change year-on-year -8.40% +0.77% +13.04%

All Software Libraries and Frameworks
UK excluding London

RESTful falls under the Software Libraries and Frameworks category. For comparison with the information above, the following table provides summary statistics for all permanent job vacancies requiring technical specification, industry standards, software libraries and framework skills in the UK excluding London.

Permanent vacancies with a requirement for technical specification, industry standards, software libraries and framework skills 11,631 12,099 24,450
As % of all permanent jobs advertised in the UK excluding London 17.82% 25.13% 31.22%
Number of salaries quoted 8,091 7,940 14,523
10th Percentile £34,000 £36,250 £35,000
25th Percentile £42,500 £45,000 £42,500
Median annual salary (50th Percentile) £55,000 £57,500 £55,000
Median % change year-on-year -4.35% +4.55% +10.00%
75th Percentile £68,750 £72,500 £70,000
90th Percentile £80,000 £85,000 £82,500
UK median annual salary £60,000 £67,500 £65,000
% change year-on-year -11.11% +3.85% +13.04%

RESTful
Job Vacancy Trend in the UK excluding London

Job postings citing RESTful as a proportion of all IT jobs advertised in the UK excluding London.
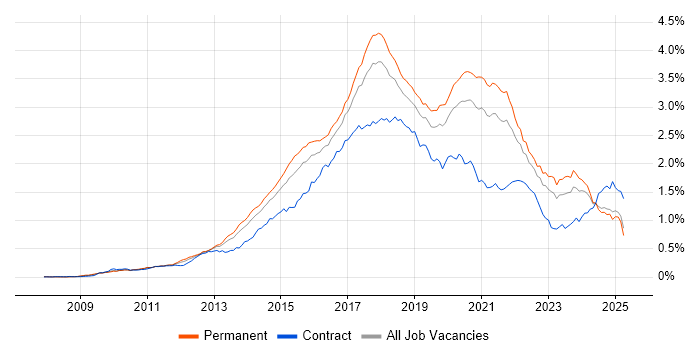
Job vacancy trend for RESTful in the UK excluding London

RESTful
Salary Trend in the UK excluding London

3-month moving average salary quoted in jobs citing RESTful in the UK excluding London.

Salary trend for RESTful in the UK excluding London

RESTful
Salary Histogram in the UK excluding London

Salary distribution for jobs citing RESTful in the UK excluding London over the 6 months to 26 July 2024.

Salary histogram for RESTful in the UK excluding London

RESTful
Job Locations in the UK excluding London

The table below looks at the demand and provides a guide to the median salaries quoted in IT jobs citing RESTful within the UK excluding London region over the 6 months to 26 July 2024. The 'Rank Change' column provides an indication of the change in demand within each location based on the same 6 month period last year.

Location Rank Change
on Same Period
Last Year
Matching
Permanent
IT Job Ads
Median Salary
Past 6 Months
Median Salary
% Change
on Same Period
Last Year
Live
Jobs
North of England +52 319 £60,000 +9.09% 37
South East -11 167 £60,750 -6.54% 30
Yorkshire +99 145 £55,000 +4.76% 14
Scotland +5 133 £70,000 +16.67% 14
North West -21 111 £60,000 +14.29% 18
Midlands -41 110 £55,000 -5.17% 21
South West +4 78 £60,000 +9.09% 14
West Midlands -32 69 £62,500 +13.64% 12
North East +23 63 £65,465 +19.03% 7
East of England +24 59 £57,500 +15.00% 8
Wales +42 44 £52,500 +2.73% 7
East Midlands -18 41 £52,500 -9.48% 9
Northern Ireland -13 12 - - 14
RESTful
UK

RESTful
Co-occurring Skills and Capabilities in the UK excluding London by Category

The follow tables expand on the table above by listing co-occurrences grouped by category. The same employment type, locality and period is covered with up to 20 co-occurrences shown in each of the following categories:

Application Platforms
1 37 (4.02%) CMS
2 30 (3.26%) Tuxedo
3 28 (3.04%) Sitecore CMS
3 28 (3.04%) Umbraco
4 27 (2.93%) IIS
5 26 (2.83%) Headless CMS
5 26 (2.83%) Kentico
6 19 (2.07%) SharePoint
7 14 (1.52%) Apache
7 14 (1.52%) Confluence
8 8 (0.87%) ArcGIS
8 8 (0.87%) WordPress
9 4 (0.43%) nginx
10 2 (0.22%) JBoss
10 2 (0.22%) OpenStack
10 2 (0.22%) Red Hat Fuse
10 2 (0.22%) ThingWorx
10 2 (0.22%) Tomcat
11 1 (0.11%) Apache Spark
11 1 (0.11%) GeoServer
Applications
1 6 (0.65%) Microsoft Excel
2 2 (0.22%) Spreadsheet
3 1 (0.11%) Photoshop
Business Applications
1 4 (0.43%) SDL Web 8
2 3 (0.33%) iTrent
2 3 (0.33%) Magento
2 3 (0.33%) Oracle Applications
3 2 (0.22%) Dynamics CRM
4 1 (0.11%) Dynamics NAV
4 1 (0.11%) nopCommerce
4 1 (0.11%) Oracle EBS
4 1 (0.11%) Payment Gateway
4 1 (0.11%) SAP ERP
4 1 (0.11%) SAP S/4HANA
4 1 (0.11%) Shopify
Cloud Services
1 396 (43.04%) Azure
2 321 (34.89%) AWS
3 86 (9.35%) Azure DevOps
4 73 (7.93%) SaaS
5 67 (7.28%) GitHub
6 65 (7.07%) Serverless
7 41 (4.46%) GCP
8 36 (3.91%) GitHub Actions
9 28 (3.04%) Azure Functions
10 26 (2.83%) Kontent
11 24 (2.61%) Power Platform
12 23 (2.50%) AWS Lambda
13 18 (1.96%) PaaS
14 16 (1.74%) Azure Service Bus
15 15 (1.63%) Microsoft 365
16 13 (1.41%) Azure App Service
16 13 (1.41%) Cloud Computing
16 13 (1.41%) Power Automate
16 13 (1.41%) PowerApps
17 11 (1.20%) Amazon ECS
Communications & Networking
1 47 (5.11%) Kerberos
2 37 (4.02%) HTTP
3 33 (3.59%) Internet
4 16 (1.74%) Network Security
5 15 (1.63%) MQTT
6 11 (1.20%) TCP/IP
7 5 (0.54%) VPN
7 5 (0.54%) Wireless
8 4 (0.43%) Reverse Proxy
9 2 (0.22%) DNS
9 2 (0.22%) DSL
10 1 (0.11%) HTTPS
10 1 (0.11%) LAN
10 1 (0.11%) WAN
Database & Business Intelligence
1 142 (15.43%) SQL Server
2 135 (14.67%) MySQL
3 95 (10.33%) NoSQL
4 88 (9.57%) Relational Database
5 85 (9.24%) PostgreSQL
6 55 (5.98%) MongoDB
7 44 (4.78%) Metadata
8 20 (2.17%) Redis
9 17 (1.85%) DynamoDB
10 15 (1.63%) Amazon RDS
11 14 (1.52%) Elasticsearch
11 14 (1.52%) RDBMS
12 13 (1.41%) Oracle Database
13 12 (1.30%) GIS
14 10 (1.09%) Oracle Database 12c
15 8 (0.87%) Big Data
16 7 (0.76%) Geospatial Data
17 6 (0.65%) Azure SQL Database
17 6 (0.65%) SQLite
18 5 (0.54%) NonStop SQL
Development Applications
1 276 (30.00%) Git
2 77 (8.37%) Jenkins
3 60 (6.52%) Bitbucket
4 44 (4.78%) Artifactory
5 42 (4.57%) Visual Studio
6 39 (4.24%) JIRA
7 28 (3.04%) CircleCI
8 26 (2.83%) GitLab
9 23 (2.50%) Selenium
10 21 (2.28%) NUnit
11 18 (1.96%) JUnit
12 16 (1.74%) TeamCity
13 15 (1.63%) Maven
13 15 (1.63%) Visual Studio Code
14 14 (1.52%) Jasmine
14 14 (1.52%) Postman
15 13 (1.41%) SonarQube
15 13 (1.41%) Team Foundation Server
16 11 (1.20%) gulp
17 10 (1.09%) Yeoman
General
1 172 (18.70%) Finance
2 170 (18.48%) Social Skills
3 122 (13.26%) Inclusion and Diversity
4 119 (12.93%) Law
5 100 (10.87%) Marketing
6 71 (7.72%) Public Sector
7 42 (4.57%) Analytical Skills
8 37 (4.02%) Games
9 32 (3.48%) Financial Institution
10 28 (3.04%) Organisational Skills
10 28 (3.04%) Retail
11 24 (2.61%) Manufacturing
12 23 (2.50%) Banking
13 13 (1.41%) Music Industry
14 12 (1.30%) Legal
15 9 (0.98%) Investment Banking
16 8 (0.87%) Influencing Skills
16 8 (0.87%) Multimedia
16 8 (0.87%) Tech for Good
17 7 (0.76%) Automotive
Job Titles
1 528 (57.39%) Developer
2 276 (30.00%) Senior
3 228 (24.78%) .NET Developer
4 195 (21.20%) Software Engineer
5 157 (17.07%) C# Developer
6 135 (14.67%) Lead
7 126 (13.70%) C# .NET Developer
8 125 (13.59%) Senior Developer
9 91 (9.89%) Senior Software Engineer
10 79 (8.59%) Software Developer
11 73 (7.93%) Lead Software Engineer
12 67 (7.28%) Full Stack Developer
13 63 (6.85%) Java Engineer
14 57 (6.20%) PHP Developer
15 55 (5.98%) Senior .NET Developer
16 52 (5.65%) Java Software Engineer
17 48 (5.22%) Senior C# Developer
18 43 (4.67%) Applications Developer
19 41 (4.46%) Senior C# .NET Developer
20 40 (4.35%) ASP.NET Developer
Libraries, Frameworks & Software Standards
1 383 (41.63%) .NET
2 321 (34.89%) AngularJS
3 255 (27.72%) HTML
4 241 (26.20%) React
5 212 (23.04%) CSS
6 187 (20.33%) Web Services
7 173 (18.80%) ASP.NET Web API
8 163 (17.72%) .NET Core
9 160 (17.39%) ASP.NET
10 132 (14.35%) Node.js
11 110 (11.96%) JSON
12 106 (11.52%) .NET Framework
13 101 (10.98%) Vue
14 93 (10.11%) Spring
15 89 (9.67%) XML
16 85 (9.24%) ASP.NET MVC
17 84 (9.13%) HTML5
17 84 (9.13%) Spring Boot
18 80 (8.70%) Laravel
19 68 (7.39%) SOAP
Miscellaneous
1 60 (6.52%) Cloud Native
2 59 (6.41%) Reference Data
3 47 (5.11%) Enterprise Cloud
3 47 (5.11%) Management Information System
4 43 (4.67%) Distributed Systems
5 38 (4.13%) Self-Motivation
6 33 (3.59%) Distributed Applications
7 32 (3.48%) Algorithms
7 32 (3.48%) Mobile App
8 30 (3.26%) Public Cloud
9 29 (3.15%) Greenfield Project
9 29 (3.15%) Product Ownership
10 25 (2.72%) IoT
11 18 (1.96%) Low-Code
12 14 (1.52%) Data Structures
13 12 (1.30%) Enterprise Software
14 9 (0.98%) Blockchain
14 9 (0.98%) Client/Server
15 8 (0.87%) Animation
15 8 (0.87%) Podcast
Operating Systems
1 39 (4.24%) Linux
2 25 (2.72%) Apple iOS
3 24 (2.61%) Windows
4 20 (2.17%) Android
5 8 (0.87%) Unix
6 3 (0.33%) Alpine Linux
6 3 (0.33%) Debian
7 1 (0.11%) tvOS
Processes & Methodologies
1 447 (48.59%) Agile
2 331 (35.98%) Full Stack Development
3 314 (34.13%) Software Engineering
4 252 (27.39%) Microservices
5 212 (23.04%) CI/CD
6 191 (20.76%) DevOps
7 161 (17.50%) Problem-Solving
8 158 (17.17%) SDLC
9 153 (16.63%) Test Automation
10 151 (16.41%) MVC
11 149 (16.20%) Multithreading
12 131 (14.24%) Computer Science
13 125 (13.59%) Mentoring
14 113 (12.28%) Roadmaps
15 108 (11.74%) Web Development
16 99 (10.76%) Continuous Integration
17 98 (10.65%) TDD
18 97 (10.54%) Design Patterns
19 95 (10.33%) User Experience
20 87 (9.46%) Containerisation
Programming Languages
1 448 (48.70%) JavaScript
2 359 (39.02%) C#
3 226 (24.57%) SQL
4 196 (21.30%) Java
5 101 (10.98%) PHP
6 96 (10.43%) Python
7 88 (9.57%) TypeScript
8 53 (5.76%) Go
9 48 (5.22%) SPARQL
10 44 (4.78%) Prolog
11 33 (3.59%) T-SQL
12 30 (3.26%) COBOL
12 30 (3.26%) Micro Focus COBOL
13 19 (2.07%) Kotlin
14 16 (1.74%) Swift
15 14 (1.52%) PowerShell
15 14 (1.52%) Ruby
16 12 (1.30%) C
17 11 (1.20%) PL/SQL
18 9 (0.98%) C++
Qualifications
1 134 (14.57%) Degree
2 52 (5.65%) Computer Science Degree
3 30 (3.26%) Master's Degree
4 20 (2.17%) Security Cleared
5 15 (1.63%) PhD
6 13 (1.41%) SC Cleared
7 7 (0.76%) AWS Certification
8 5 (0.54%) AWS Certified Developer
9 3 (0.33%) Azure Certification
9 3 (0.33%) Microsoft Certification
10 2 (0.22%) DV Cleared
10 2 (0.22%) HNC
11 1 (0.11%) CEH
11 1 (0.11%) CISSP
11 1 (0.11%) ISEB
11 1 (0.11%) ISTQB
11 1 (0.11%) ISTQB Foundation Certification
11 1 (0.11%) PMI Certification
11 1 (0.11%) PMP
11 1 (0.11%) TOGAF Certification
Quality Assurance & Compliance
1 46 (5.00%) QA
2 26 (2.83%) Accessibility
3 23 (2.50%) GDPR
4 10 (1.09%) HIPAA
5 4 (0.43%) PCI DSS
6 2 (0.22%) SLA
6 2 (0.22%) WCAG
7 1 (0.11%) HL7
System Software
1 138 (15.00%) Docker
2 56 (6.09%) Active Directory
3 2 (0.22%) Virtual Machines
3 2 (0.22%) VMware ESXi
4 1 (0.11%) Firmware
Systems Management
1 123 (13.37%) Kubernetes
2 41 (4.46%) Terraform
3 13 (1.41%) Grafana
4 8 (0.87%) Ansible
5 7 (0.76%) Graphite
5 7 (0.76%) MIIS
6 5 (0.54%) Puppet
7 3 (0.33%) Podman
8 2 (0.22%) Istio
8 2 (0.22%) Progress Chef
8 2 (0.22%) Prometheus
8 2 (0.22%) vRealize
9 1 (0.11%) cPanel
9 1 (0.11%) Plesk
Vendors
1 141 (15.33%) Microsoft
2 72 (7.83%) Oracle
3 38 (4.13%) Google
4 30 (3.26%) Micro Focus
5 28 (3.04%) Sitecore
6 26 (2.83%) Optimizely
7 12 (1.30%) Splunk
8 10 (1.09%) Facebook
8 10 (1.09%) YouTube
9 8 (0.87%) Dynatrace
9 8 (0.87%) ServiceNow
10 7 (0.76%) Apple
10 7 (0.76%) ESRI
10 7 (0.76%) WooCommerce
11 6 (0.65%) DevExpress
11 6 (0.65%) Zend
12 5 (0.54%) Databricks
12 5 (0.54%) OpenAI
13 4 (0.43%) Twitter
13 4 (0.43%) Xamarin