Data Centre Jobs in the UK excluding London

Data Center
UK > UK excluding London

The table below looks at the prevalence of the term Data Centre in permanent job vacancies in the UK excluding London. Included is a benchmarking guide to the salaries offered in vacancies that cited Data Centre over the 6 months leading up to 20 June 2025, comparing them to the same period in the previous two years.

6 months to
20 Jun 2025
Same period 2024 Same period 2023
Rank 248 150 35
Rank change year-on-year -98 -115 +148
Permanent jobs citing Data Centre 469 1,449 3,751
As % of all permanent jobs advertised in the UK excluding London 1.18% 1.77% 6.85%
As % of the Miscellaneous category 3.42% 5.66% 16.00%
Number of salaries quoted 319 1,050 743
10th Percentile £24,750 £31,000 £32,800
25th Percentile £37,500 £37,500 £41,757
Median annual salary (50th Percentile) £55,000 £50,000 £53,000
Median % change year-on-year +10.00% -5.66% +6.00%
75th Percentile £66,000 £62,500 £67,070
90th Percentile £79,000 £70,000 £85,000
UK median annual salary £60,000 £54,556 £60,000
% change year-on-year +9.98% -9.07% +0.87%

All Generic Skills
UK excluding London

Data Centre falls under the General and Transferable Skills category. For comparison with the information above, the following table provides summary statistics for all permanent job vacancies requiring generic IT skills in the UK excluding London.

Permanent vacancies with a requirement for generic IT skills 13,697 25,619 23,442
As % of all permanent jobs advertised in the UK excluding London 34.36% 31.36% 42.82%
Number of salaries quoted 6,111 15,611 10,741
10th Percentile £27,500 £26,250 £31,250
25th Percentile £36,250 £35,000 £41,250
Median annual salary (50th Percentile) £53,000 £50,000 £55,000
Median % change year-on-year +6.00% -9.09% +4.76%
75th Percentile £67,500 £65,000 £70,000
90th Percentile £80,000 £80,000 £85,000
UK median annual salary £60,000 £55,000 £65,000
% change year-on-year +9.09% -15.38% +4.00%

Data Centre
Job Vacancy Trend in the UK excluding London

Job postings citing Data Centre as a proportion of all IT jobs advertised in the UK excluding London.
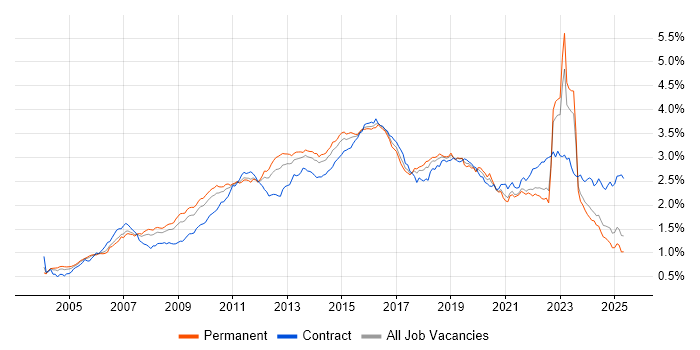
Job vacancy trend for Data Centre in the UK excluding London

Data Centre
Salary Trend in the UK excluding London

3-month moving average salary quoted in jobs citing Data Centre in the UK excluding London.

Salary trend for Data Centre in the UK excluding London

Data Centre
Salary Histogram in the UK excluding London

Salary distribution for jobs citing Data Centre in the UK excluding London over the 6 months to 20 June 2025.

Salary histogram for Data Centre in the UK excluding London

Data Centre
Job Locations in the UK excluding London

The table below looks at the demand and provides a guide to the median salaries quoted in IT jobs citing Data Centre within the UK excluding London region over the 6 months to 20 June 2025. The 'Rank Change' column provides an indication of the change in demand within each location based on the same 6 month period last year.

Location Rank Change
on Same Period
Last Year
Matching
Permanent
IT Job Ads
Median Salary
Past 6 Months
Median Salary
% Change
on Same Period
Last Year
Live
Jobs
South East -33 184 £51,000 -7.27% 689
North of England -126 78 £58,200 +36.94% 445
Midlands -48 60 £57,500 +15.00% 250
East of England -4 59 £64,000 +28.00% 265
South West +20 55 £45,000 -18.18% 201
North West -128 33 £54,000 +30.11% 227
West Midlands -16 32 £66,250 +22.69% 153
Yorkshire -9 28 £56,600 +33.18% 183
East Midlands -24 28 £54,388 +27.97% 97
Scotland +52 23 £47,500 -13.64% 164
North East +32 17 £65,000 +46.81% 37
Wales -23 8 £60,000 +64.49% 65
Northern Ireland +43 5 £56,250 +10.29% 38
Isle of Man +9 3 £91,000 +145.95%
Data Centre
UK

Data Centre
Co-occurring Skills and Capabilities in the UK excluding London by Category

The follow tables expand on the table above by listing co-occurrences grouped by category. The same employment type, locality and period is covered with up to 20 co-occurrences shown in each of the following categories:

Application Platforms
1 19 (4.05%) Microsoft Exchange
2 7 (1.49%) OpenStack
3 6 (1.28%) Apache
3 6 (1.28%) IIS
4 4 (0.85%) SharePoint
5 2 (0.43%) Confluence
5 2 (0.43%) IBM Notes
5 2 (0.43%) JOnAS
5 2 (0.43%) Tomcat
5 2 (0.43%) WebSphere
5 2 (0.43%) WebSphere Application Server
6 1 (0.21%) nginx
6 1 (0.21%) ThingWorx
Applications
1 35 (7.46%) Microsoft Office
2 11 (2.35%) Microsoft Excel
3 9 (1.92%) MS Visio
4 8 (1.71%) Microsoft Project
5 4 (0.85%) Microsoft PowerPoint
6 2 (0.43%) AutoCAD
7 1 (0.21%) Revit
Business Applications
1 5 (1.07%) Primavera
Cloud Services
1 86 (18.34%) Azure
2 66 (14.07%) AWS
3 36 (7.68%) SaaS
4 34 (7.25%) Microsoft 365
5 28 (5.97%) Entra ID
6 20 (4.26%) PaaS
7 19 (4.05%) IaaS
8 17 (3.62%) Azure DevOps
9 16 (3.41%) Power Platform
10 14 (2.99%) Azure AI
10 14 (2.99%) Azure ExpressRoute
10 14 (2.99%) Azure Key Vault
10 14 (2.99%) Azure Monitor
10 14 (2.99%) Azure Service Bus
10 14 (2.99%) Power Automate
11 7 (1.49%) GCP
11 7 (1.49%) OCI
12 5 (1.07%) Cloud Computing
12 5 (1.07%) Cloudflare
13 4 (0.85%) GitHub
Communications & Networking
1 99 (21.11%) Firewall
2 60 (12.79%) VPN
3 59 (12.58%) WAN
4 43 (9.17%) LAN
5 42 (8.96%) DNS
6 38 (8.10%) BGP
6 38 (8.10%) TCP/IP
7 36 (7.68%) OSPF
8 31 (6.61%) SD-WAN
9 28 (5.97%) VLAN
10 26 (5.54%) DHCP
11 18 (3.84%) Ethernet
11 18 (3.84%) Network Security
12 16 (3.41%) IPsec
13 14 (2.99%) Cisco ASA
13 14 (2.99%) MPLS
14 12 (2.56%) Cisco Firepower
14 12 (2.56%) SNMP
15 11 (2.35%) MQTT
15 11 (2.35%) VXLAN
Database & Business Intelligence
1 26 (5.54%) SQL Server
2 18 (3.84%) MySQL
3 16 (3.41%) Power BI
4 14 (2.99%) Data Lake
5 8 (1.71%) Relational Database
6 2 (0.43%) Big Data
6 2 (0.43%) Metadata
6 2 (0.43%) NoSQL
6 2 (0.43%) RDBMS
7 1 (0.21%) MariaDB
7 1 (0.21%) PostgreSQL
Development Applications
1 15 (3.20%) Git
2 7 (1.49%) JIRA
3 6 (1.28%) Jenkins
4 3 (0.64%) Sonatype Nexus
5 2 (0.43%) JMeter
6 1 (0.21%) Bitbucket
6 1 (0.21%) GitLab
6 1 (0.21%) SQL Server Management Studio (SSMS)
General
1 183 (39.02%) Social Skills
2 34 (7.25%) Finance
3 26 (5.54%) Analytical Skills
4 22 (4.69%) Inclusion and Diversity
4 22 (4.69%) Public Sector
5 17 (3.62%) Manufacturing
6 14 (2.99%) Pharmaceutical
6 14 (2.99%) Retail
7 13 (2.77%) Marketing
8 11 (2.35%) Local Government
9 9 (1.92%) Back Office
9 9 (1.92%) Electronics
9 9 (1.92%) Presentation Skills
10 8 (1.71%) Organisational Skills
11 7 (1.49%) Legal
12 6 (1.28%) Telecoms
13 5 (1.07%) Law
14 4 (0.85%) Banking
15 2 (0.43%) Police
16 1 (0.21%) Public Speaking
Job Titles
1 46 (9.81%) Graduate
1 46 (9.81%) Graduate Sales Executive
1 46 (9.81%) Network Engineer
1 46 (9.81%) Sales Executive
2 38 (8.10%) Architect
2 38 (8.10%) Infrastructure Engineer
3 35 (7.46%) Lead
4 34 (7.25%) Senior
5 29 (6.18%) Support Engineer
5 29 (6.18%) Systems Engineer
6 19 (4.05%) Cloud Architect
7 17 (3.62%) IT Engineer
7 17 (3.62%) Vulnerability Manager
8 16 (3.41%) Business Development Manager
8 16 (3.41%) Business Manager
8 16 (3.41%) Data Centre Engineer
8 16 (3.41%) Development Manager
8 16 (3.41%) Field Engineer
8 16 (3.41%) Project Manager
9 15 (3.20%) Infrastructure Manager
Libraries, Frameworks & Software Standards
1 7 (1.49%) LDAP
2 6 (1.28%) .NET
2 6 (1.28%) CSS
2 6 (1.28%) Middleware
2 6 (1.28%) YAML
3 5 (1.07%) 802.1X
4 4 (0.85%) JSON
4 4 (0.85%) OpenCL
5 3 (0.64%) Flash
6 2 (0.43%) Elastic Stack
7 1 (0.21%) LAMP
7 1 (0.21%) ModSecurity
7 1 (0.21%) Node.js
7 1 (0.21%) RFC 2544
7 1 (0.21%) Web Services
Miscellaneous
1 33 (7.04%) Driving Licence
2 32 (6.82%) SCADA
3 27 (5.76%) Operational Technology
4 19 (4.05%) Renewable Energy
5 17 (3.62%) Public Cloud
6 16 (3.41%) Management Information System
6 16 (3.41%) Self-Motivation
7 14 (2.99%) NHS
8 13 (2.77%) IoT
8 13 (2.77%) Onboarding
9 11 (2.35%) Biopharmaceutical
9 11 (2.35%) Industry 4.0
10 10 (2.13%) Hybrid Cloud
11 9 (1.92%) Private Cloud
12 7 (1.49%) PMI
12 7 (1.49%) Product Ownership
13 5 (1.07%) Client/Server
13 5 (1.07%) Replication
13 5 (1.07%) Social Media
14 4 (0.85%) CUDA
Operating Systems
1 94 (20.04%) Windows
2 55 (11.73%) Linux
3 34 (7.25%) Windows Server
4 7 (1.49%) CentOS
4 7 (1.49%) Ubuntu
5 6 (1.28%) Windows 10
5 6 (1.28%) Windows Server 2012
5 6 (1.28%) Windows Server 2019
6 5 (1.07%) AIX
6 5 (1.07%) Unix
6 5 (1.07%) Windows Server 2016
7 3 (0.64%) Debian
7 3 (0.64%) Red Hat Enterprise Linux
7 3 (0.64%) Rocky
7 3 (0.64%) zOS
8 2 (0.43%) Mac OS
8 2 (0.43%) Solaris
8 2 (0.43%) VMS
8 2 (0.43%) Windows 7
9 1 (0.21%) SUSE
Processes & Methodologies
1 114 (24.31%) Cybersecurity
2 74 (15.78%) Problem-Solving
3 73 (15.57%) Customer Service
4 71 (15.14%) Artificial Intelligence
5 63 (13.43%) Project Management
6 62 (13.22%) Project Delivery
7 55 (11.73%) Continuous Improvement
8 54 (11.51%) Customer Experience
9 52 (11.09%) Infrastructure Engineering
10 51 (10.87%) Agile
11 44 (9.38%) ITIL
12 43 (9.17%) DevOps
12 43 (9.17%) Mentoring
13 42 (8.96%) Roadmaps
14 35 (7.46%) Business Development
15 30 (6.40%) Migration
16 27 (5.76%) Business Strategy
17 26 (5.54%) Business Enablement
18 25 (5.33%) CI/CD
18 25 (5.33%) Service Management
Programming Languages
1 43 (9.17%) PowerShell
2 33 (7.04%) SQL
3 32 (6.82%) Python
4 14 (2.99%) Bicep
5 11 (2.35%) Bash
6 7 (1.49%) JavaScript
7 6 (1.28%) C#
8 5 (1.07%) C
8 5 (1.07%) C++
8 5 (1.07%) T-SQL
9 3 (0.64%) JCL
9 3 (0.64%) REXX
10 2 (0.43%) Fortran
10 2 (0.43%) Java
11 1 (0.21%) Perl
11 1 (0.21%) Scala
11 1 (0.21%) SystemVerilog
11 1 (0.21%) Tcl
11 1 (0.21%) TypeScript
Qualifications
1 96 (20.47%) Degree
2 48 (10.23%) Security Cleared
3 43 (9.17%) Cisco Certification
4 34 (7.25%) SC Cleared
5 30 (6.40%) CCNA
6 25 (5.33%) CCNP
7 19 (4.05%) Azure Certification
7 19 (4.05%) DV Cleared
8 17 (3.62%) DBS Check
9 14 (2.99%) Chartered Engineer
10 11 (2.35%) HNC
10 11 (2.35%) HND
10 11 (2.35%) PMI Certification
11 10 (2.13%) Microsoft Certification
12 9 (1.92%) Network+ Certification
13 8 (1.71%) TOGAF Certification
14 7 (1.49%) Master's Degree
15 6 (1.28%) BPSS Clearance
15 6 (1.28%) MCSE
16 5 (1.07%) PMP
Quality Assurance & Compliance
1 25 (5.33%) SLA
2 9 (1.92%) PCI DSS
3 7 (1.49%) GDPR
3 7 (1.49%) ISO/IEC 27001
3 7 (1.49%) QA
4 6 (1.28%) NIST
5 5 (1.07%) Sarbanes-Oxley
6 3 (0.64%) Data Quality
7 2 (0.43%) Cyber Essentials
7 2 (0.43%) PMO
8 1 (0.21%) Cyber Essentials PLUS
8 1 (0.21%) HIPAA
8 1 (0.21%) NCSC
8 1 (0.21%) SOC 2
System Software
1 56 (11.94%) VMware Infrastructure
2 46 (9.81%) Active Directory
3 33 (7.04%) Virtual Machines
4 26 (5.54%) Hyper-V
5 12 (2.56%) VMware ESXi
6 8 (1.71%) Firmware
7 5 (1.07%) Docker
7 5 (1.07%) NFS
8 3 (0.64%) KVM
8 3 (0.64%) Time Sharing Option
8 3 (0.64%) Virtual Servers
9 2 (0.43%) SRDF
9 2 (0.43%) Veritas Cluster Server
9 2 (0.43%) Virtual Desktop
9 2 (0.43%) Xen
10 1 (0.21%) VMware NSX
10 1 (0.21%) vSphere
10 1 (0.21%) XenApp
Systems Management
1 14 (2.99%) Single Sign-On
2 13 (2.77%) Ansible
2 13 (2.77%) Kubernetes
3 11 (2.35%) Functional Safety
3 11 (2.35%) Terraform
4 7 (1.49%) FortiGate
5 6 (1.28%) Active Directory Federation Services
5 6 (1.28%) Microsoft Intune
5 6 (1.28%) WSUS
6 5 (1.07%) ZABBIX
7 4 (0.85%) Puppet
7 4 (0.85%) SCCM
8 2 (0.43%) Grafana
8 2 (0.43%) Iperf
8 2 (0.43%) Nagios
8 2 (0.43%) Podman
8 2 (0.43%) Prometheus
8 2 (0.43%) Proxmox
8 2 (0.43%) SCOM
9 1 (0.21%) cPanel
Vendors
1 99 (21.11%) Microsoft
2 75 (15.99%) VMware
3 67 (14.29%) Cisco
4 31 (6.61%) Juniper
5 27 (5.76%) Dell
6 25 (5.33%) YouTube
7 18 (3.84%) Citrix
7 18 (3.84%) Meraki
7 18 (3.84%) Oracle
8 17 (3.62%) Qualys
8 17 (3.62%) Tenable
9 15 (3.20%) Fortinet
10 14 (2.99%) Databricks
11 12 (2.56%) Siemens
12 11 (2.35%) AVEVA
12 11 (2.35%) Palo Alto
12 11 (2.35%) Rockwell
13 10 (2.13%) McAfee
14 9 (1.92%) F5
14 9 (1.92%) Intel