Local Government Jobs in the UK excluding London

Local Government (Local Authority, Local Council)
UK > UK excluding London

The table below looks at the prevalence of the term Local Government in permanent job vacancies advertised in the UK excluding London. Included is a benchmarking guide to the salaries offered in vacancies that have cited Local Government over the 6 months to 27 April 2024 with a comparison to the same period over the previous 2 years.

6 months to
27 Apr 2024
Same period 2023 Same period 2022
Rank 306 291 379
Rank change year-on-year -15 +88 +66
Permanent jobs citing Local Government 592 693 612
As % of all permanent jobs advertised in the UK excluding London 0.85% 1.12% 0.87%
As % of the General category 1.47% 1.62% 1.45%
Number of salaries quoted 414 276 291
10th Percentile £25,150 £30,165 £27,500
25th Percentile £31,274 £36,483 £37,171
Median annual salary (50th Percentile) £39,000 £44,238 £42,074
Median % change year-on-year -11.84% +5.14% -0.07%
75th Percentile £48,398 £60,625 £52,293
90th Percentile £65,000 £73,751 £65,000
UK median annual salary £39,882 £50,874 £44,602
% change year-on-year -21.61% +14.06% -0.89%

All General Skills
UK excluding London

Local Government is in the General Skills category. The following table is for comparison with the above and provides summary statistics for all permanent job vacancies advertised in the UK excluding London with a requirement for common skills.

Permanent vacancies with a requirement for common skills 40,269 42,823 42,101
As % of all permanent jobs advertised in the UK excluding London 57.49% 69.30% 59.64%
Number of salaries quoted 26,334 19,314 24,106
10th Percentile £26,000 £28,500 £28,216
25th Percentile £32,500 £37,500 £37,500
Median annual salary (50th Percentile) £47,500 £52,500 £50,000
Median % change year-on-year -9.52% +5.00% +5.26%
75th Percentile £62,500 £67,500 £65,000
90th Percentile £75,750 £82,500 £78,575
UK median annual salary £52,500 £60,000 £60,000
% change year-on-year -12.50% - +9.09%

Local Government
Job Vacancy Trend in the UK excluding London

Job postings citing Local Government as a proportion of all IT jobs advertised in the UK excluding London.
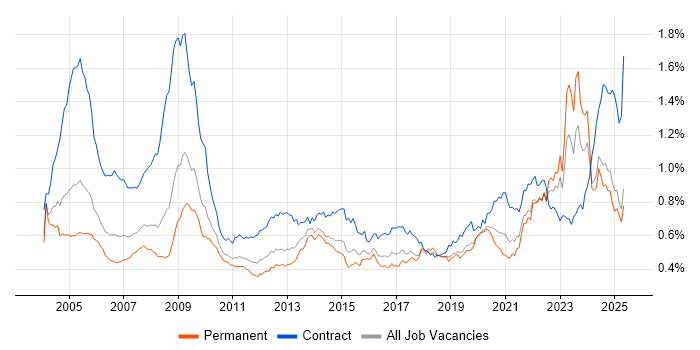
Job vacancy trend for Local Government in the UK excluding London

Local Government
Salary Trend in the UK excluding London

3-month moving average salary quoted in jobs citing Local Government in the UK excluding London.

Salary trend for Local Government in the UK excluding London

Local Government
Salary Histogram in the UK excluding London

Salary distribution for jobs citing Local Government in the UK excluding London over the 6 months to 27 April 2024.

Salary histogram for Local Government in the UK excluding London

Local Government
Job Locations in the UK excluding London

The table below looks at the demand and provides a guide to the median salaries quoted in IT jobs citing Local Government within the UK excluding London region over the 6 months to 27 April 2024. The 'Rank Change' column provides an indication of the change in demand within each location based on the same 6 month period last year.

Location Rank Change
on Same Period
Last Year
Matching
Permanent
IT Job Ads
Median Salary
Past 6 Months
Median Salary
% Change
on Same Period
Last Year
Live
Jobs
North of England -38 160 £33,911 -14.15% 62
Midlands +4 142 £37,133 -38.11% 58
South East +87 120 £40,400 -24.49% 83
West Midlands +50 107 £34,998 -49.56% 31
North West -3 88 £33,250 -24.47% 32
South West +13 61 £39,882 -9.36% 48
East of England +15 55 £46,297 -0.44% 41
Yorkshire +2 55 £33,911 -11.07% 24
Wales +24 41 £36,476 -16.45% 15
East Midlands -45 35 £37,500 -16.67% 27
North East -16 17 £38,750 +8.74% 6
Scotland -103 14 £42,500 -15.00% 19
Local Government
UK

Local Government
Co-occurring Skills and Capabilities in the UK excluding London by Category

The follow tables expand on the table above by listing co-occurrences grouped by category. The same employment type, locality and period is covered with up to 20 co-occurrences shown in each of the following categories:

Application Platforms
1 20 (3.38%) SharePoint
2 17 (2.87%) Microsoft Exchange
3 12 (2.03%) Apache
4 9 (1.52%) ArcGIS
4 9 (1.52%) IIS
5 8 (1.35%) Tomcat
6 3 (0.51%) Totara
7 1 (0.17%) Confluence
7 1 (0.17%) Drupal
Applications
1 52 (8.78%) AutoCAD
2 42 (7.09%) Microsoft Office
3 38 (6.42%) Microsoft Excel
4 9 (1.52%) Revit
5 2 (0.34%) Microsoft PowerPoint
6 1 (0.17%) Acrobat
6 1 (0.17%) Chatbot
6 1 (0.17%) Microsoft Project
6 1 (0.17%) Photoshop
Business Applications
1 40 (6.76%) NEC Housing
2 1 (0.17%) Primavera
Cloud Services
1 61 (10.30%) Microsoft 365
2 43 (7.26%) Azure
3 42 (7.09%) Power Platform
4 24 (4.05%) Entra ID
5 21 (3.55%) SaaS
6 7 (1.18%) AWS
6 7 (1.18%) Cloud Computing
7 6 (1.01%) Power Automate
8 5 (0.84%) Azure Monitor
9 3 (0.51%) OCI
9 3 (0.51%) OneDrive
9 3 (0.51%) Smartsheet
10 2 (0.34%) Dynamics 365
10 2 (0.34%) PowerApps
11 1 (0.17%) Amazon ELB
11 1 (0.17%) Azure DevOps
11 1 (0.17%) ChatGPT
11 1 (0.17%) GitHub
11 1 (0.17%) Google Workspace
11 1 (0.17%) WhatsApp
Communications & Networking
1 20 (3.38%) Firewall
2 15 (2.53%) Wi-Fi
3 14 (2.36%) LAN
3 14 (2.36%) Wireless
4 12 (2.03%) Internet
5 11 (1.86%) MPLS
6 10 (1.69%) VPN
7 9 (1.52%) Network Security
8 8 (1.35%) DNS
8 8 (1.35%) WAN
9 7 (1.18%) SMS
10 6 (1.01%) Intranet
10 6 (1.01%) SAN
10 6 (1.01%) SD-WAN
10 6 (1.01%) Unified Communications
11 5 (0.84%) Extranet
11 5 (0.84%) VLAN
11 5 (0.84%) WLAN
12 4 (0.68%) TETRA
13 3 (0.51%) Broadband
Database & Business Intelligence
1 34 (5.74%) SQL Server
2 29 (4.90%) Power BI
3 22 (3.72%) GIS
4 21 (3.55%) Oracle Database
5 16 (2.70%) PostgreSQL
6 14 (2.36%) Relational Database
7 10 (1.69%) RDBMS
8 9 (1.52%) Spatial Data
9 8 (1.35%) Geospatial Data
9 8 (1.35%) Oracle Database 12c
10 5 (0.84%) Tableau
11 4 (0.68%) Data Warehouse
11 4 (0.68%) Triplestore
12 3 (0.51%) EDMS
12 3 (0.51%) MS Access
12 3 (0.51%) SQL Server Reporting Services
13 2 (0.34%) Data Mining
13 2 (0.34%) QlikView
14 1 (0.17%) Amazon RDS
14 1 (0.17%) Redis
Development Applications
1 5 (0.84%) Oracle APEX
2 4 (0.68%) Git
3 3 (0.51%) Oracle Forms
4 1 (0.17%) JIRA
4 1 (0.17%) RSpec
General
1 189 (31.93%) Social Skills
2 165 (27.87%) Finance
3 154 (26.01%) Inclusion and Diversity
4 109 (18.41%) Public Sector
5 81 (13.68%) Legal
6 62 (10.47%) Police
7 49 (8.28%) Presentation Skills
8 48 (8.11%) Telecoms
9 40 (6.76%) Analytical Skills
10 39 (6.59%) Retail
11 32 (5.41%) Billing
12 30 (5.07%) Back Office
13 29 (4.90%) Fire and Rescue
14 26 (4.39%) Organisational Skills
15 22 (3.72%) Marketing
16 7 (1.18%) Social Housing
17 6 (1.01%) Environmental Health
17 6 (1.01%) Games
18 5 (0.84%) Influencing Skills
18 5 (0.84%) Publishing
Job Titles
1 74 (12.50%) Senior
2 60 (10.14%) Analyst
3 44 (7.43%) Coordinator
4 43 (7.26%) Project Manager
5 37 (6.25%) Technical Coordinator
6 36 (6.08%) Lead
7 32 (5.41%) Audit Manager
8 26 (4.39%) IT Technician
9 20 (3.38%) Development Manager
10 19 (3.21%) Administrator
11 16 (2.70%) Technical Manager
12 15 (2.53%) Business Manager
12 15 (2.53%) Data Analyst
12 15 (2.53%) Developer
12 15 (2.53%) ICT Engineer
12 15 (2.53%) Team Leader
13 13 (2.20%) Business Development Manager
14 12 (2.03%) Applications Support
14 12 (2.03%) IT Manager
14 12 (2.03%) Support Technician
Libraries, Frameworks & Software Standards
1 14 (2.36%) Web Services
2 11 (1.86%) .NET
3 7 (1.18%) CSS
3 7 (1.18%) HTML
4 6 (1.01%) JSON
4 6 (1.01%) Ruby on Rails
4 6 (1.01%) XML
5 5 (0.84%) REST
5 5 (0.84%) RESTful
5 5 (0.84%) SOAP
6 3 (0.51%) EDI
7 1 (0.17%) ASP.NET
7 1 (0.17%) Core Animation
7 1 (0.17%) jQuery
7 1 (0.17%) Laravel
7 1 (0.17%) Node.js
7 1 (0.17%) Oracle Fusion
7 1 (0.17%) React
7 1 (0.17%) React Native
7 1 (0.17%) Sidekiq
Miscellaneous
1 77 (13.01%) Housing Association
2 48 (8.11%) NHS
3 39 (6.59%) Driving Licence
4 38 (6.42%) Management Information System
5 30 (5.07%) Onboarding
6 29 (4.90%) Self-Motivation
7 20 (3.38%) CCTV
7 20 (3.38%) Renewable Energy
8 16 (2.70%) Data Centre
9 12 (2.03%) PACS
9 12 (2.03%) Smartcard
10 11 (1.86%) Educational Technology
11 10 (1.69%) Data Structures
12 9 (1.52%) Blog
12 9 (1.52%) Public Cloud
13 8 (1.35%) Acoustics
14 7 (1.18%) Social Media
15 6 (1.01%) Freedom of Information
15 6 (1.01%) IoT
15 6 (1.01%) Smartphone
Operating Systems
1 33 (5.57%) Windows
2 21 (3.55%) Unix
3 15 (2.53%) Linux
4 9 (1.52%) Solaris
4 9 (1.52%) Windows 10
5 6 (1.01%) Android
6 2 (0.34%) Apple iOS
6 2 (0.34%) Windows 7
6 2 (0.34%) Windows 8
6 2 (0.34%) Windows Server
7 1 (0.17%) VMS
Processes & Methodologies
1 119 (20.10%) Agile
2 97 (16.39%) Problem-Solving
3 91 (15.37%) Project Management
4 87 (14.70%) Customer Service
5 61 (10.30%) Business Development
6 57 (9.63%) Mathematics
6 57 (9.63%) Time Management
7 54 (9.12%) Coaching
8 52 (8.78%) Continuous Improvement
8 52 (8.78%) Service Management
9 48 (8.11%) Performance Management
10 38 (6.42%) People Management
11 35 (5.91%) Business Intelligence
11 35 (5.91%) Project Delivery
12 30 (5.07%) Data Analysis
13 29 (4.90%) ITIL
14 28 (4.73%) Line Management
15 27 (4.56%) Service Delivery
16 24 (4.05%) Change Management
16 24 (4.05%) Mentoring
Programming Languages
1 49 (8.28%) SQL
2 17 (2.87%) Python
3 13 (2.20%) C#
4 10 (1.69%) Java
4 10 (1.69%) JavaScript
5 8 (1.35%) Shell Script
6 7 (1.18%) Ruby
7 5 (0.84%) PL/SQL
8 4 (0.68%) SPARQL
9 3 (0.51%) R
10 2 (0.34%) C
11 1 (0.17%) Kotlin
11 1 (0.17%) Objective-C
11 1 (0.17%) PHP
11 1 (0.17%) PowerShell
11 1 (0.17%) Swift
11 1 (0.17%) T-SQL
11 1 (0.17%) TypeScript
11 1 (0.17%) VB.NET
Qualifications
1 126 (21.28%) Degree
2 54 (9.12%) HND
3 48 (8.11%) HNC
4 40 (6.76%) Security Cleared
5 38 (6.42%) DBS Check
6 32 (5.41%) ACCA
7 15 (2.53%) SC Cleared
8 12 (2.03%) A+ Certification
9 11 (1.86%) Network+ Certification
10 10 (1.69%) Microsoft Certification
11 9 (1.52%) Cisco Certification
12 8 (1.35%) Oracle Certification
13 6 (1.01%) MCP
14 5 (0.84%) Azure Certification
14 5 (0.84%) Master's Degree
15 4 (0.68%) Chartered Engineer
16 3 (0.51%) CCNP
16 3 (0.51%) Six Sigma Green Belt
17 2 (0.34%) CCIE
17 2 (0.34%) PhD
Quality Assurance & Compliance
1 32 (5.41%) GAAP
1 32 (5.41%) IFRS
2 26 (4.39%) Accessibility
3 16 (2.70%) QA
4 14 (2.36%) Data Quality
5 8 (1.35%) Cyber Essentials
6 7 (1.18%) NEBOSH
6 7 (1.18%) SLA
7 6 (1.01%) Cyber Essentials PLUS
8 4 (0.68%) ISO/IEC 27001
8 4 (0.68%) PMO
9 3 (0.51%) ISO 9001
9 3 (0.51%) NIST
10 2 (0.34%) Actionable Recommendations
10 2 (0.34%) GDPR
10 2 (0.34%) GPG for Computer-Based Electronic Evidence
10 2 (0.34%) ISO/IEC 17025
11 1 (0.17%) ISO 14001
11 1 (0.17%) NCSC
11 1 (0.17%) RMADS
System Software
1 30 (5.07%) Active Directory
2 8 (1.35%) VMware Infrastructure
3 6 (1.01%) Docker
3 6 (1.01%) Virtual Machines
4 3 (0.51%) Hyper-V
4 3 (0.51%) Microsoft Virtual Server
4 3 (0.51%) Virtual Desktop
4 3 (0.51%) Virtual Servers
4 3 (0.51%) VMware ESXi
4 3 (0.51%) vSphere
Systems Management
1 19 (3.21%) Microsoft Intune
2 5 (0.84%) SCCM
2 5 (0.84%) SCOM
3 4 (0.68%) AirWatch
3 4 (0.68%) Kubernetes
4 3 (0.51%) Active Directory Federation Services
5 1 (0.17%) Terraform
Vendors
1 156 (26.35%) Microsoft
2 41 (6.93%) NEC
3 35 (5.91%) CA
4 29 (4.90%) Oracle
5 15 (2.53%) Cisco
6 13 (2.20%) VMware
7 11 (1.86%) Openreach
8 9 (1.52%) SAP
9 6 (1.01%) BT
9 6 (1.01%) Citrix
10 5 (0.84%) ESRI
10 5 (0.84%) HP
10 5 (0.84%) NetApp
10 5 (0.84%) Northgate
11 4 (0.68%) HubSpot
12 3 (0.51%) Civica
12 3 (0.51%) SolarWinds
13 2 (0.34%) Liquidlogic
14 1 (0.17%) Databricks
14 1 (0.17%) Samsung