Technical Leadership Jobs in the UK excluding London

Technical Leadership
UK > UK excluding London

The table below provides summary statistics for permanent job vacancies advertised in the UK excluding London requiring Technical Leadership skills. It includes a benchmarking guide to the annual salaries offered in vacancies that cited Technical Leadership over the 6 months leading up to 26 July 2024, comparing them to the same period in the previous two years.

6 months to
26 Jul 2024
Same period 2023 Same period 2022
Rank 189 218 211
Rank change year-on-year +29 -7 +1
Permanent jobs citing Technical Leadership 886 783 1,406
As % of all permanent jobs advertised in the UK excluding London 1.36% 1.63% 1.80%
As % of the Processes & Methodologies category 1.70% 1.70% 1.88%
Number of salaries quoted 576 482 815
10th Percentile £46,250 £43,125 £43,075
25th Percentile £57,500 £55,000 £52,111
Median annual salary (50th Percentile) £67,500 £65,000 £65,000
Median % change year-on-year +3.85% - +8.33%
75th Percentile £80,000 £80,000 £80,000
90th Percentile £92,500 £96,539 £92,500
UK median annual salary £72,000 £75,000 £75,000
% change year-on-year -4.00% - +7.14%

All Process and Methodology Skills
UK excluding London

Technical Leadership falls under the Processes and Methodologies category. For comparison with the information above, the following table provides summary statistics for all permanent job vacancies requiring process or methodology skills in the UK excluding London.

Permanent vacancies with a requirement for process or methodology skills 51,975 45,995 74,754
As % of all permanent jobs advertised in the UK excluding London 79.63% 95.53% 95.46%
Number of salaries quoted 33,355 26,900 43,045
10th Percentile £28,371 £30,500 £30,076
25th Percentile £37,500 £40,000 £39,000
Median annual salary (50th Percentile) £50,000 £55,000 £52,500
Median % change year-on-year -9.09% +4.76% +6.06%
75th Percentile £65,000 £69,500 £67,500
90th Percentile £80,000 £82,050 £81,250
UK median annual salary £55,000 £60,000 £60,000
% change year-on-year -8.33% - +9.09%

Technical Leadership
Job Vacancy Trend in the UK excluding London

Job postings citing Technical Leadership as a proportion of all IT jobs advertised in the UK excluding London.
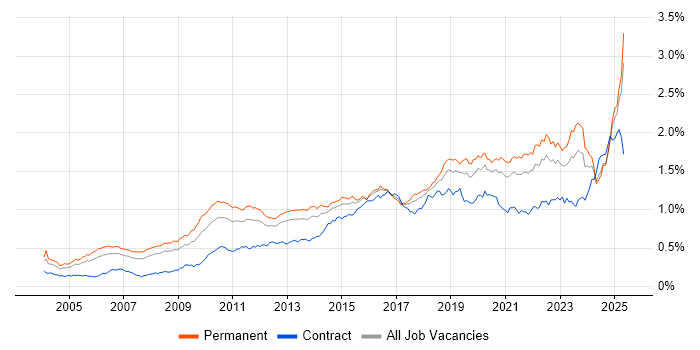
Job vacancy trend for Technical Leadership in the UK excluding London

Technical Leadership
Salary Trend in the UK excluding London

3-month moving average salary quoted in jobs citing Technical Leadership in the UK excluding London.

Salary trend for Technical Leadership in the UK excluding London

Technical Leadership
Salary Histogram in the UK excluding London

Salary distribution for jobs citing Technical Leadership in the UK excluding London over the 6 months to 26 July 2024.

Salary histogram for Technical Leadership in the UK excluding London

Technical Leadership
Job Locations in the UK excluding London

The table below looks at the demand and provides a guide to the median salaries quoted in IT jobs citing Technical Leadership within the UK excluding London region over the 6 months to 26 July 2024. The 'Rank Change' column provides an indication of the change in demand within each location based on the same 6 month period last year.

Location Rank Change
on Same Period
Last Year
Matching
Permanent
IT Job Ads
Median Salary
Past 6 Months
Median Salary
% Change
on Same Period
Last Year
Live
Jobs
North of England +29 218 £69,250 +6.54% 34
South East +55 216 £67,500 +3.85% 36
South West +14 151 £67,500 -3.57% 28
North West +28 128 £72,000 +6.67% 21
Midlands -26 115 £70,000 +7.69% 17
Scotland -36 85 £75,000 -0.73% 17
West Midlands -17 82 £70,000 +12.00% 12
East of England -19 69 £65,000 -3.70% 17
Yorkshire +32 66 £62,690 -3.55% 8
East Midlands -16 33 £70,000 +3.70% 5
North East +4 24 £65,465 +8.00% 7
Northern Ireland +15 17 £70,000 +16.67% 14
Wales +27 15 £70,000 +24.18% 2
Technical Leadership
UK

Technical Leadership
Co-occurring Skills and Capabilities in the UK excluding London by Category

The follow tables expand on the table above by listing co-occurrences grouped by category. The same employment type, locality and period is covered with up to 20 co-occurrences shown in each of the following categories:

Application Platforms
1 39 (4.40%) Apache Spark
2 34 (3.84%) CMS
3 29 (3.27%) IIS
4 28 (3.16%) Sitecore CMS
5 27 (3.05%) Kentico
5 27 (3.05%) SharePoint
5 27 (3.05%) Umbraco
6 26 (2.93%) Headless CMS
7 10 (1.13%) OpenStack
8 9 (1.02%) Microsoft Exchange
8 9 (1.02%) SAS
9 8 (0.90%) Apache
10 4 (0.45%) Apache Solr
10 4 (0.45%) ArcGIS
11 3 (0.34%) Oracle Workflow
11 3 (0.34%) WebSphere
11 3 (0.34%) WebSphere Application Server
12 2 (0.23%) Apache Airflow
12 2 (0.23%) Drupal
13 1 (0.11%) Appian
Applications
1 18 (2.03%) Microsoft Office
2 4 (0.45%) AutoCAD
2 4 (0.45%) Simulink
3 3 (0.34%) Microsoft Excel
3 3 (0.34%) Oracle Smart View
4 1 (0.11%) Microsoft PowerPoint
4 1 (0.11%) Microsoft Project
Business Applications
1 16 (1.81%) Dynamics CRM
2 3 (0.34%) HFM
2 3 (0.34%) Hyperion Planning
3 1 (0.11%) Dynamics NAV
3 1 (0.11%) NetSuite
3 1 (0.11%) Salesforce CRM
3 1 (0.11%) SAP HCM
3 1 (0.11%) SAP S/4HANA
Cloud Services
1 229 (25.85%) Azure
2 167 (18.85%) AWS
3 54 (6.09%) Power Platform
4 51 (5.76%) Entra ID
5 50 (5.64%) Microsoft 365
6 46 (5.19%) SaaS
7 45 (5.08%) Azure DevOps
8 41 (4.63%) OneDrive
9 36 (4.06%) Dropbox
9 36 (4.06%) Google Drive
9 36 (4.06%) IaaS
10 33 (3.72%) dbt
11 31 (3.50%) Amazon S3
11 31 (3.50%) GCP
12 29 (3.27%) PowerApps
13 27 (3.05%) Amazon EC2
14 26 (2.93%) Dynamics 365
14 26 (2.93%) Kontent
14 26 (2.93%) Serverless
15 21 (2.37%) Power Automate
Communications & Networking
1 26 (2.93%) WAN
2 25 (2.82%) Firewall
3 18 (2.03%) DNS
4 15 (1.69%) SD-WAN
5 14 (1.58%) Network Security
5 14 (1.58%) VLAN
6 13 (1.47%) 5G
7 12 (1.35%) TCP/IP
7 12 (1.35%) VPN
8 11 (1.24%) LAN
8 11 (1.24%) Wireless
9 10 (1.13%) BGP
10 9 (1.02%) Intranet
11 8 (0.90%) SAN
12 7 (0.79%) SSL
12 7 (0.79%) Wireshark
13 6 (0.68%) IPsec
13 6 (0.68%) OSPF
13 6 (0.68%) Telepresence
13 6 (0.68%) Wi-Fi
Database & Business Intelligence
1 50 (5.64%) Big Data
2 44 (4.97%) NoSQL
3 31 (3.50%) Relational Database
4 30 (3.39%) MySQL
5 27 (3.05%) Amazon RDS
5 27 (3.05%) SQL Server
6 26 (2.93%) Data Warehouse
7 24 (2.71%) Power BI
8 23 (2.60%) RDBMS
9 21 (2.37%) Amazon Redshift
10 15 (1.69%) Data Lake
11 8 (0.90%) PostgreSQL
12 7 (0.79%) Hadoop
13 6 (0.68%) Metadata
14 5 (0.56%) MongoDB
14 5 (0.56%) SQL Server Reporting Services
15 4 (0.45%) BigQuery
15 4 (0.45%) DB2
15 4 (0.45%) Elasticsearch
16 3 (0.34%) Oracle Reports
Development Applications
1 51 (5.76%) Git
2 21 (2.37%) Postman
3 12 (1.35%) Visual Studio
4 11 (1.24%) GitLab
5 10 (1.13%) Jenkins
5 10 (1.13%) JIRA
6 9 (1.02%) Rational DOORS
7 8 (0.90%) CMake
7 8 (0.90%) Cypress.io
7 8 (0.90%) Subversion
8 7 (0.79%) Selenium
9 6 (0.68%) Gatling
9 6 (0.68%) JMeter
9 6 (0.68%) REST Assured
9 6 (0.68%) RStudio
10 4 (0.45%) MSBuild
10 4 (0.45%) Octopus Deploy
10 4 (0.45%) Team Foundation Server
10 4 (0.45%) webpack
11 3 (0.34%) SQL Server Management Studio (SSMS)
General
1 241 (27.20%) Social Skills
2 156 (17.61%) Finance
3 112 (12.64%) Analytical Skills
4 90 (10.16%) Inclusion and Diversity
5 56 (6.32%) Legal
6 52 (5.87%) Influencing Skills
7 50 (5.64%) Marketing
8 49 (5.53%) Banking
9 44 (4.97%) Law
10 31 (3.50%) Public Sector
11 26 (2.93%) Presentation Skills
12 24 (2.71%) Electronics
13 20 (2.26%) Organisational Skills
14 16 (1.81%) Aerospace
14 16 (1.81%) Retail
15 15 (1.69%) Automotive
15 15 (1.69%) Games
15 15 (1.69%) Manufacturing
16 11 (1.24%) Police
17 9 (1.02%) Aviation
Job Titles
1 299 (33.75%) Lead
2 219 (24.72%) Senior
3 156 (17.61%) Architect
4 145 (16.37%) Developer
5 86 (9.71%) Software Engineer
6 78 (8.80%) Technical Leader
7 77 (8.69%) Principal Engineer
8 76 (8.58%) Lead Developer
9 70 (7.90%) Cloud Engineer
10 60 (6.77%) Principal Cloud Engineer
11 51 (5.76%) Solutions Architect
12 50 (5.64%) Analyst
13 49 (5.53%) Senior Developer
14 47 (5.30%) Senior Analyst
15 44 (4.97%) Governance Analyst
16 41 (4.63%) Lead Software Engineer
17 37 (4.18%) Technical Architect
18 35 (3.95%) .NET Developer
19 34 (3.84%) C# Developer
20 33 (3.72%) Senior C# Developer
Libraries, Frameworks & Software Standards
1 94 (10.61%) .NET
2 82 (9.26%) React
3 55 (6.21%) Node.js
4 50 (5.64%) .NET Framework
5 49 (5.53%) RESTful
6 44 (4.97%) CSS
7 43 (4.85%) HTML
8 40 (4.51%) Django
9 38 (4.29%) ASP.NET
10 35 (3.95%) .NET Core
11 33 (3.72%) Spring
12 30 (3.39%) JSON
13 29 (3.27%) Next.js
14 27 (3.05%) ASP.NET MVC
15 25 (2.82%) Spring Boot
16 21 (2.37%) AngularJS
17 20 (2.26%) XML
18 12 (1.35%) Qt
19 11 (1.24%) Laravel
19 11 (1.24%) REST
Miscellaneous
1 88 (9.93%) Management Information System
2 80 (9.03%) Cloud Native
3 49 (5.53%) Product Ownership
4 46 (5.19%) Self-Motivation
5 39 (4.40%) IoT
6 36 (4.06%) iPad
7 34 (3.84%) Algorithms
8 18 (2.03%) Data Centre
8 18 (2.03%) Robotics
9 16 (1.81%) Hybrid Cloud
10 15 (1.69%) Mobile App
11 13 (1.47%) Distributed Systems
12 12 (1.35%) Greenfield Project
13 11 (1.24%) Public Cloud
14 10 (1.13%) Cyber Threat
14 10 (1.13%) Replication
15 9 (1.02%) Analytical Mindset
16 8 (0.90%) Data Structures
16 8 (0.90%) Life Science
16 8 (0.90%) Virtual Reality
Operating Systems
1 70 (7.90%) Windows
2 68 (7.67%) Linux
3 21 (2.37%) Windows Server
4 17 (1.92%) Unix
5 16 (1.81%) Apple iOS
6 15 (1.69%) Android
7 4 (0.45%) Embedded Linux
8 3 (0.34%) Red Hat Enterprise Linux
8 3 (0.34%) SUSE Linux Enterprise Server
8 3 (0.34%) Ubuntu
8 3 (0.34%) Windows 10
9 2 (0.23%) VMS
9 2 (0.23%) Windows Server 2016
10 1 (0.11%) zOS
Processes & Methodologies
1 325 (36.68%) Agile
2 234 (26.41%) Roadmaps
3 229 (25.85%) Mentoring
4 205 (23.14%) Software Engineering
5 201 (22.69%) Problem-Solving
6 193 (21.78%) DevOps
7 191 (21.56%) Coaching
8 137 (15.46%) CI/CD
9 115 (12.98%) Technology Roadmap
10 106 (11.96%) Cybersecurity
11 102 (11.51%) Computer Science
12 100 (11.29%) Project Management
13 93 (10.50%) SDLC
14 90 (10.16%) Continuous Integration
15 75 (8.47%) Continuous Improvement
16 74 (8.35%) Artificial Intelligence
17 71 (8.01%) Project Delivery
18 66 (7.45%) TDD
19 62 (7.00%) Information Security
20 61 (6.88%) Design Patterns
Programming Languages
1 175 (19.75%) Python
2 163 (18.40%) SQL
3 135 (15.24%) Java
4 116 (13.09%) JavaScript
5 106 (11.96%) C#
6 51 (5.76%) PowerShell
7 46 (5.19%) C++
8 45 (5.08%) PHP
9 43 (4.85%) C
10 41 (4.63%) Scala
11 28 (3.16%) TypeScript
12 20 (2.26%) Bash
13 17 (1.92%) R
14 15 (1.69%) Perl
15 12 (1.35%) Embedded C
15 12 (1.35%) Ruby
15 12 (1.35%) Swift
16 11 (1.24%) Kotlin
17 9 (1.02%) MATLAB
17 9 (1.02%) SystemVerilog
Qualifications
1 180 (20.32%) Degree
2 138 (15.58%) Security Cleared
3 95 (10.72%) SC Cleared
4 76 (8.58%) Computer Science Degree
5 26 (2.93%) Master's Degree
6 21 (2.37%) Microsoft Certification
7 19 (2.14%) Cisco Certification
8 18 (2.03%) BPSS Clearance
9 17 (1.92%) Azure Certification
10 12 (1.35%) CCNA
11 11 (1.24%) PMI Certification
12 9 (1.02%) AWS Certification
12 9 (1.02%) CISSP
12 9 (1.02%) DV Cleared
12 9 (1.02%) PhD
13 8 (0.90%) CCIE
14 7 (0.79%) CISM
14 7 (0.79%) TOGAF Certification
15 6 (0.68%) CCNP
16 5 (0.56%) Network+ Certification
Quality Assurance & Compliance
1 63 (7.11%) QA
2 27 (3.05%) Data Quality
3 20 (2.26%) GDPR
4 12 (1.35%) PMO
5 7 (0.79%) Accessibility
6 6 (0.68%) ISO 13485
6 6 (0.68%) SLA
7 5 (0.56%) Def Stans
7 5 (0.56%) NIST
8 4 (0.45%) IEC 61508
8 4 (0.45%) ISO/IEC 15288
8 4 (0.45%) PCI DSS
9 3 (0.34%) ISO/IEC 27001
9 3 (0.34%) JTAG
10 2 (0.23%) Automotive SPICE
10 2 (0.23%) COBIT
10 2 (0.23%) Cyber Essentials
10 2 (0.23%) Cyber Essentials PLUS
10 2 (0.23%) DO-254
10 2 (0.23%) ISO/IEC 12207
System Software
1 85 (9.59%) Active Directory
2 44 (4.97%) RACF
3 31 (3.50%) Docker
4 28 (3.16%) VMware Infrastructure
5 17 (1.92%) Firmware
6 16 (1.81%) Virtual Machines
7 8 (0.90%) Hyper-V
7 8 (0.90%) Lustre
7 8 (0.90%) Slurm Workload Manager
8 5 (0.56%) VMware ESXi
9 4 (0.45%) Virtual Servers
10 3 (0.34%) Ceph
10 3 (0.34%) GPFS
10 3 (0.34%) vSphere
11 1 (0.11%) Citrix Hypervisor
11 1 (0.11%) Embedded Firmware
11 1 (0.11%) VMware NSX
Systems Management
1 45 (5.08%) Kubernetes
2 44 (4.97%) Terraform
3 21 (2.37%) Ansible
4 12 (1.35%) Microsoft Intune
5 7 (0.79%) Single Sign-On
6 6 (0.68%) ServiceCenter
7 5 (0.56%) SCCM
8 4 (0.45%) Progress Chef
8 4 (0.45%) Puppet
9 3 (0.34%) CA Single Sign-On
9 3 (0.34%) Endace
9 3 (0.34%) NetIQ Identity Manager
9 3 (0.34%) Podman
9 3 (0.34%) vCenter Server
10 2 (0.23%) Functional Safety
10 2 (0.23%) Prometheus
10 2 (0.23%) ZABBIX
11 1 (0.11%) Icinga
11 1 (0.11%) Proxmox
Vendors
1 206 (23.25%) Microsoft
2 51 (5.76%) Google
3 44 (4.97%) CyberArk
4 30 (3.39%) VMware
5 28 (3.16%) Sitecore
6 26 (2.93%) Optimizely
7 20 (2.26%) Salesforce
8 18 (2.03%) Cisco
8 18 (2.03%) Databricks
9 15 (1.69%) ServiceNow
10 13 (1.47%) Oracle
11 11 (1.24%) Veeam
12 10 (1.13%) Cadence
13 9 (1.02%) Synopsys
14 8 (0.90%) HP
15 7 (0.79%) Juniper
16 6 (0.68%) Foundry
16 6 (0.68%) IBM
16 6 (0.68%) Informatica
16 6 (0.68%) SAP