Unix Jobs in the UK excluding London

Unix
UK > UK excluding London

The table below provides summary statistics for permanent job vacancies advertised in the UK excluding London requiring Unix skills. It includes a benchmarking guide to the annual salaries offered in vacancies that cited Unix over the 6 months leading up to 16 June 2025, comparing them to the same period in the previous two years.

6 months to
16 Jun 2025
Same period 2024 Same period 2023
Rank 345 289 193
Rank change year-on-year -56 -96 +24
Permanent jobs citing Unix 260 690 1,023
As % of all permanent jobs advertised in the UK excluding London 0.65% 0.85% 1.87%
As % of the Operating Systems category 5.15% 6.23% 11.03%
Number of salaries quoted 157 313 402
10th Percentile £27,000 £32,500 £34,875
25th Percentile £38,750 £40,808 £43,000
Median annual salary (50th Percentile) £55,000 £50,000 £57,500
Median % change year-on-year +10.00% -13.04% +9.52%
75th Percentile £77,500 £63,750 £70,000
90th Percentile £82,751 £74,750 £80,000
UK median annual salary £65,000 £58,000 £67,500
% change year-on-year +12.07% -14.07% +3.85%

All Operating Systems
UK excluding London

Unix falls under the Operating Systems category. For comparison with the information above, the following table provides summary statistics for all permanent job vacancies requiring operating system skills in the UK excluding London.

Permanent vacancies with a requirement for operating system skills 5,044 11,067 9,276
As % of all permanent jobs advertised in the UK excluding London 12.67% 13.66% 16.94%
Number of salaries quoted 3,066 8,241 5,884
10th Percentile £26,250 £25,500 £25,688
25th Percentile £31,250 £30,000 £31,250
Median annual salary (50th Percentile) £40,000 £42,500 £45,000
Median % change year-on-year -5.88% -5.56% -
75th Percentile £53,951 £57,500 £61,000
90th Percentile £70,000 £68,750 £72,850
UK median annual salary £45,000 £45,000 £52,500
% change year-on-year - -14.29% -

Unix
Job Vacancy Trend in the UK excluding London

Job postings citing Unix as a proportion of all IT jobs advertised in the UK excluding London.
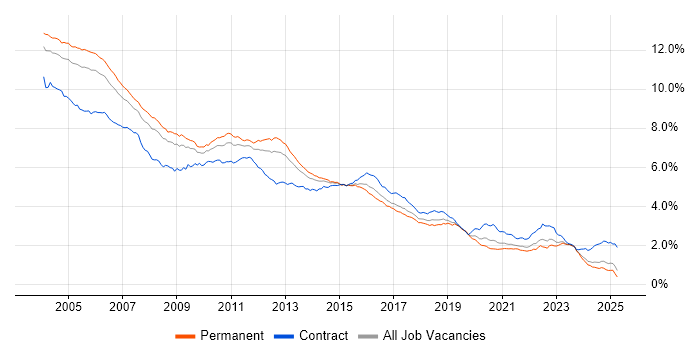
Job vacancy trend for Unix in the UK excluding London

Unix
Salary Trend in the UK excluding London

3-month moving average salary quoted in jobs citing Unix in the UK excluding London.

Salary trend for Unix in the UK excluding London

Unix
Salary Histogram in the UK excluding London

Salary distribution for jobs citing Unix in the UK excluding London over the 6 months to 16 June 2025.

Salary histogram for Unix in the UK excluding London

Unix
Job Locations in the UK excluding London

The table below looks at the demand and provides a guide to the median salaries quoted in IT jobs citing Unix within the UK excluding London region over the 6 months to 16 June 2025. The 'Rank Change' column provides an indication of the change in demand within each location based on the same 6 month period last year.

Location Rank Change
on Same Period
Last Year
Matching
Permanent
IT Job Ads
Median Salary
Past 6 Months
Median Salary
% Change
on Same Period
Last Year
Live
Jobs
South East +45 87 £41,500 -20.95% 364
North of England -24 40 £66,313 +33.60% 268
East of England +50 37 £27,500 -46.60% 177
Midlands +45 30 £63,750 +27.50% 185
West Midlands +59 27 £62,500 +8.26% 110
Scotland -24 27 £57,500 +36.90% 108
Wales +21 25 £77,500 +72.22% 50
North West -28 24 £69,384 +32.16% 124
South West +48 13 £69,405 +32.20% 139
North East +36 8 £60,000 +27.29% 23
Yorkshire +35 8 £62,500 +78.57% 121
East Midlands +28 3 £70,000 +40.00% 75
Northern Ireland +29 2 - - 47
Unix
UK

Unix
Co-occurring Skills and Capabilities in the UK excluding London by Category

The follow tables expand on the table above by listing co-occurrences grouped by category. The same employment type, locality and period is covered with up to 20 co-occurrences shown in each of the following categories:

Application Platforms
1 15 (5.77%) Apache Spark
2 13 (5.00%) Apache
2 13 (5.00%) IIS
3 12 (4.62%) SharePoint
4 11 (4.23%) Apache Airflow
5 9 (3.46%) Tomcat
6 7 (2.69%) Microsoft Exchange
7 4 (1.54%) GemFire
8 3 (1.15%) SAS
9 2 (0.77%) WebSphere
10 1 (0.38%) Confluence
10 1 (0.38%) OpenStack
10 1 (0.38%) Oracle SOA Suite
Applications
1 17 (6.54%) Microsoft Office
Business Applications
1 6 (2.31%) Oracle EBS
2 5 (1.92%) Oracle Applications
3 1 (0.38%) Oracle Payables
Cloud Services
1 110 (42.31%) AWS
2 75 (28.85%) Azure
3 73 (28.08%) Pulumi
4 24 (9.23%) GCP
5 21 (8.08%) Microsoft 365
6 13 (5.00%) Entra ID
7 9 (3.46%) Apigee
7 9 (3.46%) Cloud Computing
7 9 (3.46%) Google Kubernetes Engine
7 9 (3.46%) Microsoft Copilot
7 9 (3.46%) Power Automate
8 8 (3.08%) Amazon ECR
8 8 (3.08%) Amazon ECS
8 8 (3.08%) Amazon ElastiCache
8 8 (3.08%) Amazon OpenSearch
8 8 (3.08%) AWS CloudFormation
8 8 (3.08%) AWS CodeBuild
8 8 (3.08%) dbt
9 7 (2.69%) GitHub
10 6 (2.31%) OpenShift
Communications & Networking
1 65 (25.00%) Broadband
2 30 (11.54%) TCP/IP
3 22 (8.46%) Firewall
4 21 (8.08%) Network Security
5 18 (6.92%) DNS
6 16 (6.15%) DHCP
7 14 (5.38%) DMARC
7 14 (5.38%) SSL
8 12 (4.62%) VPN
9 11 (4.23%) Modbus
9 11 (4.23%) MQTT
10 5 (1.92%) DKIM
10 5 (1.92%) Wi-Fi
11 4 (1.54%) SAN
11 4 (1.54%) VLAN
12 3 (1.15%) 5G
12 3 (1.15%) PuTTY
12 3 (1.15%) SD-WAN
12 3 (1.15%) WAN
13 2 (0.77%) Internet
Database & Business Intelligence
1 92 (35.38%) NoSQL
2 88 (33.85%) RDBMS
2 88 (33.85%) Relational Database
3 40 (15.38%) PostgreSQL
4 24 (9.23%) SQL Server
5 14 (5.38%) Hadoop
6 12 (4.62%) Amazon RDS
6 12 (4.62%) Redis
7 11 (4.23%) Big Data
8 9 (3.46%) Apache Hive
8 9 (3.46%) Data Warehouse
8 9 (3.46%) HBase
8 9 (3.46%) Oracle Database
9 8 (3.08%) DB2
9 8 (3.08%) Elasticsearch
10 6 (2.31%) Apache Hudi
10 6 (2.31%) Apache Iceberg
10 6 (2.31%) Delta Lake
10 6 (2.31%) Oracle Exadata
10 6 (2.31%) Oracle Reports
Development Applications
1 65 (25.00%) Jaeger
2 21 (8.08%) Git
3 14 (5.38%) Maven
4 13 (5.00%) Jenkins
5 10 (3.85%) JUnit
6 9 (3.46%) SonarQube
6 9 (3.46%) Sonatype Nexus
7 6 (2.31%) Bitbucket
7 6 (2.31%) JIRA
8 5 (1.92%) Gradle
9 3 (1.15%) JMeter
9 3 (1.15%) LabVIEW
9 3 (1.15%) Oracle Forms
10 1 (0.38%) GitLab
10 1 (0.38%) IBM UrbanCode
10 1 (0.38%) Oracle APEX
10 1 (0.38%) SoapUI
10 1 (0.38%) Subversion
General
1 95 (36.54%) Social Skills
2 87 (33.46%) Inclusion and Diversity
3 36 (13.85%) Finance
4 26 (10.00%) Analytical Skills
5 15 (5.77%) Law
6 14 (5.38%) Banking
6 14 (5.38%) Presentation Skills
7 11 (4.23%) Front Office
8 9 (3.46%) Czech Language
8 9 (3.46%) Organisational Skills
9 7 (2.69%) Marketing
9 7 (2.69%) Public Sector
9 7 (2.69%) Telecoms
10 6 (2.31%) Billing
11 4 (1.54%) Electronics
12 3 (1.15%) Automotive
12 3 (1.15%) Retail
13 2 (0.77%) Advertising
13 2 (0.77%) Documentation Skills
14 1 (0.38%) Police
Job Titles
1 91 (35.00%) Lead
2 78 (30.00%) Team Leader
3 44 (16.92%) Senior
4 38 (14.62%) Software Engineer
5 28 (10.77%) Developer
6 18 (6.92%) IT Support
6 18 (6.92%) Senior Software Engineer
7 17 (6.54%) Analyst
7 17 (6.54%) Infrastructure Engineer
8 16 (6.15%) Administrator
9 13 (5.00%) Support Analyst
10 12 (4.62%) Java Engineer
11 11 (4.23%) Data Engineer
11 11 (4.23%) Java Developer
11 11 (4.23%) Lead Software Engineer
12 10 (3.85%) Software Developer
13 9 (3.46%) IT Administrator
13 9 (3.46%) Network Engineer
13 9 (3.46%) Senior Developer
14 8 (3.08%) Lead Developer
Libraries, Frameworks & Software Standards
1 65 (25.00%) Elastic Stack
1 65 (25.00%) OpenTelemetry
2 19 (7.31%) .NET
2 19 (7.31%) Spring
3 17 (6.54%) REST
4 15 (5.77%) Kafka
5 11 (4.23%) Middleware
5 11 (4.23%) RESTful
5 11 (4.23%) SOAP
6 10 (3.85%) JSON
6 10 (3.85%) PySpark
6 10 (3.85%) Spring Boot
7 9 (3.46%) Hibernate
7 9 (3.46%) XML
8 8 (3.08%) Django
9 6 (2.31%) Oracle Fusion
9 6 (2.31%) Oracle GoldenGate
9 6 (2.31%) PyArrow
10 5 (1.92%) JPA
11 4 (1.54%) RabbitMQ
Miscellaneous
1 20 (7.69%) IoT
2 17 (6.54%) Self-Motivation
3 15 (5.77%) Algorithms
4 11 (4.23%) Device Driver
5 9 (3.46%) Enterprise Software
6 7 (2.69%) Distributed Systems
6 7 (2.69%) Driving Licence
6 7 (2.69%) Linux Command Line
7 5 (1.92%) Data Centre
7 5 (1.92%) Data Structures
7 5 (1.92%) Legacy Systems
7 5 (1.92%) Self-Driving Car
8 4 (1.54%) Derivative
9 3 (1.15%) Credit Derivative
9 3 (1.15%) Enterprise Cloud
9 3 (1.15%) Equities
9 3 (1.15%) Fixed Income
9 3 (1.15%) Foreign Exchange (FX)
9 3 (1.15%) Onboarding
9 3 (1.15%) Product Ownership
Operating Systems
1 194 (74.62%) Linux
2 78 (30.00%) Windows
3 16 (6.15%) Windows Server
4 7 (2.69%) AIX
4 7 (2.69%) Mac OS
4 7 (2.69%) Solaris
5 5 (1.92%) VMS
6 4 (1.54%) Apple iOS
7 3 (1.15%) CentOS
7 3 (1.15%) zOS
8 2 (0.77%) Embedded Linux
9 1 (0.38%) Red Hat Enterprise Linux
9 1 (0.38%) Ubuntu
Processes & Methodologies
1 121 (46.54%) Agile
2 98 (37.69%) DevOps
3 91 (35.00%) Mentoring
4 87 (33.46%) Roadmaps
5 84 (32.31%) Problem-Solving
6 77 (29.62%) Continuous Integration
7 76 (29.23%) Infrastructure as Code
8 73 (28.08%) Containerisation
8 73 (28.08%) Task Automation
9 66 (25.38%) High Availability
9 66 (25.38%) Product Management
10 65 (25.00%) Budget Control
10 65 (25.00%) Cost Optimisation
10 65 (25.00%) GitOps
10 65 (25.00%) Performance Optimisation
10 65 (25.00%) Resource Management
11 51 (19.62%) CI/CD
11 51 (19.62%) Software Engineering
12 23 (8.85%) Full-Stack Development
12 23 (8.85%) Open Source
Programming Languages
1 119 (45.77%) Python
2 116 (44.62%) Java
3 97 (37.31%) SQL
4 88 (33.85%) Bash
5 87 (33.46%) JavaScript
6 76 (29.23%) Go
7 26 (10.00%) C++
8 25 (9.62%) PowerShell
9 24 (9.23%) C#
10 23 (8.85%) C
11 14 (5.38%) Shell Script
12 12 (4.62%) PL/SQL
13 10 (3.85%) Fortran
13 10 (3.85%) VBA
14 7 (2.69%) Perl
15 6 (2.31%) MATLAB
16 4 (1.54%) ABAP
17 3 (1.15%) Groovy
17 3 (1.15%) PHP
17 3 (1.15%) R
Qualifications
1 69 (26.54%) AWS Certification
2 26 (10.00%) Degree
3 24 (9.23%) Security Cleared
4 18 (6.92%) SC Cleared
5 12 (4.62%) DV Cleared
6 10 (3.85%) Master's Degree
6 10 (3.85%) PhD
7 7 (2.69%) Network+ Certification
8 6 (2.31%) Azure Certification
9 5 (1.92%) OCA
9 5 (1.92%) OCP
9 5 (1.92%) Oracle Certification
10 4 (1.54%) Microsoft Certification
11 3 (1.15%) HND
11 3 (1.15%) Numerate Degree
11 3 (1.15%) RHCE
12 2 (0.77%) Computer Science Degree
13 1 (0.38%) AWS Certified DevOps Engineer
13 1 (0.38%) AWS Certified SysOps Administrator
13 1 (0.38%) ITIL Certification
Quality Assurance & Compliance
1 14 (5.38%) Accessibility
2 13 (5.00%) ISO/IEC 27001
3 9 (3.46%) Data Quality
4 8 (3.08%) QA
5 5 (1.92%) Cyber Essentials
6 4 (1.54%) Cyber Essentials PLUS
7 3 (1.15%) Sarbanes-Oxley
8 1 (0.38%) NIST
8 1 (0.38%) Software Quality Assurance
System Software
1 91 (35.00%) Docker
2 27 (10.38%) Active Directory
3 15 (5.77%) HDFS
4 12 (4.62%) Firmware
4 12 (4.62%) Hyper-V
4 12 (4.62%) VMware Infrastructure
5 3 (1.15%) Apache Flume
6 2 (0.77%) Virtual Machines
7 1 (0.38%) Embedded Firmware
7 1 (0.38%) LXC
7 1 (0.38%) NFS
7 1 (0.38%) Samba
7 1 (0.38%) vCloud
7 1 (0.38%) VMware ESXi
7 1 (0.38%) vSphere
Systems Management
1 87 (33.46%) Kubernetes
2 86 (33.08%) Terraform
3 69 (26.54%) Ansible
4 65 (25.00%) Argo
4 65 (25.00%) Kustomize
4 65 (25.00%) Prometheus
5 26 (10.00%) Microsoft Intune
6 9 (3.46%) Istio
6 9 (3.46%) Single Sign-On
7 8 (3.08%) AWS Copilot
8 7 (2.69%) FortiGate
8 7 (2.69%) SCCM
9 6 (2.31%) Oracle RMAN
10 3 (1.15%) Grafana
10 3 (1.15%) Kibana
10 3 (1.15%) logstash
10 3 (1.15%) Oozie
11 1 (0.38%) PowerCLI
11 1 (0.38%) vCenter Server
11 1 (0.38%) vRealize
Vendors
1 74 (28.46%) Google
2 46 (17.69%) Microsoft
3 40 (15.38%) Oracle
4 16 (6.15%) VMware
5 10 (3.85%) Red Hat
6 9 (3.46%) Apple
7 8 (3.08%) Databricks
7 8 (3.08%) SAP
8 7 (2.69%) Cisco
8 7 (2.69%) Fortinet
9 5 (1.92%) Cloudera
9 5 (1.92%) Informatica
10 4 (1.54%) Solace
10 4 (1.54%) Sophos
10 4 (1.54%) Sybase
10 4 (1.54%) TIBCO
11 3 (1.15%) CyberArk
11 3 (1.15%) IBM
11 3 (1.15%) MicroStrategy
12 2 (0.77%) Veeam