Red Hat Enterprise Linux Jobs in the UK excluding London

Red Hat Enterprise Linux (RHEL)
UK > UK excluding London

The table below provides summary statistics for permanent job vacancies advertised in the UK excluding London requiring Red Hat Enterprise Linux skills. It includes a benchmarking guide to the annual salaries offered in vacancies that cited Red Hat Enterprise Linux over the 6 months leading up to 26 July 2024, comparing them to the same period in the previous two years.

6 months to
26 Jul 2024
Same period 2023 Same period 2022
Rank 436 446 505
Rank change year-on-year +10 +59 -113
Permanent jobs citing Red Hat Enterprise Linux 286 240 415
As % of all permanent jobs advertised in the UK excluding London 0.44% 0.50% 0.53%
As % of the Operating Systems category 3.24% 2.83% 2.91%
Number of salaries quoted 168 122 315
10th Percentile £37,500 £37,500 £36,250
25th Percentile £40,000 £41,250 £41,250
Median annual salary (50th Percentile) £52,500 £50,500 £50,500
Median % change year-on-year +3.96% - -6.48%
75th Percentile £65,000 £65,438 £61,250
90th Percentile £77,500 £71,175 £75,000
UK median annual salary £57,500 £63,000 £57,500
% change year-on-year -8.73% +9.57% -4.17%

All Operating Systems
UK excluding London

Red Hat Enterprise Linux falls under the Operating Systems category. For comparison with the information above, the following table provides summary statistics for all permanent job vacancies requiring operating system skills in the UK excluding London.

Permanent vacancies with a requirement for operating system skills 8,838 8,487 14,237
As % of all permanent jobs advertised in the UK excluding London 13.54% 17.63% 18.18%
Number of salaries quoted 6,376 5,618 9,333
10th Percentile £25,750 £26,000 £25,500
25th Percentile £31,250 £31,250 £31,250
Median annual salary (50th Percentile) £45,000 £45,000 £45,000
75th Percentile £57,500 £61,250 £60,000
90th Percentile £70,000 £74,250 £73,750
UK median annual salary £47,500 £52,500 £52,500
% change year-on-year -9.52% - +5.00%

Red Hat Enterprise Linux
Job Vacancy Trend in the UK excluding London

Job postings citing Red Hat Enterprise Linux as a proportion of all IT jobs advertised in the UK excluding London.
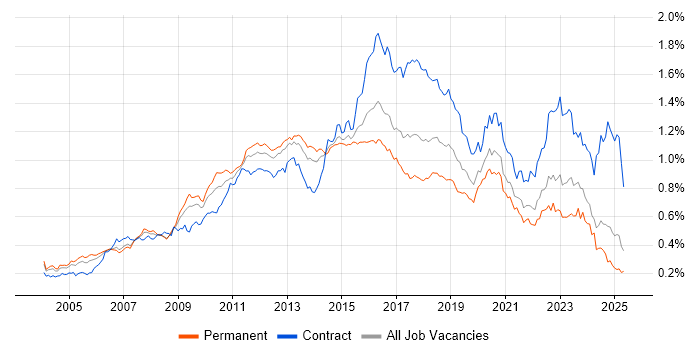
Job vacancy trend for Red Hat Enterprise Linux in the UK excluding London

Red Hat Enterprise Linux
Salary Trend in the UK excluding London

3-month moving average salary quoted in jobs citing Red Hat Enterprise Linux in the UK excluding London.

Salary trend for Red Hat Enterprise Linux in the UK excluding London

Red Hat Enterprise Linux
Salary Histogram in the UK excluding London

Salary distribution for jobs citing Red Hat Enterprise Linux in the UK excluding London over the 6 months to 26 July 2024.

Salary histogram for Red Hat Enterprise Linux in the UK excluding London

Red Hat Enterprise Linux
Job Locations in the UK excluding London

The table below looks at the demand and provides a guide to the median salaries quoted in IT jobs citing Red Hat Enterprise Linux within the UK excluding London region over the 6 months to 26 July 2024. The 'Rank Change' column provides an indication of the change in demand within each location based on the same 6 month period last year.

Location Rank Change
on Same Period
Last Year
Matching
Permanent
IT Job Ads
Median Salary
Past 6 Months
Median Salary
% Change
on Same Period
Last Year
Live
Jobs
South West +19 102 £55,000 - 9
South East 0 77 £45,000 - 9
North of England +38 56 £65,465 +0.44% 4
North West +4 30 £65,465 +0.71% 1
Yorkshire +72 23 £65,000 -10.34% 2
Midlands -15 19 £40,000 -25.58% 3
Scotland -49 13 £87,500 +33.89% 6
East Midlands -20 12 £40,000 -30.43%
Wales +36 8 £50,000 +26.58%
West Midlands -5 7 £65,465 +24.69% 3
East of England -14 7 £54,000 -2.70% 3
Northern Ireland - 4 - -
North East - 3 £65,465 - 1
Red Hat Enterprise Linux
UK

Red Hat Enterprise Linux
Co-occurring Skills and Capabilities in the UK excluding London by Category

The follow tables expand on the table above by listing co-occurrences grouped by category. The same employment type, locality and period is covered with up to 20 co-occurrences shown in each of the following categories:

Application Platforms
1 40 (13.99%) WebLogic
2 33 (11.54%) Apache
3 29 (10.14%) Apache Spark
4 11 (3.85%) Tuxedo
5 8 (2.80%) OpenStack
6 5 (1.75%) Microsoft Exchange
6 5 (1.75%) nginx
7 4 (1.40%) JBoss
8 3 (1.05%) CloudStack
9 1 (0.35%) Confluence
Applications
1 32 (11.19%) Simulink
Business Applications
1 40 (13.99%) Sparx Enterprise Architect
2 1 (0.35%) Remedy ITSM
Cloud Services
1 184 (64.34%) AWS
2 171 (59.79%) Azure
3 75 (26.22%) OpenShift
4 70 (24.48%) Amazon EKS
5 41 (14.34%) Amazon SQS
6 36 (12.59%) GCP
7 31 (10.84%) AWS Lambda
7 31 (10.84%) Serverless
8 30 (10.49%) AWS CloudFormation
9 29 (10.14%) SaaS
10 12 (4.20%) Microsoft 365
11 11 (3.85%) Amazon EC2
12 7 (2.45%) Cloud Computing
13 4 (1.40%) Datadog
14 3 (1.05%) Amazon S3
14 3 (1.05%) OCI
15 2 (0.70%) Route 53
16 1 (0.35%) AWS Fargate
16 1 (0.35%) GitHub
16 1 (0.35%) WhatsApp
Communications & Networking
1 80 (27.97%) DNS
2 70 (24.48%) TCP/IP
3 49 (17.13%) SSL
4 40 (13.99%) BGP
4 40 (13.99%) DHCP
5 33 (11.54%) HTTP
6 29 (10.14%) AMQP
7 12 (4.20%) SAN
8 11 (3.85%) LAN
8 11 (3.85%) WAN
9 7 (2.45%) Firewall
10 6 (2.10%) VSAN
10 6 (2.10%) VXLAN
11 5 (1.75%) Cisco Nexus
11 5 (1.75%) Ethernet VPN
11 5 (1.75%) NetScaler
12 4 (1.40%) Internet
12 4 (1.40%) Modbus
12 4 (1.40%) Remote Desktop
12 4 (1.40%) RTP
Database & Business Intelligence
1 50 (17.48%) Amazon RDS
2 40 (13.99%) Oracle Database
2 40 (13.99%) RDBMS
2 40 (13.99%) Relational Database
3 35 (12.24%) Big Data
4 34 (11.89%) NoSQL
5 32 (11.19%) Hadoop
6 29 (10.14%) Cloudera CDH
7 11 (3.85%) MySQL
8 9 (3.15%) SQL Server
9 7 (2.45%) MariaDB
9 7 (2.45%) PostgreSQL
10 6 (2.10%) InfluxDB
11 5 (1.75%) Elasticsearch
12 2 (0.70%) Redis
Development Applications
1 54 (18.88%) Git
2 37 (12.94%) Vagrant
3 17 (5.94%) Jenkins
4 6 (2.10%) GitLab
5 4 (1.40%) Bitbucket
6 3 (1.05%) JIRA
6 3 (1.05%) TeamCity
7 2 (0.70%) Artifactory
7 2 (0.70%) Cypress.io
7 2 (0.70%) Jasmine
7 2 (0.70%) Selenium
8 1 (0.35%) Rational DOORS
8 1 (0.35%) Robot Framework
8 1 (0.35%) Subversion
8 1 (0.35%) WebDriver
General
1 68 (23.78%) Social Skills
2 55 (19.23%) Aerospace
3 15 (5.24%) Public Sector
4 13 (4.55%) Tech for Good
5 11 (3.85%) Finance
6 10 (3.50%) Retail
7 8 (2.80%) Manufacturing
8 7 (2.45%) Telecoms
9 5 (1.75%) Analytical Skills
9 5 (1.75%) Documentation Skills
9 5 (1.75%) Organisational Skills
10 4 (1.40%) Presentation Skills
11 1 (0.35%) Automotive
11 1 (0.35%) Banking
11 1 (0.35%) Billing
11 1 (0.35%) Influencing Skills
11 1 (0.35%) Law
11 1 (0.35%) Police
Job Titles
1 78 (27.27%) Software Engineer
2 55 (19.23%) Infrastructure Engineer
3 43 (15.03%) Lead
3 43 (15.03%) Senior
4 41 (14.34%) Architect
4 41 (14.34%) Solutions Architect
5 40 (13.99%) Lead Architect
5 40 (13.99%) Lead Solutions Architect
6 32 (11.19%) SC Cleared Software Engineer
7 31 (10.84%) Administrator
8 29 (10.14%) DV Cleared Software Engineer
9 27 (9.44%) Senior Infrastructure Engineer
10 21 (7.34%) Linux Administrator
11 20 (6.99%) Systems Administrator
12 18 (6.29%) Platform Engineer
13 17 (5.94%) Cloud Engineer
14 16 (5.59%) AWS Engineer
14 16 (5.59%) Linux Engineer
14 16 (5.59%) Linux Systems Administrator
15 15 (5.24%) Cloud Platform Engineer
Libraries, Frameworks & Software Standards
1 71 (24.83%) RabbitMQ
2 69 (24.13%) Spring Boot
3 36 (12.59%) Middleware
4 33 (11.54%) React
5 31 (10.84%) AngularJS
6 30 (10.49%) Node.js
7 29 (10.14%) gRPC
7 29 (10.14%) Material-UI
7 29 (10.14%) OpenAPI
7 29 (10.14%) REST
7 29 (10.14%) Spring
7 29 (10.14%) Swagger
8 6 (2.10%) CSS
8 6 (2.10%) Keycloak
9 4 (1.40%) EDI
9 4 (1.40%) HTML
9 4 (1.40%) OAuth
9 4 (1.40%) OAuth2
9 4 (1.40%) OpenID
9 4 (1.40%) XMPP
Miscellaneous
1 42 (14.69%) Public Cloud
2 40 (13.99%) Enterprise Software
3 31 (10.84%) Data Centre
4 29 (10.14%) Cloud Native
5 22 (7.69%) Linux Command Line
6 16 (5.59%) Hybrid Cloud
7 12 (4.20%) Management Information System
8 9 (3.15%) PKI
9 5 (1.75%) Onboarding
10 4 (1.40%) Distributed Systems
10 4 (1.40%) Raspberry Pi
10 4 (1.40%) Self-Motivation
11 3 (1.05%) Algorithms
11 3 (1.05%) CUDA
11 3 (1.05%) Cyber Threat
11 3 (1.05%) Product Ownership
11 3 (1.05%) VAX
11 3 (1.05%) Wiki
12 2 (0.70%) Clustering
13 1 (0.35%) Data Protection Act
Operating Systems
1 286 (100.00%) Linux
2 104 (36.36%) Windows
3 103 (36.01%) CentOS
4 88 (30.77%) Ubuntu
5 41 (14.34%) Debian
6 34 (11.89%) Android
7 28 (9.79%) Windows Server
8 15 (5.24%) Windows Server 2016
9 12 (4.20%) Windows 10
10 10 (3.50%) Windows Server 2019
11 7 (2.45%) Unix
12 6 (2.10%) SUSE Linux Enterprise Server
12 6 (2.10%) Windows Server 2012
13 4 (1.40%) CoreOS
13 4 (1.40%) Rocky
13 4 (1.40%) SUSE
14 3 (1.05%) VMS
14 3 (1.05%) Windows 7
14 3 (1.05%) Windows Server 2008
15 2 (0.70%) Solaris
Processes & Methodologies
1 124 (43.36%) Collaborative Working
2 116 (40.56%) Agile
3 104 (36.36%) Open Source
4 92 (32.17%) Software Engineering
5 87 (30.42%) Infrastructure as Code
6 81 (28.32%) Actionable Insight
7 72 (25.17%) Kanban
7 72 (25.17%) Scrum
8 70 (24.48%) Configuration Management
9 64 (22.38%) Microservices
10 61 (21.33%) Infrastructure Engineering
11 57 (19.93%) DevOps
12 54 (18.88%) Containerisation
12 54 (18.88%) Load Balancing
13 50 (17.48%) Cloud Operations
14 49 (17.13%) Project Management
15 44 (15.38%) Computer Science
16 42 (14.69%) Migration
17 41 (14.34%) Artificial Intelligence
17 41 (14.34%) Systems Engineering
Programming Languages
1 167 (58.39%) Python
2 109 (38.11%) Java
3 67 (23.43%) JavaScript
4 64 (22.38%) Bash
5 55 (19.23%) PowerShell
6 47 (16.43%) SQL
7 41 (14.34%) C++
8 33 (11.54%) Kotlin
9 27 (9.44%) Perl
10 11 (3.85%) COBOL
10 11 (3.85%) Micro Focus COBOL
11 9 (3.15%) Shell Script
12 8 (2.80%) C
13 5 (1.75%) PHP
14 4 (1.40%) Go
15 3 (1.05%) C-shell
15 3 (1.05%) Fortran
16 2 (0.70%) TypeScript
16 2 (0.70%) VBScript
17 1 (0.35%) VB
Qualifications
1 171 (59.79%) Security Cleared
2 140 (48.95%) SC Cleared
3 84 (29.37%) DV Cleared
4 52 (18.18%) Degree
5 42 (14.69%) Computer Science Degree
6 40 (13.99%) AWS Certification
6 40 (13.99%) AWS Certified Solutions Architect
6 40 (13.99%) Azure Certification
7 15 (5.24%) CCNA
7 15 (5.24%) Cisco Certification
8 10 (3.50%) RHCSA
9 8 (2.80%) VMware Certified Professional (VCP)
10 5 (1.75%) A+ Certification
10 5 (1.75%) CCNP
10 5 (1.75%) Network+ Certification
10 5 (1.75%) RHCE
11 4 (1.40%) CTC Cleared
11 4 (1.40%) Master's Degree
12 3 (1.05%) BPSS Clearance
13 2 (0.70%) Microsoft Certification
Quality Assurance & Compliance
1 6 (2.10%) QA
2 5 (1.75%) SLA
3 1 (0.35%) Disclosure Scotland
3 1 (0.35%) NIST
System Software
1 67 (23.43%) Docker
1 67 (23.43%) VMware Infrastructure
2 36 (12.59%) Hyper-V
3 30 (10.49%) Active Directory
4 22 (7.69%) VMware ESXi
5 16 (5.59%) vSphere
6 7 (2.45%) VMware Server
7 6 (2.10%) Ceph
8 5 (1.75%) Citrix Hypervisor
8 5 (1.75%) Firmware
8 5 (1.75%) Virtual Desktop
8 5 (1.75%) Virtual Machines
8 5 (1.75%) XenDesktop
9 4 (1.40%) VMware NSX
10 3 (1.05%) Gluster
10 3 (1.05%) GPFS
10 3 (1.05%) KVM
10 3 (1.05%) Lustre
10 3 (1.05%) oVirt
10 3 (1.05%) Slurm Workload Manager
Systems Management
1 155 (54.20%) Ansible
2 110 (38.46%) Kubernetes
3 108 (37.76%) Puppet
4 100 (34.97%) Terraform
5 19 (6.64%) Progress Chef
6 15 (5.24%) Salt
7 12 (4.20%) Nagios
7 12 (4.20%) vCenter Server
8 9 (3.15%) Active Directory Federation Services
8 9 (3.15%) Podman
8 9 (3.15%) WSUS
9 7 (2.45%) SCCM
9 7 (2.45%) SCOM
10 6 (2.10%) Microsoft Data Protection Manager
11 5 (1.75%) EMC NetWorker
11 5 (1.75%) Failover Clustering
11 5 (1.75%) Grafana
11 5 (1.75%) Red Hat Spacewalk
12 4 (1.40%) Cacti
12 4 (1.40%) Single Sign-On
Vendors
1 116 (40.56%) Red Hat
2 77 (26.92%) VMware
3 52 (18.18%) Oracle
4 40 (13.99%) Sparx
5 39 (13.64%) Microsoft
6 33 (11.54%) Google
7 32 (11.19%) Xilinx
8 29 (10.14%) Cisco
8 29 (10.14%) SaltStack
9 11 (3.85%) Micro Focus
10 10 (3.50%) EMC
11 8 (2.80%) Citrix
11 8 (2.80%) Dell
12 6 (2.10%) Fortinet
12 6 (2.10%) Juniper
13 5 (1.75%) Atlassian
13 5 (1.75%) Veeam
14 4 (1.40%) New Relic
14 4 (1.40%) Splunk
15 3 (1.05%) CheckPoint