Infrastructure as Code Contracts with Hybrid/Remote/WFH Options

Infrastructure as Code (IaC, Infra as Code)
UK > Work from Home

The table below provides summary statistics for remote or hybrid contract work requiring Infrastructure as Code skills. It includes a benchmarking guide to the contractor rates offered in vacancies that cited Infrastructure as Code over the 6 months leading up to 1 May 2025, comparing them to the same period in the previous two years.

6 months to
1 May 2025
Same period 2024 Same period 2023
Rank 61 91 77
Rank change year-on-year +30 -14 +23
Contract jobs citing Infrastructure as Code 362 357 756
As % of all contract jobs with a WFH option 3.65% 2.33% 2.92%
As % of the Processes & Methodologies category 4.01% 2.65% 3.25%
Number of daily rates quoted 263 270 555
10th Percentile £400 £405 £450
25th Percentile £461 £463 £500
Median daily rate (50th Percentile) £550 £531 £600
Median % change year-on-year +3.68% -11.58% +4.35%
75th Percentile £643 £609 £675
90th Percentile £750 £688 £713
UK median daily rate £550 £550 £600
% change year-on-year - -8.33% -
Number of hourly rates quoted 7 3 6
10th Percentile £25.25 £55.25 £29.50
25th Percentile £26.19 £55.63 £51.38
Median hourly rate £65.00 £57.50 £55.00
Median % change year-on-year +13.04% +4.55% +37.50%
75th Percentile £82.50 £68.13 £78.88
90th Percentile £92.50 £73.75 £94.25
UK median hourly rate £65.00 £62.50 £78.00
% change year-on-year +4.00% -19.87% +60.97%

All Process and Methodology Skills
Work from Home

Infrastructure as Code falls under the Processes and Methodologies category. For comparison with the information above, the following table provides summary statistics for all contract job vacancies with remote or hybrid options requiring process or methodology skills.

Contract vacancies with a requirement for process or methodology skills 9,021 13,483 23,229
As % of all contract jobs with a WFH option 91.08% 87.87% 89.84%
Number of daily rates quoted 6,191 8,996 16,418
10th Percentile £340 £325 £363
25th Percentile £419 £425 £450
Median daily rate (50th Percentile) £525 £525 £540
Median % change year-on-year - -2.78% +2.86%
75th Percentile £638 £638 £650
90th Percentile £763 £750 £750
UK median daily rate £520 £525 £550
% change year-on-year -0.95% -4.55% +4.76%
Number of hourly rates quoted 224 579 532
10th Percentile £14.20 £15.17 £19.00
25th Percentile £19.56 £25.25 £30.54
Median hourly rate £39.52 £43.00 £55.00
Median % change year-on-year -8.09% -21.82% +57.14%
75th Percentile £66.13 £60.00 £68.75
90th Percentile £75.00 £75.25 £80.23
UK median hourly rate £29.00 £35.65 £37.30
% change year-on-year -18.65% -4.42% +49.20%

Infrastructure as Code
Trend for Jobs with a WFH Option

Job vacancies with remote working options citing Infrastructure as Code as a proportion of all IT jobs advertised.
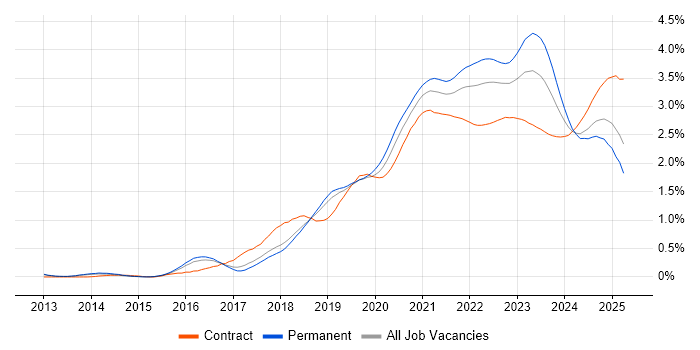
Infrastructure as Code trend for jobs with Hybrid/Remote/WFH options

Infrastructure as Code
Daily Rate Trend for Jobs with a WFH Option

3-month moving average daily rate quoted in job vacancies with remote working options citing Infrastructure as Code.

Infrastructure as Code daily rate for jobs with a WFH option

Infrastructure as Code
Daily Rate Histogram for Jobs with a WFH Option

Daily rate distribution for jobs with remote working options citing Infrastructure as Code over the 6 months to 1 May 2025.

Infrastructure as Code daily rate histogram for jobs with a WFH option

Infrastructure as Code
Hourly Rate Trend for Jobs with a WFH Option

3-month moving average hourly rate quoted in job vacancies with remote working options citing Infrastructure as Code.

Infrastructure as Code hourly rate for jobs with a WFH option

Infrastructure as Code
Hourly Rate Histogram for Jobs with a WFH Option

Hourly rate distribution for jobs with remote working options citing Infrastructure as Code over the 6 months to 1 May 2025.

Infrastructure as Code hourly rate histogram for jobs with a WFH option

Infrastructure as Code
Co-occurring Skills and Capabilities with WFH Options by Category

The follow tables expand on the table above by listing co-occurrences grouped by category. The same employment type, locality and period is covered with up to 20 co-occurrences shown in each of the following categories:

Application Platforms
1 10 (2.76%) Apache Spark
1 10 (2.76%) nginx
2 6 (1.66%) OpenStack
3 5 (1.38%) Confluence
3 5 (1.38%) Traefik
4 4 (1.10%) Apache Airflow
5 3 (0.83%) Apache
6 2 (0.55%) Anypoint
7 1 (0.28%) GeoServer
7 1 (0.28%) IIS
7 1 (0.28%) Jupyter
7 1 (0.28%) Mattermost
7 1 (0.28%) Microsoft Exchange
Applications
1 1 (0.28%) Chatbot
1 1 (0.28%) Notion
1 1 (0.28%) Trello
Business Applications
1 1 (0.28%) Distributed Ledger
1 1 (0.28%) Dynamics CRM
1 1 (0.28%) SAP IBP
1 1 (0.28%) SAP S/4HANA
Cloud Services
1 203 (56.08%) AWS
2 167 (46.13%) Azure
3 93 (25.69%) AWS CloudFormation
4 70 (19.34%) GitHub
5 68 (18.78%) Serverless
6 67 (18.51%) GCP
7 52 (14.36%) Azure DevOps
8 44 (12.15%) AWS Lambda
8 44 (12.15%) IaaS
9 43 (11.88%) PaaS
10 40 (11.05%) Amazon S3
11 37 (10.22%) SaaS
12 35 (9.67%) GitHub Actions
13 30 (8.29%) Amazon EKS
14 28 (7.73%) Amazon EC2
15 27 (7.46%) Amazon CloudWatch
16 25 (6.91%) Azure AKS
17 23 (6.35%) Azure Monitor
18 21 (5.80%) Entra ID
18 21 (5.80%) Virtual Private Cloud
Communications & Networking
1 62 (17.13%) DNS
2 55 (15.19%) Firewall
3 50 (13.81%) TCP/IP
4 37 (10.22%) HTTP
5 26 (7.18%) DHCP
6 24 (6.63%) BGP
6 24 (6.63%) VPN
7 20 (5.52%) HTTPS
7 20 (5.52%) OSPF
8 10 (2.76%) NGFW
9 9 (2.49%) Network Security
10 8 (2.21%) VSAN
11 7 (1.93%) Internet
12 5 (1.38%) MPLS
12 5 (1.38%) SD-WAN
12 5 (1.38%) SSL
12 5 (1.38%) WAN
13 4 (1.10%) OpenLDAP
13 4 (1.10%) Reverse Proxy
13 4 (1.10%) SAN
Database & Business Intelligence
1 28 (7.73%) Amazon RDS
2 24 (6.63%) NoSQL
3 21 (5.80%) PostgreSQL
4 16 (4.42%) MongoDB
5 15 (4.14%) Data Warehouse
6 14 (3.87%) Amazon Aurora
7 13 (3.59%) Relational Database
8 12 (3.31%) SQL Server
9 11 (3.04%) Hadoop
10 10 (2.76%) Amazon Redshift
11 9 (2.49%) MySQL
12 8 (2.21%) Data Lake
12 8 (2.21%) Parquet
13 7 (1.93%) Amazon Athena
13 7 (1.93%) Apache Iceberg
13 7 (1.93%) DynamoDB
14 6 (1.66%) Power BI
14 6 (1.66%) Redis
15 5 (1.38%) Apache Hive
16 4 (1.10%) Azure SQL Database
Development Applications
1 85 (23.48%) Jenkins
2 70 (19.34%) GitLab
3 43 (11.88%) Git
4 18 (4.97%) JIRA
5 12 (3.31%) SonarQube
6 6 (1.66%) CircleCI
7 5 (1.38%) Cucumber
7 5 (1.38%) Cypress.io
7 5 (1.38%) REST Assured
7 5 (1.38%) Selenium
8 4 (1.10%) NUnit
8 4 (1.10%) Poetry
8 4 (1.10%) Terragrunt
9 3 (0.83%) Artifactory
9 3 (0.83%) Atlassian Bamboo
9 3 (0.83%) Bitbucket
9 3 (0.83%) Maven
10 2 (0.55%) Gradle
10 2 (0.55%) Storybook
10 2 (0.55%) TeamCity
General
1 72 (19.89%) Social Skills
2 54 (14.92%) Public Sector
3 35 (9.67%) Finance
4 29 (8.01%) Analytical Skills
5 16 (4.42%) Banking
6 5 (1.38%) Inclusion and Diversity
6 5 (1.38%) Investment Banking
6 5 (1.38%) Law
7 4 (1.10%) Legal
7 4 (1.10%) Police
8 3 (0.83%) Financial Institution
8 3 (0.83%) Telecoms
9 2 (0.55%) Documentation Skills
10 1 (0.28%) Advertising
10 1 (0.28%) Aviation
10 1 (0.28%) Digital Health
10 1 (0.28%) Games
10 1 (0.28%) Military
10 1 (0.28%) Presentation Skills
10 1 (0.28%) Retail
Job Titles
1 103 (28.45%) DevOps Engineer
2 80 (22.10%) Senior
3 64 (17.68%) Architect
4 46 (12.71%) AWS Engineer
5 39 (10.77%) Developer
6 38 (10.50%) Senior DevOps
7 35 (9.67%) Senior DevOps Engineer
8 32 (8.84%) Azure Engineer
8 32 (8.84%) Technical Architect
9 30 (8.29%) AWS DevOps
9 30 (8.29%) Cloud Architect
10 29 (8.01%) AWS DevOps Engineer
11 25 (6.91%) Cloud Engineer
11 25 (6.91%) Platform Engineer
12 22 (6.08%) Lead
13 19 (5.25%) AWS Architect
13 19 (5.25%) Software Engineer
14 18 (4.97%) Cloud Native Architect
15 15 (4.14%) Data Engineer
16 14 (3.87%) Senior Platform Engineer
Libraries, Frameworks & Software Standards
1 28 (7.73%) ARM Templates
2 25 (6.91%) AWS CDK
2 25 (6.91%) Elastic Stack
3 24 (6.63%) React
4 23 (6.35%) Kafka
5 22 (6.08%) REST
6 19 (5.25%) .NET
7 18 (4.97%) OAuth
8 16 (4.42%) YAML
9 14 (3.87%) Node.js
10 13 (3.59%) Keycloak
10 13 (3.59%) RESTful
11 11 (3.04%) ADO
11 11 (3.04%) cloud-init
11 11 (3.04%) OpenID
12 9 (2.49%) JSON
13 8 (2.21%) Spring
13 8 (2.21%) Spring Boot
14 7 (1.93%) AngularJS
14 7 (1.93%) CSS
Miscellaneous
1 72 (19.89%) Cloud Native
2 24 (6.63%) Hybrid Cloud
3 16 (4.42%) PKI
4 14 (3.87%) Public Cloud
5 12 (3.31%) Enterprise Software
6 10 (2.76%) Product Ownership
7 8 (2.21%) Distributed Systems
7 8 (2.21%) Onboarding
8 7 (1.93%) Anti-Spyware
8 7 (1.93%) Linux Command Line
9 6 (1.66%) Data Centre
10 4 (1.10%) Legacy Applications
10 4 (1.10%) Private Cloud
10 4 (1.10%) Reinsurance
11 3 (0.83%) Greenfield Project
11 3 (0.83%) Security Posture
12 2 (0.55%) Analytical Mindset
12 2 (0.55%) Data Structures
12 2 (0.55%) Enterprise Cloud
12 2 (0.55%) Legacy Systems
Operating Systems
1 81 (22.38%) Linux
2 28 (7.73%) Red Hat Enterprise Linux
3 23 (6.35%) Unix
4 19 (5.25%) Windows
5 12 (3.31%) CentOS
6 8 (2.21%) Windows Server
7 4 (1.10%) VMS
8 2 (0.55%) Solaris
8 2 (0.55%) SUSE
8 2 (0.55%) Windows Server 2016
9 1 (0.28%) Amazon Linux
9 1 (0.28%) Mac OS
9 1 (0.28%) Oracle Linux
9 1 (0.28%) VyOS
9 1 (0.28%) Windows Server 2019
Processes & Methodologies
1 210 (58.01%) DevOps
2 207 (57.18%) CI/CD
3 121 (33.43%) Containerisation
4 93 (25.69%) Agile
5 63 (17.40%) Continuous Integration
5 63 (17.40%) Problem-Solving
6 61 (16.85%) Microservices
7 59 (16.30%) Test Automation
8 43 (11.88%) Infrastructure Automation
9 42 (11.60%) Software Engineering
10 41 (11.33%) Observability
11 37 (10.22%) Migration
11 37 (10.22%) Platform Engineering
12 36 (9.94%) Configuration Management
12 36 (9.94%) Mentoring
13 30 (8.29%) Cloud Security
13 30 (8.29%) High Availability
14 27 (7.46%) Deployment Automation
15 25 (6.91%) Analytics
15 25 (6.91%) Technical Leadership
Programming Languages
1 151 (41.71%) Python
2 79 (21.82%) Bash
3 52 (14.36%) PowerShell
4 44 (12.15%) SQL
5 41 (11.33%) Bicep
6 33 (9.12%) Java
7 31 (8.56%) JavaScript
8 28 (7.73%) TypeScript
9 25 (6.91%) Go
10 23 (6.35%) C#
11 8 (2.21%) Shell Script
12 5 (1.38%) Ruby
13 4 (1.10%) Perl
13 4 (1.10%) PHP
14 3 (0.83%) Kusto Query Language
15 2 (0.55%) Kotlin
15 2 (0.55%) R
15 2 (0.55%) T-SQL
16 1 (0.28%) ActionScript 2.0
16 1 (0.28%) Scala
Qualifications
1 112 (30.94%) Security Cleared
2 101 (27.90%) SC Cleared
3 30 (8.29%) AWS Certification
4 22 (6.08%) Degree
5 14 (3.87%) Computer Science Degree
6 12 (3.31%) Microsoft Certification
7 11 (3.04%) Azure Certification
8 10 (2.76%) VMware Certified Professional (VCP)
9 8 (2.21%) AWS Certified Solutions Architect
9 8 (2.21%) DV Cleared
10 7 (1.93%) MCSE
11 4 (1.10%) OCP
11 4 (1.10%) Oracle Certification
12 3 (0.83%) AWS Certified Developer
12 3 (0.83%) AWS Certified DevOps Engineer
12 3 (0.83%) BPSS Clearance
12 3 (0.83%) CCNP
12 3 (0.83%) Cisco Certification
12 3 (0.83%) RHCSA
13 2 (0.55%) Master's Degree
Quality Assurance & Compliance
1 15 (4.14%) NCSC
2 12 (3.31%) GDPR
2 12 (3.31%) NIST
3 11 (3.04%) QA
4 10 (2.76%) Accessibility
5 7 (1.93%) Cyber Essentials
5 7 (1.93%) Data Quality
6 4 (1.10%) Disclosure Scotland
6 4 (1.10%) PCI DSS
7 3 (0.83%) HIPAA
7 3 (0.83%) Sarbanes-Oxley
7 3 (0.83%) SLA
7 3 (0.83%) SOC 2
8 2 (0.55%) ISO/IEC 27001
9 1 (0.28%) California Consumer Privacy Act
9 1 (0.28%) ISO/IEC 27002 (supersedes ISO/IEC 17799)
9 1 (0.28%) Software Quality Assurance
9 1 (0.28%) WCAG
System Software
1 138 (38.12%) Docker
2 23 (6.35%) VMware Infrastructure
3 18 (4.97%) Active Directory
4 10 (2.76%) Virtual Machines
5 9 (2.49%) VMware NSX
6 5 (1.38%) vSphere
7 4 (1.10%) Apache ZooKeeper
8 3 (0.83%) DFS Replication
8 3 (0.83%) Veritas Cluster Server
9 2 (0.55%) Virtual Desktop
9 2 (0.55%) VMware ESXi
10 1 (0.28%) Ceph
10 1 (0.28%) Hyper-V
10 1 (0.28%) NFS
10 1 (0.28%) Samba
Systems Management
1 283 (78.18%) Terraform
2 164 (45.30%) Kubernetes
3 101 (27.90%) Ansible
4 53 (14.64%) Grafana
5 49 (13.54%) Prometheus
6 22 (6.08%) Progress Chef
6 22 (6.08%) Puppet
7 13 (3.59%) Packer
8 11 (3.04%) Consul
8 11 (3.04%) Istio
9 9 (2.49%) Argo
9 9 (2.49%) ZABBIX
10 8 (2.21%) linkerd
10 8 (2.21%) Rancher
11 7 (1.93%) Jamf Pro
12 6 (1.66%) FortiGate
13 5 (1.38%) Docker Swarm
13 5 (1.38%) HAProxy
13 5 (1.38%) Podman
13 5 (1.38%) Single Sign-On
Vendors
1 34 (9.39%) Palo Alto
2 33 (9.12%) Microsoft
3 30 (8.29%) Cisco
4 29 (8.01%) VMware
5 25 (6.91%) CheckPoint
6 24 (6.63%) Fortinet
7 23 (6.35%) Red Hat
8 18 (4.97%) Splunk
9 9 (2.49%) Google
10 8 (2.21%) Databricks
10 8 (2.21%) Infoblox
10 8 (2.21%) SAP
11 7 (1.93%) Okta
11 7 (1.93%) Oracle
12 5 (1.38%) Apple
12 5 (1.38%) ESET
13 4 (1.10%) ServiceNow
14 3 (0.83%) IBM
14 3 (0.83%) Veritas
15 2 (0.55%) BMC