Hybrid/Remote Microservices Contract Job Trends

Microservices
UK > Work from Home

The table below provides summary statistics and contractor rates for remote or hybrid contract work requiring Microservices skills. It covers vacancies from the 6 months leading up to 20 September 2025, with comparisons to the same periods in the previous two years.

6 months to
20 Sep 2025
Same period 2024 Same period 2023
Rank 52 69 64
Rank change year-on-year +17 -5 -31
Contract jobs citing Microservices 423 383 654
As % of all contract jobs with a WFH option 4.32% 3.01% 3.21%
As % of the Processes & Methodologies category 4.68% 3.43% 3.59%
Number of daily rates quoted 299 285 511
10th Percentile £358 £400 £413
25th Percentile £413 £454 £463
Median daily rate (50th Percentile) £508 £550 £575
Median % change year-on-year -7.73% -4.35% -4.17%
75th Percentile £597 £638 £688
90th Percentile £700 £736 £775
UK median daily rate £525 £550 £600
% change year-on-year -4.55% -8.33% -
Number of hourly rates quoted 7 2 6
10th Percentile - £40.59 £70.63
25th Percentile £67.00 £40.62 £71.25
Median hourly rate £77.50 £41.33 £73.75
Median % change year-on-year +87.53% -43.96% +16.60%
75th Percentile £83.75 £42.12 £75.00
90th Percentile £87.50 £42.20 -
UK median hourly rate £67.00 £47.00 £73.75
% change year-on-year +42.55% -36.27% +12.15%

All Process and Methodology Skills
Work from Home

Microservices falls under the Processes and Methodologies category. For comparison with the information above, the following table provides summary statistics for all contract job vacancies with remote or hybrid options requiring process or methodology skills.

Contract vacancies with a requirement for process or methodology skills 9,040 11,178 18,207
As % of all contract jobs with a WFH option 92.28% 87.92% 89.39%
Number of daily rates quoted 6,003 7,141 12,829
10th Percentile £325 £325 £350
25th Percentile £413 £425 £437
Median daily rate (50th Percentile) £508 £525 £535
Median % change year-on-year -3.33% -1.87% -2.73%
75th Percentile £625 £638 £650
90th Percentile £738 £750 £750
UK median daily rate £500 £525 £540
% change year-on-year -4.76% -2.78% -1.82%
Number of hourly rates quoted 275 296 436
10th Percentile £12.62 £17.88 £17.75
25th Percentile £20.50 £29.63 £26.18
Median hourly rate £36.00 £43.00 £52.50
Median % change year-on-year -16.28% -18.10% +5.00%
75th Percentile £65.00 £67.14 £70.00
90th Percentile £68.00 £75.00 £82.00
UK median hourly rate £25.15 £43.00 £43.79
% change year-on-year -41.51% -1.81% +53.66%

Microservices
Trend for Jobs with a WFH Option

Job vacancies with remote working options citing Microservices as a proportion of all IT jobs advertised.
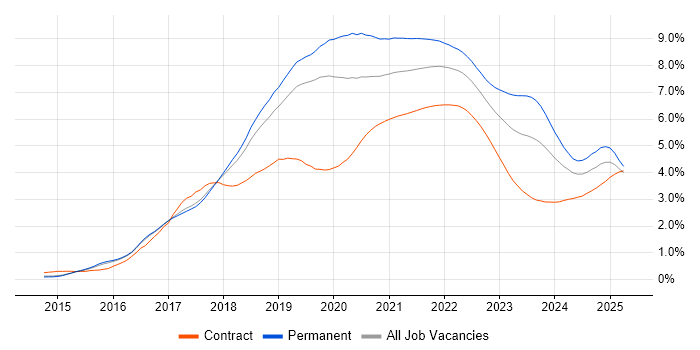
Microservices trend for jobs with Hybrid/Remote/WFH options

Microservices
Daily Rate Trend for Jobs with Hybrid Work Options

Contractor daily rate distribution trend for jobs with remote work options citing Microservices.

Contractor daily rate distribution trend for jobs with remote work options citing Microservices

Microservices
Daily Rate Histogram for Jobs with a WFH Option

Daily rate distribution for jobs with remote working options citing Microservices over the 6 months to 20 September 2025.

Microservices daily rate histogram for jobs with a WFH option

Microservices
Hourly Rate Trend for Jobs with Hybrid Work Options

Contractor hourly rate distribution trend for jobs with remote work options citing Microservices.

Contractor hourly rate distribution trend for jobs with remote work options citing Microservices

Microservices
Hourly Rate Histogram for Jobs with a WFH Option

Hourly rate distribution for jobs with remote working options citing Microservices over the 6 months to 20 September 2025.

Microservices hourly rate histogram for jobs with a WFH option

Microservices
Co-occurring Skills and Capabilities with WFH Options by Category

The follow tables expand on the table above by listing co-occurrences grouped by category. The same employment type, locality and period is covered with up to 20 co-occurrences shown in each of the following categories:

Application Platforms
1 26 (6.15%) Confluence
2 10 (2.36%) Apache Spark
3 7 (1.65%) JBoss
4 5 (1.18%) nginx
5 4 (0.95%) Apache
5 4 (0.95%) Mule
6 3 (0.71%) Camunda
6 3 (0.71%) WebLogic
7 2 (0.47%) Alfresco
7 2 (0.47%) CMS
7 2 (0.47%) Gunicorn
7 2 (0.47%) Jupyter
7 2 (0.47%) Tomcat
8 1 (0.24%) Anypoint
8 1 (0.24%) Apache Airflow
8 1 (0.24%) Ethereum
8 1 (0.24%) Hyperledger
8 1 (0.24%) Oracle SOA Suite
8 1 (0.24%) Traefik
8 1 (0.24%) WebSphere
Applications
1 1 (0.24%) Chatbot
Business Applications
1 4 (0.95%) Aladdin
1 4 (0.95%) Distributed Ledger
1 4 (0.95%) Fidessa
1 4 (0.95%) Oracle Retail
1 4 (0.95%) Remedy ITSM
1 4 (0.95%) thinkFolio
2 2 (0.47%) Payment Gateway
3 1 (0.24%) Avolution ABACUS
3 1 (0.24%) R3 Corda
3 1 (0.24%) Temenos T24
Cloud Services
1 208 (49.17%) AWS
2 115 (27.19%) Azure
3 77 (18.20%) Serverless
4 65 (15.37%) GCP
5 63 (14.89%) GitHub
6 47 (11.11%) AWS Lambda
7 41 (9.69%) Amazon SQS
8 36 (8.51%) GitHub Actions
9 34 (8.04%) Amazon S3
10 26 (6.15%) Amazon EC2
10 26 (6.15%) Azure DevOps
11 21 (4.96%) Amazon CloudWatch
12 18 (4.26%) Amazon ECS
12 18 (4.26%) Amazon EKS
13 12 (2.84%) Azure AKS
13 12 (2.84%) OpenShift
14 11 (2.60%) Azure Cosmos DB
14 11 (2.60%) SaaS
15 10 (2.36%) Amazon EventBridge
15 10 (2.36%) Azure Service Bus
Communications & Networking
1 10 (2.36%) HTTP
2 5 (1.18%) Firewall
2 5 (1.18%) SSL
3 2 (0.47%) 3GPP
3 2 (0.47%) 4G
3 2 (0.47%) 5G
3 2 (0.47%) Internet
3 2 (0.47%) OpenLDAP
3 2 (0.47%) Software-Defined Networking
3 2 (0.47%) VPN
3 2 (0.47%) Wireless
4 1 (0.24%) DMZ
4 1 (0.24%) DNS
4 1 (0.24%) VoIP
Database & Business Intelligence
1 63 (14.89%) PostgreSQL
2 51 (12.06%) NoSQL
3 44 (10.40%) MongoDB
4 38 (8.98%) Relational Database
5 24 (5.67%) Amazon RDS
5 24 (5.67%) DynamoDB
6 23 (5.44%) MySQL
7 18 (4.26%) Redis
7 18 (4.26%) SQL Server
8 15 (3.55%) Amazon Aurora
9 10 (2.36%) Big Data
10 9 (2.13%) Oracle Database
11 7 (1.65%) Data Warehouse
11 7 (1.65%) Hadoop
12 6 (1.42%) DocumentDB
12 6 (1.42%) Elasticsearch
12 6 (1.42%) RDBMS
13 5 (1.18%) Azure SQL Database
13 5 (1.18%) Data Lake
14 4 (0.95%) MariaDB
Development Applications
1 92 (21.75%) Jenkins
2 78 (18.44%) Git
3 57 (13.48%) GitLab
3 57 (13.48%) JIRA
4 54 (12.77%) JUnit
5 36 (8.51%) Mockito
6 35 (8.27%) SonarQube
7 25 (5.91%) Maven
8 17 (4.02%) Bitbucket
9 14 (3.31%) Cypress.io
9 14 (3.31%) Gradle
9 14 (3.31%) Selenium
10 13 (3.07%) Cucumber
10 13 (3.07%) Liquibase
11 11 (2.60%) Postman
11 11 (2.60%) REST Assured
12 10 (2.36%) Subversion
13 8 (1.89%) Sonatype Nexus
14 7 (1.65%) Atlassian Bamboo
14 7 (1.65%) Gatling
General
1 107 (25.30%) Social Skills
2 92 (21.75%) Finance
3 58 (13.71%) Banking
4 56 (13.24%) Public Sector
5 23 (5.44%) Analytical Skills
6 9 (2.13%) Retail
7 8 (1.89%) Front Office
7 8 (1.89%) Telecoms
8 7 (1.65%) Military
9 6 (1.42%) Legal
10 5 (1.18%) Digital Healthcare
10 5 (1.18%) Investment Banking
11 4 (0.95%) Financial Institution
11 4 (0.95%) Influencing Skills
11 4 (0.95%) Presentation Skills
11 4 (0.95%) Retail Banking
12 3 (0.71%) Billing
12 3 (0.71%) Marketing
13 2 (0.47%) Inclusion and Diversity
13 2 (0.47%) Spanish Language
Job Titles
1 160 (37.83%) Developer
2 79 (18.68%) Architect
2 79 (18.68%) Java Developer
3 69 (16.31%) Senior
4 58 (13.71%) Lead
5 40 (9.46%) Software Engineer
6 34 (8.04%) Senior Developer
7 29 (6.86%) Solutions Architect
8 26 (6.15%) Lead Developer
9 25 (5.91%) Java Engineer
9 25 (5.91%) Senior Java Developer
10 21 (4.96%) .NET Developer
10 21 (4.96%) Full-Stack Developer
11 19 (4.49%) DevOps Engineer
12 17 (4.02%) Lead Java Developer
13 15 (3.55%) Technical Architect
14 13 (3.07%) Enterprise Architect
15 12 (2.84%) Full-Stack Engineer
15 12 (2.84%) Python Engineer
15 12 (2.84%) Senior Architect
Libraries, Frameworks & Software Standards
1 107 (25.30%) RESTful
2 100 (23.64%) Spring Boot
3 96 (22.70%) Spring
4 95 (22.46%) Kafka
5 91 (21.51%) REST
6 81 (19.15%) React
7 63 (14.89%) Node.js
8 61 (14.42%) AngularJS
9 48 (11.35%) .NET
10 45 (10.64%) HTML
11 34 (8.04%) CSS
12 29 (6.86%) OAuth
12 29 (6.86%) SOAP
13 27 (6.38%) Swagger
14 26 (6.15%) Hibernate
15 25 (5.91%) .NET Core
15 25 (5.91%) Web Services
16 24 (5.67%) JPA
17 23 (5.44%) JSON
18 22 (5.20%) Spring Cloud
Miscellaneous
1 69 (16.31%) Cloud Native
2 55 (13.00%) Distributed Systems
3 31 (7.33%) Product Ownership
4 16 (3.78%) Legacy Systems
5 14 (3.31%) Data Protection Act
6 13 (3.07%) Mobile App
7 12 (2.84%) Algorithms
7 12 (2.84%) Onboarding
8 11 (2.60%) Public Cloud
9 10 (2.36%) Data Structures
10 9 (2.13%) Enterprise Software
10 9 (2.13%) Virtual Team
11 8 (1.89%) Self-Motivation
12 7 (1.65%) PKI
13 5 (1.18%) Cyber Threat
13 5 (1.18%) Data Centre
13 5 (1.18%) Greenfield Project
14 4 (0.95%) Derivative
14 4 (0.95%) Hybrid Cloud
14 4 (0.95%) Legacy Code
Operating Systems
1 33 (7.80%) Linux
2 19 (4.49%) Unix
3 7 (1.65%) Red Hat Enterprise Linux
4 4 (0.95%) Windows
5 2 (0.47%) Android
5 2 (0.47%) Mac OS X
6 1 (0.24%) Apple iOS
6 1 (0.24%) VMS
Processes & Methodologies
1 223 (52.72%) Agile
2 209 (49.41%) CI/CD
3 175 (41.37%) DevOps
4 121 (28.61%) Containerisation
5 100 (23.64%) TDD
6 83 (19.62%) Test Automation
7 81 (19.15%) Software Engineering
8 78 (18.44%) Problem-Solving
9 72 (17.02%) Full-Stack Development
10 65 (15.37%) Infrastructure as Code
11 62 (14.66%) Scrum
12 58 (13.71%) Event-Driven
13 45 (10.64%) Code Quality
13 45 (10.64%) Continuous Integration
14 42 (9.93%) API Development
14 42 (9.93%) Migration
15 41 (9.69%) BDD
16 39 (9.22%) Artificial Intelligence
16 39 (9.22%) Mentoring
17 38 (8.98%) SDLC
Programming Languages
1 198 (46.81%) Java
2 82 (19.39%) Python
3 79 (18.68%) SQL
4 68 (16.08%) JavaScript
5 65 (15.37%) TypeScript
6 48 (11.35%) C#
7 29 (6.86%) Go
8 15 (3.55%) Bash
8 15 (3.55%) Shell Script
9 13 (3.07%) C++
10 6 (1.42%) C
10 6 (1.42%) Groovy
11 5 (1.18%) Kotlin
11 5 (1.18%) Scala
12 4 (0.95%) Perl
12 4 (0.95%) PL/SQL
13 3 (0.71%) Bicep
13 3 (0.71%) COBOL
13 3 (0.71%) PromQL
13 3 (0.71%) Ruby
Qualifications
1 84 (19.86%) Security Cleared
2 71 (16.78%) SC Cleared
3 31 (7.33%) Degree
4 27 (6.38%) Computer Science Degree
5 15 (3.55%) AWS Certification
6 10 (2.36%) BPSS Clearance
7 8 (1.89%) AWS Certified Solutions Architect
8 6 (1.42%) Master's Degree
9 4 (0.95%) Azure Certification
9 4 (0.95%) CISSP
10 3 (0.71%) TOGAF Certification
11 2 (0.47%) GIAC
12 1 (0.24%) AWS Certified SysOps Administrator
12 1 (0.24%) CEH
12 1 (0.24%) Cisco Certification
12 1 (0.24%) CISM
12 1 (0.24%) ISTQB
12 1 (0.24%) Microsoft Certification
12 1 (0.24%) Postgraduate
12 1 (0.24%) VMware Certified Professional (VCP)
Quality Assurance & Compliance
1 51 (12.06%) QA
2 21 (4.96%) Accessibility
3 9 (2.13%) WCAG
4 6 (1.42%) GDPR
5 5 (1.18%) PCI DSS
6 4 (0.95%) MiFID
7 3 (0.71%) HIPAA
7 3 (0.71%) SOC 2
8 2 (0.47%) Data Quality
8 2 (0.47%) HL7
8 2 (0.47%) ISO/IEC 27001
9 1 (0.24%) Cyber Essentials
9 1 (0.24%) ISO 15022
9 1 (0.24%) ISO 20022
9 1 (0.24%) NIST
9 1 (0.24%) SLA
System Software
1 155 (36.64%) Docker
2 5 (1.18%) Active Directory
3 3 (0.71%) Postfix
4 2 (0.47%) VMware ESXi
4 2 (0.47%) VMware Infrastructure
4 2 (0.47%) vSphere
5 1 (0.24%) Virtual Machines
Systems Management
1 142 (33.57%) Kubernetes
2 71 (16.78%) Terraform
3 33 (7.80%) Grafana
4 28 (6.62%) Prometheus
5 19 (4.49%) Ansible
6 10 (2.36%) Argo
7 9 (2.13%) Istio
7 9 (2.13%) Single Sign-On
8 5 (1.18%) Progress Chef
9 3 (0.71%) Puppet
10 2 (0.47%) Kibana
10 2 (0.47%) Microsoft Intune
11 1 (0.24%) CloudHub
11 1 (0.24%) Control-M
Vendors
1 32 (7.57%) Google
2 25 (5.91%) Oracle
3 21 (4.96%) Splunk
4 17 (4.02%) Microsoft
5 13 (3.07%) ServiceNow
6 11 (2.60%) Dynatrace
7 10 (2.36%) CA Agile Central
8 8 (1.89%) Red Hat
9 6 (1.42%) Hitachi
9 6 (1.42%) IBM
9 6 (1.42%) Salesforce
10 5 (1.18%) Atlassian
10 5 (1.18%) HP
10 5 (1.18%) Pega
11 4 (0.95%) BMC
11 4 (0.95%) Ivanti
11 4 (0.95%) MuleSoft
11 4 (0.95%) Portware
11 4 (0.95%) Remedy
11 4 (0.95%) SAP