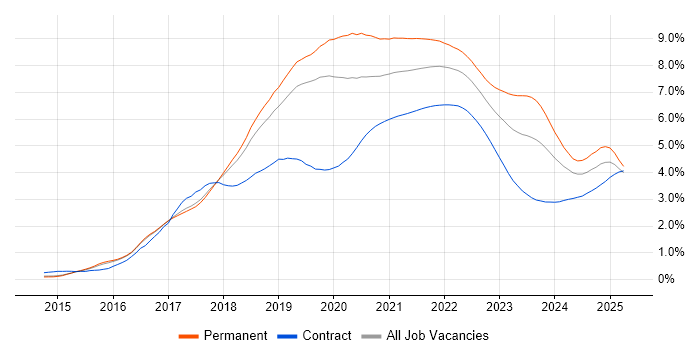
Hybrid/Remote Microservices Job Trends

Microservices
UK > Work from Home

The table below provides summary statistics and salary benchmarking for remote or hybrid work requiring Microservices skills. It covers vacancies from the 6 months leading up to 19 September 2025, with comparisons to the same periods in the previous two years.

6 months to
19 Sep 2025
Same period 2024 Same period 2023
Rank 49 71 49
Rank change year-on-year +22 -22 -17
Permanent jobs citing Microservices 936 888 1,460
As % of all permanent jobs with a WFH option 5.74% 3.79% 5.92%
As % of the Processes & Methodologies category 6.16% 4.31% 6.21%
Number of salaries quoted 422 576 1,155
10th Percentile £47,500 £40,000 £50,000
25th Percentile £57,500 £48,750 £57,500
Median annual salary (50th Percentile) £70,000 £61,853 £75,000
Median % change year-on-year +13.17% -17.53% +3.45%
75th Percentile £84,688 £82,500 £90,000
90th Percentile £100,000 £95,625 £105,000
UK median annual salary £72,500 £65,000 £75,000
% change year-on-year +11.54% -13.33% -

All Process and Methodology Skills
Work from Home

Microservices falls under the Processes and Methodologies category. For comparison with the information above, the following table provides summary statistics for all permanent job vacancies with remote or hybrid options requiring process or methodology skills.

Permanent vacancies with a requirement for process or methodology skills 15,202 20,599 23,513
As % of all permanent jobs with a WFH option 93.21% 87.83% 95.29%
Number of salaries quoted 8,626 12,626 19,362
10th Percentile £30,000 £35,500 £37,500
25th Percentile £40,751 £45,000 £47,500
Median annual salary (50th Percentile) £60,000 £60,000 £62,500
Median % change year-on-year - -4.00% +1.63%
75th Percentile £78,750 £80,000 £81,250
90th Percentile £100,000 £100,000 £100,000
UK median annual salary £55,000 £57,500 £60,000
% change year-on-year -4.35% -4.17% -

Microservices
Trend for Jobs with a WFH Option

Job vacancies with remote working options citing Microservices as a proportion of all IT jobs advertised.

Microservices trend for jobs with Hybrid/Remote/WFH options

Microservices
Salary Trend for Jobs with Hybrid Work Options

Salary distribution trend for jobs with remote work options citing Microservices.

Salary distribution trend for jobs with remote work options citing Microservices

Microservices
Salary Histogram for Jobs with a WFH Option

Salary distribution for jobs with remote working options citing Microservices over the 6 months to 19 September 2025.

Microservices salary histogram for jobs with a WFH option

Microservices
Co-occurring Skills and Capabilities with WFH Options by Category

The follow tables expand on the table above by listing co-occurrences grouped by category. The same employment type, locality and period is covered with up to 20 co-occurrences shown in each of the following categories:

Application Platforms
1 171 (18.27%) Confluence
2 8 (0.85%) Oracle SOA Suite
3 6 (0.64%) Apache
3 6 (0.64%) Apache Airflow
4 5 (0.53%) nginx
5 4 (0.43%) CMS
5 4 (0.43%) IIS
6 3 (0.32%) NServiceBus
7 2 (0.21%) SharePoint
8 1 (0.11%) ArcGIS
8 1 (0.11%) JBoss
Applications
1 1 (0.11%) Chatbot
1 1 (0.11%) PlantUML
Business Applications
1 7 (0.75%) Oracle ERP
2 4 (0.43%) Dynamics CRM
3 1 (0.11%) SAP S/4HANA
Cloud Services
1 696 (74.36%) Azure
2 647 (69.12%) AWS
3 404 (43.16%) GCP
4 83 (8.87%) Azure DevOps
5 49 (5.24%) Serverless
6 48 (5.13%) SaaS
7 40 (4.27%) GitHub
8 31 (3.31%) Azure Cosmos DB
9 27 (2.88%) Azure Service Bus
10 26 (2.78%) AWS Lambda
11 21 (2.24%) Amazon S3
12 18 (1.92%) Power Platform
13 17 (1.82%) Amazon ECS
13 17 (1.82%) Azure Logic Apps
13 17 (1.82%) GitHub Actions
13 17 (1.82%) Power Automate
14 16 (1.71%) PaaS
15 15 (1.60%) Amazon EC2
16 14 (1.50%) SonarCloud
17 13 (1.39%) Microsoft 365
Communications & Networking
1 5 (0.53%) Internet
1 5 (0.53%) Network Security
2 2 (0.21%) AMQP
2 2 (0.21%) Broadband
3 1 (0.11%) 3GPP
3 1 (0.11%) 4G
3 1 (0.11%) 5G
3 1 (0.11%) Diameter Protocol
3 1 (0.11%) Firewall
3 1 (0.11%) HTTP
3 1 (0.11%) SCTP
3 1 (0.11%) TCP/IP
Database & Business Intelligence
1 318 (33.97%) SQL Server
2 86 (9.19%) MongoDB
3 79 (8.44%) NoSQL
4 47 (5.02%) PostgreSQL
5 45 (4.81%) Elasticsearch
6 44 (4.70%) Azure SQL Database
7 24 (2.56%) MySQL
8 23 (2.46%) Relational Database
9 15 (1.60%) Redis
10 12 (1.28%) DynamoDB
11 11 (1.18%) Tableau
12 10 (1.07%) RDBMS
13 9 (0.96%) NonStop SQL
13 9 (0.96%) Power BI
14 8 (0.85%) Amazon RDS
15 7 (0.75%) Data Warehouse
16 4 (0.43%) Snowflake Schema
17 2 (0.21%) Amazon Redshift
17 2 (0.21%) MariaDB
17 2 (0.21%) Oracle Database
Development Applications
1 270 (28.85%) JIRA
2 265 (28.31%) GitLab
3 262 (27.99%) SonarQube
4 259 (27.67%) Maven
5 256 (27.35%) Sonatype Nexus
6 253 (27.03%) Selenium
7 247 (26.39%) Bitbucket
7 247 (26.39%) Cucumber
8 108 (11.54%) Git
9 44 (4.70%) Jenkins
10 19 (2.03%) Octopus Deploy
10 19 (2.03%) Visual Studio
11 18 (1.92%) Team Foundation Server
12 15 (1.60%) JUnit
12 15 (1.60%) MSBuild
13 7 (0.75%) Mockito
13 7 (0.75%) Oracle Forms
14 6 (0.64%) Postman
15 5 (0.53%) CircleCI
15 5 (0.53%) Cypress.io
General
1 439 (46.90%) Inclusion and Diversity
2 354 (37.82%) Finance
3 279 (29.81%) Banking
4 122 (13.03%) Retail
5 92 (9.83%) Social Skills
6 91 (9.72%) Investment Banking
7 90 (9.62%) Corporate Banking
8 27 (2.88%) Law
9 21 (2.24%) Public Sector
10 20 (2.14%) Analytical Skills
10 20 (2.14%) Billing
11 16 (1.71%) Front Office
12 10 (1.07%) Advertising
13 9 (0.96%) Back Office
14 6 (0.64%) Legal
14 6 (0.64%) Pharmaceutical
15 4 (0.43%) Automotive
15 4 (0.43%) Marketing
15 4 (0.43%) Tech for Good
16 3 (0.32%) Influencing Skills
Job Titles
1 537 (57.37%) Software Engineer
2 290 (30.98%) Senior
3 227 (24.25%) Senior Software Engineer
4 196 (20.94%) Developer
5 87 (9.29%) .NET Developer
6 73 (7.80%) Architect
7 55 (5.88%) Lead
8 43 (4.59%) C# Developer
9 35 (3.74%) Java Engineer
10 31 (3.31%) Solutions Architect
11 29 (3.10%) Java Software Engineer
12 28 (2.99%) Senior Developer
13 24 (2.56%) Java Developer
13 24 (2.56%) Technical Architect
14 19 (2.03%) AWS Architect
15 18 (1.92%) C# .NET Developer
16 17 (1.82%) Full-Stack Developer
16 17 (1.82%) Lead Developer
17 16 (1.71%) Senior Architect
18 14 (1.50%) Senior .NET Developer
Libraries, Frameworks & Software Standards
1 411 (43.91%) .NET
2 381 (40.71%) React
3 321 (34.29%) Spring
4 320 (34.19%) HTML
5 308 (32.91%) Spring Boot
6 304 (32.48%) Kafka
7 301 (32.16%) CSS
8 251 (26.82%) Redux
9 250 (26.71%) JPA
10 232 (24.79%) Node.js
11 216 (23.08%) RESTful
12 175 (18.70%) REST
13 173 (18.48%) Hibernate
14 116 (12.39%) HTML5
15 98 (10.47%) CSS3
16 95 (10.15%) Sass
17 94 (10.04%) Jest
18 87 (9.29%) .NET Core
19 80 (8.55%) AngularJS
20 71 (7.59%) ASP.NET
Miscellaneous
1 281 (30.02%) Product Ownership
2 266 (28.42%) Enterprise Software
3 187 (19.98%) Self-Motivation
4 178 (19.02%) Cyberattack
4 178 (19.02%) Linux Command Line
5 101 (10.79%) Cloud Native
6 39 (4.17%) Distributed Systems
7 24 (2.56%) Onboarding
8 17 (1.82%) Management Information System
9 14 (1.50%) Data Structures
10 13 (1.39%) Greenfield Project
11 12 (1.28%) Public Cloud
12 11 (1.18%) Algorithms
13 9 (0.96%) IoT
14 8 (0.85%) Legacy Systems
15 6 (0.64%) BYOD
16 5 (0.53%) Augmented Reality
16 5 (0.53%) Legacy Code
16 5 (0.53%) Mobile App
16 5 (0.53%) Security Posture
Operating Systems
1 213 (22.76%) Linux
2 22 (2.35%) Windows
3 11 (1.18%) Unix
4 1 (0.11%) Android
4 1 (0.11%) Debian
4 1 (0.11%) Red Hat Enterprise Linux
4 1 (0.11%) Ubuntu
Processes & Methodologies
1 708 (75.64%) Agile
2 611 (65.28%) Software Engineering
3 476 (50.85%) DevOps
4 456 (48.72%) CI/CD
5 370 (39.53%) Mentoring
6 348 (37.18%) Full-Stack Development
7 347 (37.07%) Containerisation
8 325 (34.72%) Test Automation
9 304 (32.48%) User Experience
10 299 (31.94%) SDLC
11 280 (29.91%) Front End Development
12 278 (29.70%) Performance Optimisation
13 263 (28.10%) TDD
14 262 (27.99%) Scrum
15 224 (23.93%) Continuous Improvement
16 210 (22.44%) Clean Code
17 202 (21.58%) Machine Learning
18 195 (20.83%) Cloud Security
19 189 (20.19%) Data Engineering
20 183 (19.55%) Site Reliability Engineering
Programming Languages
1 599 (64.00%) Java
2 590 (63.03%) JavaScript
3 425 (45.41%) SQL
4 277 (29.59%) Python
5 239 (25.53%) C#
6 202 (21.58%) Go
7 183 (19.55%) C++
8 180 (19.23%) Rust
9 175 (18.70%) TypeScript
10 11 (1.18%) PowerShell
11 9 (0.96%) PHP
11 9 (0.96%) Shell Script
12 7 (0.75%) PL/SQL
13 5 (0.53%) Ruby
14 4 (0.43%) Bash
14 4 (0.43%) Bicep
15 3 (0.32%) C
15 3 (0.32%) Elixir
15 3 (0.32%) T-SQL
16 2 (0.21%) VB
Qualifications
1 216 (23.08%) Security Cleared
2 212 (22.65%) AWS Certification
3 201 (21.47%) AWS Certified Solutions Architect
4 181 (19.34%) DV Cleared
5 180 (19.23%) AWS Certified Developer
6 48 (5.13%) Degree
7 30 (3.21%) SC Cleared
8 26 (2.78%) Computer Science Degree
9 22 (2.35%) Master's Degree
10 19 (2.03%) Azure Certification
11 9 (0.96%) TOGAF Certification
12 6 (0.64%) CISM
12 6 (0.64%) CISSP
13 5 (0.53%) (ISC)2 CCSP
13 5 (0.53%) Cisco Certification
13 5 (0.53%) CompTIA Security+
14 4 (0.43%) ISTQB
14 4 (0.43%) ISTQB Foundation Certification
14 4 (0.43%) PhD
15 3 (0.32%) Microsoft Certification
Quality Assurance & Compliance
1 301 (32.16%) QA
2 100 (10.68%) Accessibility
3 40 (4.27%) GDPR
4 18 (1.92%) HIPAA
5 13 (1.39%) NIST
6 9 (0.96%) ISO/IEC 27001
7 5 (0.53%) Sarbanes-Oxley
8 4 (0.43%) PCI DSS
8 4 (0.43%) SOC 2
9 3 (0.32%) WCAG
10 2 (0.21%) CDISC
11 1 (0.11%) Data Quality
11 1 (0.11%) GRC
11 1 (0.11%) ISO 15022
11 1 (0.11%) ISO 20022
11 1 (0.11%) NCSC
System Software
1 402 (42.95%) Docker
2 5 (0.53%) Active Directory
3 4 (0.43%) Virtual Machines
4 1 (0.11%) HDFS
4 1 (0.11%) KVM
4 1 (0.11%) VMware Infrastructure
4 1 (0.11%) Xen
Systems Management
1 393 (41.99%) Kubernetes
2 45 (4.81%) Terraform
3 18 (1.92%) Prometheus
4 17 (1.82%) Grafana
5 10 (1.07%) Istio
6 8 (0.85%) Ansible
7 7 (0.75%) Single Sign-On
8 4 (0.43%) Progress Chef
9 3 (0.32%) Puppet
10 2 (0.21%) Argo
11 1 (0.11%) CFEngine
11 1 (0.11%) Kibana
Vendors
1 247 (26.39%) Solace
2 119 (12.71%) Microsoft
3 19 (2.03%) Guidewire
4 16 (1.71%) Google
5 15 (1.60%) Oracle
6 7 (0.75%) Cisco
6 7 (0.75%) Facebook
6 7 (0.75%) Trayport
6 7 (0.75%) YouTube
7 6 (0.64%) Dynatrace
7 6 (0.64%) Sage
8 4 (0.43%) Salesforce
9 3 (0.32%) Avaloq
9 3 (0.32%) MuleSoft
9 3 (0.32%) Red Hat
9 3 (0.32%) Splunk
10 2 (0.21%) BiZZdesign
10 2 (0.21%) OpenAI
10 2 (0.21%) SnapLogic
10 2 (0.21%) Solarflare