Project Management Contracts with Hybrid/Remote/WFH Options

Project Management
UK > Work from Home

The table below provides summary statistics for remote or hybrid contract work requiring Project Management skills. It includes a benchmarking guide to the contractor rates offered in vacancies that cited Project Management over the 6 months leading up to 2 May 2025, comparing them to the same period in the previous two years.

6 months to
2 May 2025
Same period 2024 Same period 2023
Rank 25 22 24
Rank change year-on-year -3 +2 0
Contract jobs citing Project Management 744 1,177 1,896
As % of all contract jobs with a WFH option 7.51% 7.68% 7.37%
As % of the Processes & Methodologies category 8.25% 8.74% 8.21%
Number of daily rates quoted 462 750 1,289
10th Percentile £306 £318 £363
25th Percentile £400 £425 £425
Median daily rate (50th Percentile) £500 £525 £510
Median % change year-on-year -4.76% +2.94% +2.00%
75th Percentile £588 £607 £625
90th Percentile £688 £721 £721
UK median daily rate £500 £525 £525
% change year-on-year -4.76% - +5.00%
Number of hourly rates quoted 31 107 80
10th Percentile £26.25 £23.56 £22.95
25th Percentile £31.76 £35.00 £34.06
Median hourly rate £57.50 £38.12 £49.00
Median % change year-on-year +50.84% -22.20% +10.11%
75th Percentile £66.00 £48.50 £71.56
90th Percentile £75.00 £60.50 £85.00
UK median hourly rate £42.50 £38.12 £49.00
% change year-on-year +11.49% -22.20% +47.41%

All Process and Methodology Skills
Work from Home

Project Management falls under the Processes and Methodologies category. For comparison with the information above, the following table provides summary statistics for all contract job vacancies with remote or hybrid options requiring process or methodology skills.

Contract vacancies with a requirement for process or methodology skills 9,017 13,465 23,106
As % of all contract jobs with a WFH option 91.06% 87.90% 89.81%
Number of daily rates quoted 6,189 8,984 16,334
10th Percentile £340 £325 £363
25th Percentile £419 £425 £450
Median daily rate (50th Percentile) £525 £525 £540
Median % change year-on-year - -2.78% +2.86%
75th Percentile £638 £638 £650
90th Percentile £763 £750 £750
UK median daily rate £520 £525 £550
% change year-on-year -0.95% -4.55% +4.76%
Number of hourly rates quoted 221 579 532
10th Percentile £14.20 £15.17 £19.00
25th Percentile £19.75 £25.25 £30.54
Median hourly rate £39.00 £43.00 £55.00
Median % change year-on-year -9.30% -21.82% +57.14%
75th Percentile £66.50 £60.00 £68.75
90th Percentile £75.00 £75.25 £80.00
UK median hourly rate £29.00 £35.50 £36.42
% change year-on-year -18.31% -2.53% +45.69%

Project Management
Trend for Jobs with a WFH Option

Job vacancies with remote working options citing Project Management as a proportion of all IT jobs advertised.
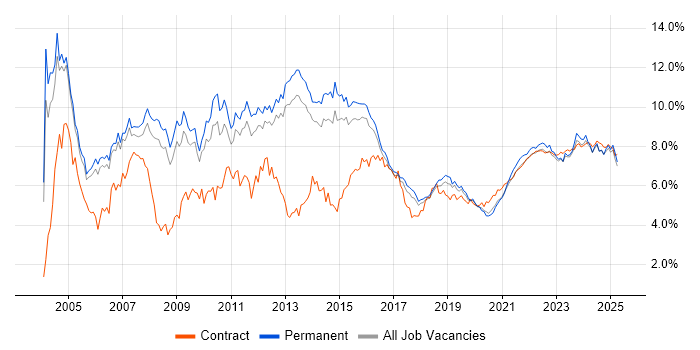
Project Management trend for jobs with Hybrid/Remote/WFH options

Project Management
Daily Rate Trend for Jobs with a WFH Option

3-month moving average daily rate quoted in job vacancies with remote working options citing Project Management.

Project Management daily rate for jobs with a WFH option

Project Management
Daily Rate Histogram for Jobs with a WFH Option

Daily rate distribution for jobs with remote working options citing Project Management over the 6 months to 2 May 2025.

Project Management daily rate histogram for jobs with a WFH option

Project Management
Hourly Rate Trend for Jobs with a WFH Option

3-month moving average hourly rate quoted in job vacancies with remote working options citing Project Management.

Project Management hourly rate for jobs with a WFH option

Project Management
Hourly Rate Histogram for Jobs with a WFH Option

Hourly rate distribution for jobs with remote working options citing Project Management over the 6 months to 2 May 2025.

Project Management hourly rate histogram for jobs with a WFH option

Project Management
Co-occurring Skills and Capabilities with WFH Options by Category

The follow tables expand on the table above by listing co-occurrences grouped by category. The same employment type, locality and period is covered with up to 20 co-occurrences shown in each of the following categories:

Application Platforms
1 37 (4.97%) Confluence
2 27 (3.63%) SharePoint
3 13 (1.75%) CMS
4 5 (0.67%) WebSphere
4 5 (0.67%) WordPress
5 3 (0.40%) Apache Spark
5 3 (0.40%) CICS
6 2 (0.27%) Apache
6 2 (0.27%) Drupal
7 1 (0.13%) ArcGIS
7 1 (0.13%) Microsoft Exchange
7 1 (0.13%) MS Project Server
7 1 (0.13%) SAS
7 1 (0.13%) ThingWorx
Applications
1 55 (7.39%) Microsoft Excel
2 50 (6.72%) Microsoft Project
3 42 (5.65%) Microsoft PowerPoint
4 23 (3.09%) Microsoft Office
5 19 (2.55%) Trello
6 12 (1.61%) MS Visio
7 6 (0.81%) Spreadsheet
8 2 (0.27%) Camtasia
9 1 (0.13%) Adobe XD
9 1 (0.13%) AutoCAD
9 1 (0.13%) Notion
9 1 (0.13%) PTC Creo
9 1 (0.13%) Siemens NX
Business Applications
1 29 (3.90%) SAP S/4HANA
2 6 (0.81%) Dynamics CRM
3 5 (0.67%) Maximo
3 5 (0.67%) Primavera
4 4 (0.54%) Oracle ASCP
4 4 (0.54%) Oracle EBS
4 4 (0.54%) Oracle EBS R12
4 4 (0.54%) Oracle ERP
4 4 (0.54%) Oracle Financials
4 4 (0.54%) SAP ERP
4 4 (0.54%) Workday HCM
4 4 (0.54%) Workfront
5 3 (0.40%) SAP Oil and Gas
5 3 (0.40%) SAP PS
5 3 (0.40%) SAP WM
6 2 (0.27%) CiviCRM
6 2 (0.27%) SAP EWM
6 2 (0.27%) SAP IBP
6 2 (0.27%) Teamcenter
7 1 (0.13%) Shopify
Cloud Services
1 72 (9.68%) Azure
2 36 (4.84%) AWS
3 33 (4.44%) Microsoft 365
4 25 (3.36%) Azure DevOps
5 21 (2.82%) SaaS
6 18 (2.42%) Power Platform
7 13 (1.75%) Entra ID
8 12 (1.61%) Asana
8 12 (1.61%) GitHub
9 11 (1.48%) Dynamics 365
9 11 (1.48%) OneDrive
10 8 (1.08%) PaaS
11 7 (0.94%) Figma
11 7 (0.94%) IaaS
11 7 (0.94%) Power Automate
12 6 (0.81%) GCP
12 6 (0.81%) OCI
13 5 (0.67%) Google Workspace
13 5 (0.67%) Slack
13 5 (0.67%) Yammer
Communications & Networking
1 11 (1.48%) Firewall
2 10 (1.34%) WAN
3 8 (1.08%) SD-WAN
4 7 (0.94%) DNS
4 7 (0.94%) LAN
4 7 (0.94%) VPN
5 6 (0.81%) SSL
6 5 (0.67%) Wi-Fi
7 4 (0.54%) 5G
7 4 (0.54%) DHCP
7 4 (0.54%) HTTP
7 4 (0.54%) IPsec
8 3 (0.40%) BGP
8 3 (0.40%) Internet
8 3 (0.40%) Kerberos
8 3 (0.40%) Network Security
8 3 (0.40%) OSPF
9 2 (0.27%) 4G
9 2 (0.27%) Cisco ISE
9 2 (0.27%) S/MIME
Database & Business Intelligence
1 15 (2.02%) Data Warehouse
2 12 (1.61%) Power BI
3 7 (0.94%) Big Data
3 7 (0.94%) MongoDB
4 6 (0.81%) Data Lake
5 5 (0.67%) DB2
5 5 (0.67%) NoSQL
6 4 (0.54%) Metadata
6 4 (0.54%) MySQL
7 3 (0.40%) Amazon RDS
7 3 (0.40%) IBM InfoSphere
7 3 (0.40%) PostgreSQL
7 3 (0.40%) Relational Database
7 3 (0.40%) SQL Server
7 3 (0.40%) Tableau
8 2 (0.27%) GIS
8 2 (0.27%) MS Access
8 2 (0.27%) Oracle ODI
8 2 (0.27%) Oracle Reports
8 2 (0.27%) SQL Server Reporting Services
Development Applications
1 85 (11.42%) JIRA
2 9 (1.21%) MSI
3 6 (0.81%) Git
3 6 (0.81%) Jenkins
4 4 (0.54%) GitLab
4 4 (0.54%) Visual Studio Code
5 3 (0.40%) Maven
6 2 (0.27%) MLflow
6 2 (0.27%) Postman
7 1 (0.13%) Bitbucket
7 1 (0.13%) CircleCI
7 1 (0.13%) Cucumber
7 1 (0.13%) GCC
7 1 (0.13%) GoCD
7 1 (0.13%) Jasmine
7 1 (0.13%) ScriptRunner
7 1 (0.13%) Snyk
7 1 (0.13%) Sonatype Nexus
7 1 (0.13%) Storybook
7 1 (0.13%) Team Foundation Server
General
1 368 (49.46%) Social Skills
2 276 (37.10%) Finance
3 137 (18.41%) Analytical Skills
4 71 (9.54%) Public Sector
5 50 (6.72%) Banking
6 47 (6.32%) Legal
7 41 (5.51%) Marketing
8 39 (5.24%) Manufacturing
9 36 (4.84%) Organisational Skills
10 30 (4.03%) Presentation Skills
11 25 (3.36%) Influencing Skills
11 25 (3.36%) Retail
12 20 (2.69%) Local Government
12 20 (2.69%) Telecoms
13 19 (2.55%) Automotive
14 14 (1.88%) Aerospace
15 13 (1.75%) Inclusion and Diversity
15 13 (1.75%) Pharmaceutical
16 12 (1.61%) Advertising
17 9 (1.21%) Law
Job Titles
1 255 (34.27%) Project Manager
2 68 (9.14%) Analyst
3 63 (8.47%) Lead
4 59 (7.93%) Senior
5 44 (5.91%) IT Manager
6 42 (5.65%) Business Analyst
7 34 (4.57%) Architect
7 34 (4.57%) Consultant
8 31 (4.17%) IT Project Manager
9 29 (3.90%) Senior Manager
10 25 (3.36%) Senior Project Manager
11 21 (2.82%) Delivery Manager
11 21 (2.82%) Programme Manager
12 20 (2.69%) Developer
13 19 (2.55%) Technical Manager
14 18 (2.42%) SAP Manager
15 16 (2.15%) Solutions Architect
16 15 (2.02%) Coordinator
16 15 (2.02%) Infrastructure Manager
17 14 (1.88%) Data Manager
Libraries, Frameworks & Software Standards
1 12 (1.61%) CSS
1 12 (1.61%) Oracle Fusion
2 10 (1.34%) HTML
2 10 (1.34%) React
3 9 (1.21%) SAML
4 7 (0.94%) .NET
4 7 (0.94%) ADO
4 7 (0.94%) Web Services
5 6 (0.81%) AngularJS
5 6 (0.81%) OAuth
5 6 (0.81%) REST
6 5 (0.67%) Bootstrap
6 5 (0.67%) LDAP
6 5 (0.67%) OpenID
7 4 (0.54%) Node.js
7 4 (0.54%) Spring
7 4 (0.54%) Spring Boot
8 3 (0.40%) OAuth2
8 3 (0.40%) Tailwind CSS
8 3 (0.40%) XACML
Miscellaneous
1 38 (5.11%) Management Information System
2 33 (4.44%) Onboarding
3 26 (3.49%) Product Ownership
4 23 (3.09%) Data Protection Act
5 21 (2.82%) PMI
6 16 (2.15%) Self-Motivation
7 14 (1.88%) Data Centre
7 14 (1.88%) IoT
8 13 (1.75%) Cloud Native
9 10 (1.34%) Life Science
10 9 (1.21%) Virtual Team
11 7 (0.94%) Analytical Mindset
11 7 (0.94%) FMCG
11 7 (0.94%) Legacy Systems
12 6 (0.81%) Embedded Systems
12 6 (0.81%) Foreign Exchange (FX)
12 6 (0.81%) Reference Data
12 6 (0.81%) Security Posture
12 6 (0.81%) Social Media
13 5 (0.67%) Operational Technology
Operating Systems
1 30 (4.03%) Windows
2 16 (2.15%) Linux
3 6 (0.81%) Mac OS
4 4 (0.54%) Windows 10
5 3 (0.40%) Red Hat Enterprise Linux
5 3 (0.40%) Windows Server
6 2 (0.27%) zOS
7 1 (0.13%) Android
7 1 (0.13%) Apple iOS
7 1 (0.13%) VMS
7 1 (0.13%) Windows Server 2012
Processes & Methodologies
1 250 (33.60%) Agile
2 204 (27.42%) Stakeholder Management
3 194 (26.08%) Problem-Solving
4 129 (17.34%) Project Delivery
5 101 (13.58%) PRINCE2
6 96 (12.90%) Change Management
7 83 (11.16%) Risk Management
8 75 (10.08%) Migration
9 73 (9.81%) Decision-Making
10 67 (9.01%) Waterfall
11 65 (8.74%) Continuous Improvement
12 63 (8.47%) Roadmaps
13 59 (7.93%) Analytics
13 59 (7.93%) DevOps
14 58 (7.80%) Stakeholder Engagement
15 53 (7.12%) Scrum
16 52 (6.99%) Programme Management
17 50 (6.72%) Budget Management
18 45 (6.05%) ERP
19 41 (5.51%) Resource Allocation
Programming Languages
1 30 (4.03%) Python
2 26 (3.49%) SQL
3 18 (2.42%) JavaScript
4 15 (2.02%) Java
5 12 (1.61%) PHP
6 8 (1.08%) Bash
7 7 (0.94%) C#
8 6 (0.81%) PowerShell
9 5 (0.67%) C
9 5 (0.67%) Embedded C
10 3 (0.40%) VB
11 2 (0.27%) Groovy
11 2 (0.27%) JCL
11 2 (0.27%) REXX
11 2 (0.27%) Ruby
11 2 (0.27%) Shell Script
11 2 (0.27%) TypeScript
12 1 (0.13%) Apex Code
12 1 (0.13%) Bicep
12 1 (0.13%) Go
Qualifications
1 125 (16.80%) Degree
2 100 (13.44%) Security Cleared
3 95 (12.77%) PMI Certification
4 91 (12.23%) PMP
5 81 (10.89%) SC Cleared
6 25 (3.36%) Master's Degree
7 19 (2.55%) Computer Science Degree
8 14 (1.88%) BPSS Clearance
9 13 (1.75%) Microsoft Certification
10 11 (1.48%) DV Cleared
11 7 (0.94%) CISA
11 7 (0.94%) CISSP
11 7 (0.94%) PRINCE2 Certification
12 6 (0.81%) CISM
13 5 (0.67%) APMP
13 5 (0.67%) ISEB
13 5 (0.67%) MBA
13 5 (0.67%) PRINCE2 Practitioner
14 4 (0.54%) AWS Certification
14 4 (0.54%) Azure Certification
Quality Assurance & Compliance
1 56 (7.53%) PMO
2 27 (3.63%) QA
3 22 (2.96%) GDPR
4 16 (2.15%) NIST
5 13 (1.75%) Data Quality
5 13 (1.75%) ISO/IEC 27001
6 12 (1.61%) Sarbanes-Oxley
7 11 (1.48%) Accessibility
8 7 (0.94%) HIPAA
9 4 (0.54%) COBIT
9 4 (0.54%) EMIR
9 4 (0.54%) MiFID
9 4 (0.54%) PCI DSS
10 3 (0.40%) 21 CFR Part 11
10 3 (0.40%) COSO
10 3 (0.40%) P3O
10 3 (0.40%) SLA
11 2 (0.27%) GxP
11 2 (0.27%) ISO 20022
11 2 (0.27%) PMBOK
System Software
1 20 (2.69%) Active Directory
2 8 (1.08%) Docker
2 8 (1.08%) Virtual Machines
2 8 (1.08%) VMware Infrastructure
3 6 (0.81%) Firmware
4 4 (0.54%) vSphere
5 3 (0.40%) Hyper-V
5 3 (0.40%) RACF
5 3 (0.40%) Virtual Servers
6 2 (0.27%) NFS
6 2 (0.27%) Time Sharing Option
7 1 (0.13%) BitLocker
7 1 (0.13%) Microcode
7 1 (0.13%) Microsoft App-V
7 1 (0.13%) OpenAM
7 1 (0.13%) OpenDJ
7 1 (0.13%) OpenIDM
7 1 (0.13%) VMware ESXi
7 1 (0.13%) VMware NSX
7 1 (0.13%) VMware Workstation
Systems Management
1 14 (1.88%) Terraform
2 12 (1.61%) Microsoft Intune
3 9 (1.21%) Kubernetes
4 8 (1.08%) Single Sign-On
5 7 (0.94%) Ansible
6 5 (0.67%) SCCM
7 4 (0.54%) Packer
8 3 (0.40%) Amdocs OSS
8 3 (0.40%) Jamf Pro
8 3 (0.40%) MOM
9 2 (0.27%) Tivoli Storage Manager
10 1 (0.13%) Consul
10 1 (0.13%) FortiGate
10 1 (0.13%) Grafana
10 1 (0.13%) HP Quality Center
10 1 (0.13%) MIIS
10 1 (0.13%) Oracle Enterprise Manager
10 1 (0.13%) Prometheus
10 1 (0.13%) QRadar
10 1 (0.13%) TrustSec
Vendors
1 95 (12.77%) Microsoft
2 72 (9.68%) SAP
3 35 (4.70%) Oracle
4 16 (2.15%) Workday
5 15 (2.02%) Google
6 14 (1.88%) IBM
6 14 (1.88%) Salesforce
7 12 (1.61%) ServiceNow
8 9 (1.21%) Ariba
8 9 (1.21%) Cisco
8 9 (1.21%) VMware
9 7 (0.94%) Adobe
10 4 (0.54%) Apple
10 4 (0.54%) Atlassian
10 4 (0.54%) Databricks
10 4 (0.54%) Dell
10 4 (0.54%) F5
10 4 (0.54%) Informatica
10 4 (0.54%) Juniper
10 4 (0.54%) Planview