Roadmaps Contracts with Work from Home Options

Roadmaps
UK > Work from Home

The table below provides summary statistics for remote or hybrid contract work requiring Roadmaps skills. It includes a benchmarking guide to the contractor rates offered in vacancies that cited Roadmaps over the 6 months leading up to 15 June 2024, comparing them to the same period in the previous two years.

6 months to
15 Jun 2024
Same period 2023 Same period 2022
Rank 45 36 44
Rank change year-on-year -9 +8 +11
Contract jobs citing Roadmaps 591 1,333 2,365
As % of all contract jobs with a WFH option 4.01% 5.58% 5.39%
As % of the Processes & Methodologies category 4.59% 6.23% 5.92%
Number of daily rates quoted 397 975 1,724
10th Percentile £412 £439 £413
25th Percentile £481 £500 £490
Median daily rate (50th Percentile) £563 £600 £585
Median % change year-on-year -6.25% +2.56% +8.33%
75th Percentile £688 £700 £688
90th Percentile £838 £800 £763
UK median daily rate £588 £600 £595
% change year-on-year -2.08% +0.84% +8.18%
Number of hourly rates quoted 9 17 19
10th Percentile £30.99 £35.00 £32.50
25th Percentile £33.63 £37.50 £46.88
Median hourly rate £71.93 £66.00 £70.00
Median % change year-on-year +8.98% -5.71% +137.13%
75th Percentile £75.00 £70.00 £77.50
90th Percentile £84.00 £84.90 £86.20
UK median hourly rate £59.55 £65.00 £45.00
% change year-on-year -8.39% +44.44% -2.70%

All Process and Methodology Skills
Work from Home

Roadmaps falls under the Processes and Methodologies category. For comparison with the information above, the following table provides summary statistics for all contract job vacancies with remote or hybrid options requiring process or methodology skills.

Contract vacancies with a requirement for process or methodology skills 12,871 21,399 39,942
As % of all contract jobs with a WFH option 87.23% 89.63% 91.07%
Number of daily rates quoted 8,673 15,206 29,099
10th Percentile £325 £363 £363
25th Percentile £425 £450 £438
Median daily rate (50th Percentile) £525 £540 £525
Median % change year-on-year -2.78% +2.86% +5.42%
75th Percentile £638 £650 £638
90th Percentile £750 £750 £738
UK median daily rate £525 £550 £538
% change year-on-year -4.55% +2.33% +7.50%
Number of hourly rates quoted 572 495 518
10th Percentile £15.02 £18.49 £14.96
25th Percentile £24.00 £25.75 £20.75
Median hourly rate £43.00 £52.13 £40.00
Median % change year-on-year -17.51% +30.33% +66.67%
75th Percentile £60.00 £67.50 £60.00
90th Percentile £74.95 £78.45 £72.50
UK median hourly rate £37.00 £35.65 £26.00
% change year-on-year +3.79% +37.12% +13.04%

Roadmaps
Trend for Jobs with a WFH Option

Job vacancies with a work from home option citing Roadmaps as a proportion of all IT jobs advertised.
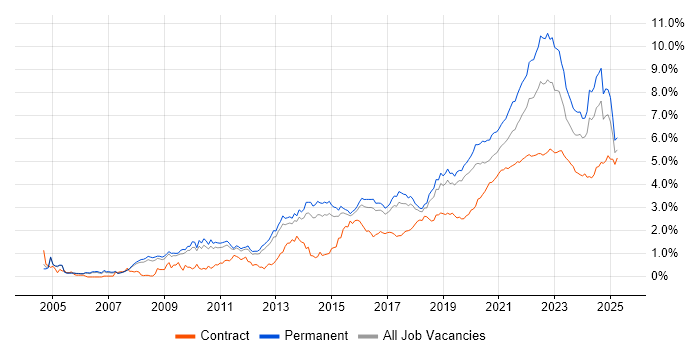
Roadmaps trend for jobs with a WFH option

Roadmaps
Daily Rate Trend for Jobs with a WFH Option

3-month moving average daily rate quoted in job vacancies with a work from home option citing Roadmaps.

Roadmaps daily rate for jobs with a WFH option

Roadmaps
Daily Rate Histogram for Jobs with a WFH Option

Daily rate distribution for jobs with a work from home option citing Roadmaps over the 6 months to 15 June 2024.

Roadmaps daily rate histogram for jobs with a WFH option

Roadmaps
Hourly Rate Trend for Jobs with a WFH Option

3-month moving average hourly rate quoted in job vacancies with a work from home option citing Roadmaps.

Roadmaps hourly rate for jobs with a WFH option

Roadmaps
Hourly Rate Histogram for Jobs with a WFH Option

Hourly rate distribution for jobs with a work from home option citing Roadmaps over the 6 months to 15 June 2024.

Roadmaps hourly rate histogram for jobs with a WFH option

Roadmaps
Co-occurring Skills and Capabilities with WFH Options by Category

The follow tables expand on the table above by listing co-occurrences grouped by category. The same employment type, locality and period is covered with up to 20 co-occurrences shown in each of the following categories:

Application Platforms
1 32 (5.41%) Confluence
2 10 (1.69%) SharePoint
3 7 (1.18%) CMS
3 7 (1.18%) Microsoft Exchange
4 4 (0.68%) Adobe Experience Manager
5 3 (0.51%) Apache Airflow
6 2 (0.34%) Apache
6 2 (0.34%) IIS
6 2 (0.34%) LiveLink
6 2 (0.34%) Oracle Workflow
6 2 (0.34%) SAS
6 2 (0.34%) WebLogic
6 2 (0.34%) WebSphere
7 1 (0.17%) Alfresco
7 1 (0.17%) Apache Spark
7 1 (0.17%) Appian
7 1 (0.17%) Camunda
7 1 (0.17%) GeoServer
Applications
1 17 (2.88%) Microsoft Office
2 9 (1.52%) Microsoft PowerPoint
3 8 (1.35%) Microsoft Excel
4 4 (0.68%) MS Visio
4 4 (0.68%) Spreadsheet
5 2 (0.34%) Chatbot
6 1 (0.17%) Microsoft Project
6 1 (0.17%) PlantUML
6 1 (0.17%) Trello
Business Applications
1 15 (2.54%) SAP S/4HANA
2 12 (2.03%) Dynamics CRM
3 4 (0.68%) Oracle EBS
3 4 (0.68%) Payment Gateway
3 4 (0.68%) SAP FI
4 3 (0.51%) Oracle ERP
4 3 (0.51%) PeopleSoft HCM
4 3 (0.51%) SAP BPC
4 3 (0.51%) SAP CO
4 3 (0.51%) SAP FI/CO
5 2 (0.34%) SAP APO
5 2 (0.34%) SAP ERP
5 2 (0.34%) SAP GTS
5 2 (0.34%) SAP Hybris
5 2 (0.34%) SAP IBP
5 2 (0.34%) SAP MM
5 2 (0.34%) Shopify
6 1 (0.17%) SAP MDG
6 1 (0.17%) Sparx Enterprise Architect
6 1 (0.17%) Workfront
Cloud Services
1 92 (15.57%) Azure
2 82 (13.87%) AWS
3 39 (6.60%) GCP
4 36 (6.09%) Microsoft 365
5 27 (4.57%) SaaS
6 22 (3.72%) Power Platform
7 20 (3.38%) AWS CloudFormation
8 17 (2.88%) PaaS
9 15 (2.54%) Serverless
10 14 (2.37%) Amazon S3
10 14 (2.37%) AWS Lambda
10 14 (2.37%) GitHub
11 12 (2.03%) Dynamics 365
11 12 (2.03%) OpenShift
12 9 (1.52%) Azure DevOps
13 8 (1.35%) Entra ID
13 8 (1.35%) IaaS
13 8 (1.35%) SuccessFactors
14 7 (1.18%) Amazon CloudWatch
14 7 (1.18%) Amazon EC2
Communications & Networking
1 25 (4.23%) Firewall
2 16 (2.71%) Network Security
3 15 (2.54%) DNS
4 12 (2.03%) 5G
4 12 (2.03%) VPN
5 11 (1.86%) 4G
5 11 (1.86%) LAN
5 11 (1.86%) Radio Access Network
5 11 (1.86%) WAN
6 8 (1.35%) TCP/IP
6 8 (1.35%) VoIP
7 7 (1.18%) Cisco Nexus
7 7 (1.18%) SD-WAN
8 6 (1.02%) DHCP
8 6 (1.02%) Wi-Fi
9 5 (0.85%) 3G
9 5 (0.85%) VLAN
10 4 (0.68%) 5G NR
10 4 (0.68%) Cisco ASA
10 4 (0.68%) CTI
Database & Business Intelligence
1 20 (3.38%) Power BI
2 19 (3.21%) PostgreSQL
3 13 (2.20%) MongoDB
4 10 (1.69%) Amazon Aurora
4 10 (1.69%) Elasticsearch
4 10 (1.69%) NoSQL
5 7 (1.18%) Big Data
5 7 (1.18%) SQL Server
6 6 (1.02%) Data Warehouse
6 6 (1.02%) Oracle Database
6 6 (1.02%) Tableau
7 5 (0.85%) Amazon RDS
7 5 (0.85%) Informix
8 4 (0.68%) Amazon Athena
8 4 (0.68%) Amazon Redshift
8 4 (0.68%) GIS
8 4 (0.68%) InfluxDB
9 3 (0.51%) Apache Arrow
9 3 (0.51%) Dremio
9 3 (0.51%) Metadata
Development Applications
1 45 (7.61%) JIRA
2 20 (3.38%) Jenkins
3 11 (1.86%) Git
4 8 (1.35%) Artifactory
4 8 (1.35%) Bitbucket
4 8 (1.35%) GitLab
4 8 (1.35%) TeamCity
5 5 (0.85%) Sonatype Nexus
6 4 (0.68%) Cypress.io
6 4 (0.68%) JMeter
6 4 (0.68%) Postman
6 4 (0.68%) Rational DOORS
7 3 (0.51%) Selenium
8 2 (0.34%) JUnit
8 2 (0.34%) LoadRunner
8 2 (0.34%) SonarQube
9 1 (0.17%) Appium
9 1 (0.17%) Gradle
9 1 (0.17%) NeoLoad
9 1 (0.17%) Terragrunt
General
1 175 (29.61%) Social Skills
2 130 (22.00%) Finance
3 84 (14.21%) Public Sector
4 65 (11.00%) Analytical Skills
5 52 (8.80%) Banking
6 30 (5.08%) Influencing Skills
7 23 (3.89%) Retail
8 22 (3.72%) Marketing
9 20 (3.38%) Inclusion and Diversity
9 20 (3.38%) Legal
9 20 (3.38%) Telecoms
10 17 (2.88%) Manufacturing
11 16 (2.71%) Presentation Skills
12 9 (1.52%) Aerospace
12 9 (1.52%) Pharmaceutical
13 8 (1.35%) Investment Banking
14 6 (1.02%) Police
15 5 (0.85%) Back Office
15 5 (0.85%) Front Office
15 5 (0.85%) Organisational Skills
Job Titles
1 172 (29.10%) Architect
2 75 (12.69%) Senior
3 56 (9.48%) Analyst
3 56 (9.48%) Consultant
4 53 (8.97%) Solutions Architect
5 49 (8.29%) Lead
6 39 (6.60%) Business Analyst
7 37 (6.26%) Product Manager
8 29 (4.91%) Product Owner
9 25 (4.23%) Enterprise Architect
10 24 (4.06%) Developer
11 20 (3.38%) Technical Architect
12 18 (3.05%) Project Manager
12 18 (3.05%) Senior Manager
13 17 (2.88%) Business Architect
14 15 (2.54%) Security Architect
14 15 (2.54%) Senior Architect
15 14 (2.37%) Senior Consultant
16 12 (2.03%) DevOps Engineer
17 11 (1.86%) Senior DevOps
Libraries, Frameworks & Software Standards
1 18 (3.05%) REST
2 17 (2.88%) .NET
2 17 (2.88%) React
3 14 (2.37%) HTML
4 13 (2.20%) AWS CDK
5 11 (1.86%) CSS
6 10 (1.69%) Node.js
6 10 (1.69%) Spring
6 10 (1.69%) Spring Boot
6 10 (1.69%) Web Services
7 7 (1.18%) JSON
7 7 (1.18%) OAuth
7 7 (1.18%) XML
8 6 (1.02%) SAML
8 6 (1.02%) SOAP
9 5 (0.85%) Oracle Fusion
9 5 (0.85%) Redux
9 5 (0.85%) RESTful
10 4 (0.68%) Elastic Stack
10 4 (0.68%) OpenID
Miscellaneous
1 59 (9.98%) Product Ownership
2 16 (2.71%) Enterprise Software
2 16 (2.71%) Management Information System
3 14 (2.37%) Virtual Team
4 13 (2.20%) Data Centre
4 13 (2.20%) Legacy Systems
5 12 (2.03%) Hybrid Cloud
6 11 (1.86%) Public Cloud
6 11 (1.86%) Self-Motivation
7 7 (1.18%) Distributed Systems
7 7 (1.18%) Foreign Exchange (FX)
7 7 (1.18%) Replication
8 6 (1.02%) Cloud Native
8 6 (1.02%) CMDB
8 6 (1.02%) Cyber Threat
8 6 (1.02%) IVR
8 6 (1.02%) Mobile App
9 5 (0.85%) Derivative
9 5 (0.85%) Marketing Technology
9 5 (0.85%) Team-Oriented Environment
Operating Systems
1 36 (6.09%) Linux
2 19 (3.21%) Windows
3 15 (2.54%) Unix
4 12 (2.03%) Apple iOS
5 11 (1.86%) Android
6 8 (1.35%) Red Hat Enterprise Linux
7 5 (0.85%) Ubuntu
8 2 (0.34%) Solaris
8 2 (0.34%) Windows Server 2016
Processes & Methodologies
1 195 (32.99%) Agile
2 105 (17.77%) Strategic Roadmap
3 95 (16.07%) Problem-Solving
4 80 (13.54%) Stakeholder Management
5 76 (12.86%) Product Roadmap
6 75 (12.69%) Analytics
7 73 (12.35%) DevOps
8 59 (9.98%) Migration
9 54 (9.14%) Continuous Improvement
10 52 (8.80%) Project Management
10 52 (8.80%) Scrum
11 51 (8.63%) Technology Roadmap
12 50 (8.46%) Project Delivery
13 47 (7.95%) User Experience
14 45 (7.61%) Business Strategy
14 45 (7.61%) Decision-Making
15 44 (7.45%) Business Analysis
16 43 (7.28%) CI/CD
17 42 (7.11%) Enterprise Architecture
18 40 (6.77%) IT Strategy
Programming Languages
1 51 (8.63%) SQL
2 48 (8.12%) Python
3 39 (6.60%) Java
4 25 (4.23%) JavaScript
5 22 (3.72%) TypeScript
6 19 (3.21%) PowerShell
7 16 (2.71%) C#
8 14 (2.37%) Bash
9 9 (1.52%) C++
10 6 (1.02%) VB.NET
11 5 (0.85%) Shell Script
11 5 (0.85%) VBA
12 3 (0.51%) Perl
12 3 (0.51%) PHP
12 3 (0.51%) VBScript
13 2 (0.34%) C
13 2 (0.34%) Go
13 2 (0.34%) Groovy
13 2 (0.34%) Kotlin
13 2 (0.34%) Ruby
Qualifications
1 91 (15.40%) Security Cleared
2 69 (11.68%) Degree
3 64 (10.83%) SC Cleared
4 19 (3.21%) Computer Science Degree
5 16 (2.71%) DV Cleared
6 13 (2.20%) Cisco Certification
7 11 (1.86%) BPSS Clearance
7 11 (1.86%) CISSP
7 11 (1.86%) Master's Degree
8 8 (1.35%) AWS Certification
9 6 (1.02%) Azure Certification
9 6 (1.02%) CISM
9 6 (1.02%) TOGAF Certification
10 5 (0.85%) CCNA
10 5 (0.85%) CCNP
10 5 (0.85%) CTC Cleared
10 5 (0.85%) PMP
11 4 (0.68%) APMP
11 4 (0.68%) CEH
11 4 (0.68%) HND
Quality Assurance & Compliance
1 18 (3.05%) NIST
1 18 (3.05%) QA
2 16 (2.71%) Accessibility
3 14 (2.37%) PMO
4 11 (1.86%) Data Quality
4 11 (1.86%) SLA
5 6 (1.02%) GDPR
6 5 (0.85%) ISO/IEC 27001
7 4 (0.68%) Cyber Essentials
7 4 (0.68%) Disclosure Scotland
7 4 (0.68%) ISO 9001
8 3 (0.51%) GRC
8 3 (0.51%) PCI DSS
9 2 (0.34%) COBIT
9 2 (0.34%) ISO/IEC 20000
9 2 (0.34%) PSD2
9 2 (0.34%) Sarbanes-Oxley
10 1 (0.17%) California Consumer Privacy Act
10 1 (0.17%) Def Stans
10 1 (0.17%) SOC 2
System Software
1 22 (3.72%) Active Directory
2 11 (1.86%) Docker
3 10 (1.69%) VMware Infrastructure
4 6 (1.02%) Virtual Machines
5 4 (0.68%) vSphere
6 3 (0.51%) Hyper-V
6 3 (0.51%) Virtual Servers
7 2 (0.34%) Ceph
7 2 (0.34%) Veritas Cluster Server
7 2 (0.34%) Virtual Desktop
7 2 (0.34%) VMware NSX
Systems Management
1 27 (4.57%) Terraform
2 23 (3.89%) Ansible
3 20 (3.38%) Kubernetes
4 10 (1.69%) Grafana
5 7 (1.18%) Microsoft Intune
6 6 (1.02%) Red Hat Satellite
7 5 (0.85%) Active Directory Federation Services
8 4 (0.68%) Kibana
8 4 (0.68%) PingFederate
9 3 (0.51%) AirWatch
9 3 (0.51%) SCCM
9 3 (0.51%) SolarWinds Orion
10 2 (0.34%) Argo
10 2 (0.34%) Opsgenie
10 2 (0.34%) Pacemaker
10 2 (0.34%) Podman
10 2 (0.34%) WSUS
11 1 (0.17%) Istio
11 1 (0.17%) logstash
11 1 (0.17%) Packer
Vendors
1 81 (13.71%) Microsoft
2 37 (6.26%) SAP
3 26 (4.40%) Oracle
4 21 (3.55%) Google
5 18 (3.05%) Cisco
6 16 (2.71%) ServiceNow
7 12 (2.03%) Salesforce
7 12 (2.03%) VMware
8 11 (1.86%) Red Hat
9 10 (1.69%) Atlassian
10 9 (1.52%) Palo Alto
11 8 (1.35%) LogRhythm
12 7 (1.18%) Adobe
12 7 (1.18%) Cadence
12 7 (1.18%) Informatica
12 7 (1.18%) Splunk
13 6 (1.02%) IBM
13 6 (1.02%) Ping Identity
14 5 (0.85%) Hyperion
14 5 (0.85%) Nokia