Hybrid/Remote Stakeholder Engagement Contract Job Trends

Stakeholder Engagement
UK > Work from Home

The table below provides summary statistics and contractor rates for remote or hybrid contract work requiring Stakeholder Engagement skills. It covers vacancies from the 6 months leading up to 19 September 2025, with comparisons to the same periods in the previous two years.

6 months to
19 Sep 2025
Same period 2024 Same period 2023
Rank 30 152 147
Rank change year-on-year +122 -5 +19
Contract jobs citing Stakeholder Engagement 627 195 351
As % of all contract jobs with a WFH option 6.39% 1.53% 1.74%
As % of the Processes & Methodologies category 6.92% 1.74% 1.94%
Number of daily rates quoted 434 138 263
10th Percentile £350 £359 £401
25th Percentile £436 £425 £463
Median daily rate (50th Percentile) £525 £550 £550
Median % change year-on-year -4.55% - -
75th Percentile £625 £662 £644
90th Percentile £720 £750 £725
UK median daily rate £535 £550 £550
% change year-on-year -2.73% - -
Number of hourly rates quoted 13 1 7
10th Percentile £30.90 - £44.10
25th Percentile £32.05 - £53.50
Median hourly rate £47.00 £60.60 £66.00
Median % change year-on-year -22.44% -8.18% +25.71%
75th Percentile £59.00 - £76.25
90th Percentile £70.03 - -
UK median hourly rate £44.91 £58.30 £56.49
% change year-on-year -22.97% +3.20% +94.79%

All Process and Methodology Skills
Work from Home

Stakeholder Engagement falls under the Processes and Methodologies category. For comparison with the information above, the following table provides summary statistics for all contract job vacancies with remote or hybrid options requiring process or methodology skills.

Contract vacancies with a requirement for process or methodology skills 9,058 11,179 18,064
As % of all contract jobs with a WFH option 92.25% 87.88% 89.42%
Number of daily rates quoted 6,025 7,137 12,723
10th Percentile £325 £325 £350
25th Percentile £413 £425 £438
Median daily rate (50th Percentile) £508 £525 £535
Median % change year-on-year -3.24% -1.87% -2.73%
75th Percentile £625 £638 £650
90th Percentile £738 £750 £750
UK median daily rate £500 £525 £540
% change year-on-year -4.76% -2.78% -1.82%
Number of hourly rates quoted 277 298 434
10th Percentile £12.62 £18.04 £17.75
25th Percentile £20.50 £30.03 £26.24
Median hourly rate £37.28 £43.00 £52.50
Median % change year-on-year -13.30% -18.10% +5.00%
75th Percentile £65.00 £66.92 £70.00
90th Percentile £68.00 £75.00 £82.20
UK median hourly rate £25.15 £43.00 £43.79
% change year-on-year -41.51% -1.81% +51.53%

Stakeholder Engagement
Trend for Jobs with a WFH Option

Job vacancies with remote working options citing Stakeholder Engagement as a proportion of all IT jobs advertised.
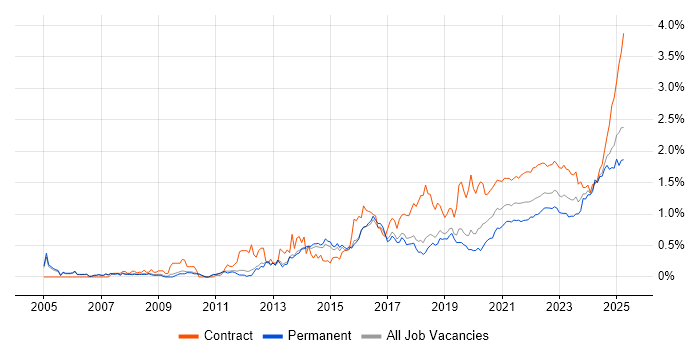
Stakeholder Engagement trend for jobs with Hybrid/Remote/WFH options

Stakeholder Engagement
Daily Rate Trend for Jobs with Hybrid Work Options

Contractor daily rate distribution trend for jobs with remote work options citing Stakeholder Engagement.

Contractor daily rate distribution trend for jobs with remote work options citing Stakeholder Engagement

Stakeholder Engagement
Daily Rate Histogram for Jobs with a WFH Option

Daily rate distribution for jobs with remote working options citing Stakeholder Engagement over the 6 months to 19 September 2025.

Stakeholder Engagement daily rate histogram for jobs with a WFH option

Stakeholder Engagement
Hourly Rate Trend for Jobs with Hybrid Work Options

Contractor hourly rate distribution trend for jobs with remote work options citing Stakeholder Engagement.

Contractor hourly rate distribution trend for jobs with remote work options citing Stakeholder Engagement

Stakeholder Engagement
Hourly Rate Histogram for Jobs with a WFH Option

Hourly rate distribution for jobs with remote working options citing Stakeholder Engagement over the 6 months to 19 September 2025.

Stakeholder Engagement hourly rate histogram for jobs with a WFH option

Stakeholder Engagement
Co-occurring Skills and Capabilities with WFH Options by Category

The follow tables expand on the table above by listing co-occurrences grouped by category. The same employment type, locality and period is covered with up to 20 co-occurrences shown in each of the following categories:

Application Platforms
1 31 (4.94%) SharePoint
2 28 (4.47%) Confluence
3 5 (0.80%) Apache
3 5 (0.80%) Apache Spark
3 5 (0.80%) ArcGIS
3 5 (0.80%) CMS
3 5 (0.80%) Microsoft Exchange
4 4 (0.64%) Apache Airflow
5 1 (0.16%) CICS
5 1 (0.16%) IIS
5 1 (0.16%) nginx
5 1 (0.16%) SAS
Applications
1 35 (5.58%) Microsoft Excel
2 18 (2.87%) Microsoft Project
3 15 (2.39%) Microsoft PowerPoint
3 15 (2.39%) MS Visio
4 9 (1.44%) Microsoft Office
5 1 (0.16%) Oracle Smart View
5 1 (0.16%) Sketch
5 1 (0.16%) Spreadsheet
5 1 (0.16%) SPSS
5 1 (0.16%) Trello
Business Applications
1 15 (2.39%) SAP S/4HANA
2 8 (1.28%) Dynamics CRM
3 6 (0.96%) NEC Housing
4 5 (0.80%) CA PPM
5 4 (0.64%) Maximo
5 4 (0.64%) NetSuite
5 4 (0.64%) Oracle EBS
5 4 (0.64%) Oracle EBS R12
5 4 (0.64%) Oracle Financials
5 4 (0.64%) Remedy ITSM
5 4 (0.64%) SAP GTS
6 3 (0.48%) SAP CO
6 3 (0.48%) SAP ERP
6 3 (0.48%) Sparx Enterprise Architect
6 3 (0.48%) Workday HCM
7 2 (0.32%) Aladdin
7 2 (0.32%) Oracle Cash Management
7 2 (0.32%) Oracle Payables
7 2 (0.32%) Salesforce CRM
7 2 (0.32%) SAP FI/CO
Cloud Services
1 102 (16.27%) Azure
2 51 (8.13%) AWS
3 46 (7.34%) Power Platform
4 31 (4.94%) Azure DevOps
5 28 (4.47%) Microsoft 365
6 21 (3.35%) SaaS
7 20 (3.19%) Dynamics 365
8 18 (2.87%) Entra ID
9 16 (2.55%) GCP
10 14 (2.23%) GitHub
11 12 (1.91%) SuccessFactors
12 11 (1.75%) PaaS
13 10 (1.59%) GitHub Actions
14 9 (1.44%) Serverless
15 8 (1.28%) Amazon S3
16 7 (1.12%) Azure Logic Apps
16 7 (1.12%) Figma
16 7 (1.12%) IaaS
17 6 (0.96%) Azure Synapse Analytics
17 6 (0.96%) Smartsheet
Communications & Networking
1 20 (3.19%) Firewall
2 13 (2.07%) Network Security
3 8 (1.28%) SD-WAN
4 6 (0.96%) VPN
4 6 (0.96%) WAN
5 4 (0.64%) 5G
6 3 (0.48%) Intranet
6 3 (0.48%) SSL
7 2 (0.32%) BGP
7 2 (0.32%) DNS
7 2 (0.32%) IPsec
7 2 (0.32%) Kerberos
7 2 (0.32%) MQTT
7 2 (0.32%) OSPF
8 1 (0.16%) 4G
8 1 (0.16%) DHCP
8 1 (0.16%) F5 BIG-IP LTM
8 1 (0.16%) tcpdump
8 1 (0.16%) Wireless
8 1 (0.16%) Wireshark
Database & Business Intelligence
1 39 (6.22%) Power BI
2 18 (2.87%) Data Warehouse
3 15 (2.39%) Metadata
4 10 (1.59%) Tableau
5 6 (0.96%) Azure SQL Database
5 6 (0.96%) Oracle Database
5 6 (0.96%) SQL Server
6 5 (0.80%) Big Data
6 5 (0.80%) Data Lake
6 5 (0.80%) Relational Database
7 4 (0.64%) Amazon RDS
7 4 (0.64%) Amazon Redshift
7 4 (0.64%) Data Vault
7 4 (0.64%) Delta Lake
7 4 (0.64%) Snowflake Schema
8 3 (0.48%) GIS
9 2 (0.32%) Amazon Athena
9 2 (0.32%) Apache Iceberg
9 2 (0.32%) Azure SQL Data Warehouse
9 2 (0.32%) PostgreSQL
Development Applications
1 56 (8.93%) JIRA
2 9 (1.44%) Git
2 9 (1.44%) Jenkins
3 6 (0.96%) GitLab
4 4 (0.64%) REST Assured
5 3 (0.48%) Cypress.io
5 3 (0.48%) Postman
5 3 (0.48%) Selenium
6 2 (0.32%) Gradle
6 2 (0.32%) Hudson
6 2 (0.32%) SpecFlow
6 2 (0.32%) Terragrunt
6 2 (0.32%) TestRail
7 1 (0.16%) Artifactory
7 1 (0.16%) CircleCI
7 1 (0.16%) Gatling
7 1 (0.16%) Metasploit
7 1 (0.16%) Robot Framework
7 1 (0.16%) ScriptRunner
7 1 (0.16%) Visual Studio Code
General
1 318 (50.72%) Social Skills
2 162 (25.84%) Finance
3 104 (16.59%) Public Sector
4 82 (13.08%) Analytical Skills
5 35 (5.58%) Manufacturing
6 31 (4.94%) Banking
7 28 (4.47%) Legal
8 25 (3.99%) Influencing Skills
8 25 (3.99%) Telecoms
9 23 (3.67%) Retail
10 22 (3.51%) Local Government
11 16 (2.55%) Inclusion and Diversity
11 16 (2.55%) Marketing
12 15 (2.39%) Organisational Skills
13 14 (2.23%) Documentation Skills
14 12 (1.91%) Presentation Skills
15 9 (1.44%) Billing
15 9 (1.44%) Financial Institution
16 8 (1.28%) Pharmaceutical
17 7 (1.12%) Electronics
Job Titles
1 116 (18.50%) Analyst
2 83 (13.24%) Business Analyst
3 78 (12.44%) Architect
4 69 (11.00%) Consultant
5 67 (10.69%) Project Manager
6 66 (10.53%) Senior
7 55 (8.77%) Lead
8 31 (4.94%) Solutions Architect
9 19 (3.03%) Designer
10 17 (2.71%) Change Manager
10 17 (2.71%) Data Analyst
11 15 (2.39%) Developer
11 15 (2.39%) IT Manager
11 15 (2.39%) Security Architect
11 15 (2.39%) Service Designer
12 14 (2.23%) Senior Manager
12 14 (2.23%) Test Manager
13 12 (1.91%) Enterprise Architect
13 12 (1.91%) Senior Analyst
14 11 (1.75%) Infrastructure Manager
Libraries, Frameworks & Software Standards
1 19 (3.03%) REST
2 10 (1.59%) HTML
3 9 (1.44%) RFC 2544
4 8 (1.28%) .NET
4 8 (1.28%) SOAP
5 7 (1.12%) CSS
5 7 (1.12%) Web Services
6 6 (0.96%) JSON
6 6 (0.96%) LDAP
6 6 (0.96%) OAuth
6 6 (0.96%) SailPoint
7 5 (0.80%) SAML
8 4 (0.64%) ARM Templates
8 4 (0.64%) Kafka
8 4 (0.64%) Playwright
8 4 (0.64%) RabbitMQ
9 3 (0.48%) AngularJS
9 3 (0.48%) Apache Camel
9 3 (0.48%) Lightning Web Components
9 3 (0.48%) OpenID
Miscellaneous
1 35 (5.58%) Product Ownership
2 29 (4.63%) Legacy Systems
3 23 (3.67%) Cloud Native
3 23 (3.67%) Data Centre
3 23 (3.67%) Onboarding
4 21 (3.35%) Management Information System
5 13 (2.07%) Analytical Mindset
6 12 (1.91%) Life Science
7 11 (1.75%) Enterprise Software
7 11 (1.75%) Self-Motivation
8 9 (1.44%) Greenfield Project
8 9 (1.44%) Renewable Energy
9 8 (1.28%) FMCG
9 8 (1.28%) Security Posture
10 7 (1.12%) NHS
10 7 (1.12%) Operational Technology
10 7 (1.12%) Virtual Team
11 5 (0.80%) Data Structures
11 5 (0.80%) Hybrid Cloud
11 5 (0.80%) Learning Management System
Operating Systems
1 15 (2.39%) Windows
2 6 (0.96%) Windows 10
3 3 (0.48%) Mac OS
4 2 (0.32%) Windows Server
5 1 (0.16%) Android
5 1 (0.16%) Apple iOS
5 1 (0.16%) Linux
5 1 (0.16%) Windows Server 2019
5 1 (0.16%) Windows XP
Processes & Methodologies
1 183 (29.19%) Agile
2 116 (18.50%) Stakeholder Management
3 83 (13.24%) Problem-Solving
4 82 (13.08%) Migration
5 80 (12.76%) Continuous Improvement
6 77 (12.28%) Risk Management
7 76 (12.12%) Change Management
8 69 (11.00%) Roadmaps
9 66 (10.53%) DevOps
10 63 (10.05%) Project Management
11 61 (9.73%) Decision-Making
12 60 (9.57%) Project Delivery
13 56 (8.93%) Business Intelligence
13 56 (8.93%) Requirements Gathering
13 56 (8.93%) Workshop Facilitation
14 54 (8.61%) ERP
15 53 (8.45%) User Acceptance Testing
16 52 (8.29%) CI/CD
17 46 (7.34%) Cybersecurity
18 45 (7.18%) Data Governance
Programming Languages
1 46 (7.34%) SQL
2 27 (4.31%) Python
3 17 (2.71%) PowerShell
4 12 (1.91%) JavaScript
5 9 (1.44%) Bicep
6 7 (1.12%) Java
7 6 (0.96%) C#
7 6 (0.96%) TypeScript
8 5 (0.80%) Bash
8 5 (0.80%) R
9 3 (0.48%) Apex Code
9 3 (0.48%) Data Analysis Expressions
9 3 (0.48%) PL/SQL
10 2 (0.32%) Korn
10 2 (0.32%) Scala
11 1 (0.16%) ActionScript 2.0
11 1 (0.16%) BeanShell
11 1 (0.16%) Groovy
11 1 (0.16%) JCL
11 1 (0.16%) X++
Qualifications
1 121 (19.30%) Security Cleared
2 90 (14.35%) SC Cleared
3 59 (9.41%) Degree
4 25 (3.99%) PMI Certification
5 24 (3.83%) PMP
6 20 (3.19%) BPSS Clearance
7 15 (2.39%) Azure Certification
7 15 (2.39%) DV Cleared
8 14 (2.23%) Microsoft Certification
9 9 (1.44%) CISM
9 9 (1.44%) Computer Science Degree
10 8 (1.28%) AWS Certification
10 8 (1.28%) CISSP
11 5 (0.80%) ACCA
12 4 (0.64%) APMG
12 4 (0.64%) CBAP
12 4 (0.64%) CISA
12 4 (0.64%) Cisco Certification
12 4 (0.64%) ISTQB
12 4 (0.64%) Six Sigma Green Belt
Quality Assurance & Compliance
1 40 (6.38%) Data Quality
2 38 (6.06%) QA
3 37 (5.90%) GDPR
4 27 (4.31%) ISO/IEC 27001
4 27 (4.31%) PMO
5 20 (3.19%) Accessibility
6 19 (3.03%) NIST
7 7 (1.12%) NCSC
8 6 (0.96%) GxP
9 5 (0.80%) GRC
9 5 (0.80%) IFRS
10 4 (0.64%) COBIT
10 4 (0.64%) Cyber Essentials
10 4 (0.64%) JSP 440
10 4 (0.64%) Sarbanes-Oxley
10 4 (0.64%) SLA
10 4 (0.64%) WCAG
11 3 (0.48%) Cyber Essentials PLUS
11 3 (0.48%) PCI DSS
12 2 (0.32%) ISO/IEC 19770
System Software
1 19 (3.03%) Active Directory
2 10 (1.59%) Docker
3 7 (1.12%) VMware Infrastructure
4 3 (0.48%) Virtual Desktop
5 1 (0.16%) Virtual Machines
5 1 (0.16%) VMware ESXi
5 1 (0.16%) VMware NSX
5 1 (0.16%) vSphere
Systems Management
1 27 (4.31%) Terraform
2 12 (1.91%) Kubernetes
3 10 (1.59%) Microsoft Intune
4 9 (1.44%) SCCM
5 8 (1.28%) Single Sign-On
6 5 (0.80%) Grafana
6 5 (0.80%) Prometheus
7 3 (0.48%) Amdocs OSS
8 2 (0.32%) Ansible
8 2 (0.32%) HP ALM
9 1 (0.16%) Argo
9 1 (0.16%) CASB
9 1 (0.16%) Nessus
9 1 (0.16%) PowerCLI
9 1 (0.16%) SCOM
9 1 (0.16%) vCenter Server
Vendors
1 103 (16.43%) Microsoft
2 56 (8.93%) SAP
3 36 (5.74%) ServiceNow
4 29 (4.63%) Salesforce
5 28 (4.47%) Oracle
6 14 (2.23%) Workday
7 11 (1.75%) Cisco
8 9 (1.44%) Databricks
8 9 (1.44%) Google
9 8 (1.28%) VMware
10 6 (0.96%) Ariba
10 6 (0.96%) NEC
10 6 (0.96%) Planview
11 5 (0.80%) Adobe
11 5 (0.80%) Citrix
11 5 (0.80%) HP
11 5 (0.80%) Palo Alto
11 5 (0.80%) Snow
12 4 (0.64%) IBM
12 4 (0.64%) Progress