Investment Banking Jobs in London

Investment Banking
England > London

The table below looks at the prevalence of the term Investment Banking in permanent job vacancies in London. Included is a benchmarking guide to the salaries offered in vacancies that cited Investment Banking over the 6 months leading up to 26 July 2024, comparing them to the same period in the previous two years.

6 months to
26 Jul 2024
Same period 2023 Same period 2022
Rank 88 144 414
Rank change year-on-year +56 +270 -150
Permanent jobs citing Investment Banking 744 645 689
As % of all permanent jobs advertised in London 3.59% 2.38% 0.92%
As % of the General category 5.22% 3.51% 1.30%
Number of salaries quoted 714 461 490
10th Percentile £77,500 £61,250 £59,875
25th Percentile £95,000 £77,500 £70,000
Median annual salary (50th Percentile) £115,000 £115,000 £90,000
Median % change year-on-year - +27.78% +2.86%
75th Percentile £148,750 £142,500 £115,000
90th Percentile £165,000 £157,500 £135,000
England median annual salary £115,000 £110,000 £85,000
% change year-on-year +4.55% +29.41% -

All General Skills
London

Investment Banking falls under the General Skills category. For comparison with the information above, the following table provides summary statistics for all permanent job vacancies requiring common skills in London.

Permanent vacancies with a requirement for common skills 14,244 18,353 53,034
As % of all permanent jobs advertised in London 68.68% 67.67% 70.70%
Number of salaries quoted 9,429 13,938 24,332
10th Percentile £37,000 £41,250 £41,250
25th Percentile £51,250 £53,750 £52,500
Median annual salary (50th Percentile) £72,500 £73,993 £70,000
Median % change year-on-year -2.02% +5.70% -
75th Percentile £95,000 £95,000 £92,500
90th Percentile £122,500 £120,000 £112,500
England median annual salary £55,000 £60,000 £60,000
% change year-on-year -8.33% - +4.35%

Investment Banking
Job Vacancy Trend in London

Job postings citing Investment Banking as a proportion of all IT jobs advertised in London.
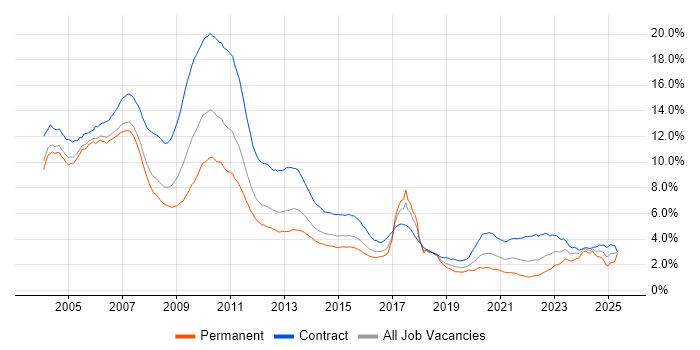
Job vacancy trend for Investment Banking in London

Investment Banking
Salary Trend in London

3-month moving average salary quoted in jobs citing Investment Banking in London.

Salary trend for Investment Banking in London

Investment Banking
Salary Histogram in London

Salary distribution for jobs citing Investment Banking in London over the 6 months to 26 July 2024.

Salary histogram for Investment Banking in London

Investment Banking
Job Locations in London

The table below looks at the demand and provides a guide to the median salaries quoted in IT jobs citing Investment Banking within the London region over the 6 months to 26 July 2024. The 'Rank Change' column provides an indication of the change in demand within each location based on the same 6 month period last year.

Location Rank Change
on Same Period
Last Year
Matching
Permanent
IT Job Ads
Median Salary
Past 6 Months
Median Salary
% Change
on Same Period
Last Year
Live
Jobs
Central London -4 37 £82,500 -25.00% 9
East London +23 1 £90,000 - 2
Investment Banking
England

Investment Banking
Co-occurring Skills and Capabilities in London by Category

The follow tables expand on the table above by listing co-occurrences grouped by category. The same employment type, locality and period is covered with up to 20 co-occurrences shown in each of the following categories:

Application Platforms
1 521 (70.03%) Apache
2 483 (64.92%) Apache Airflow
3 4 (0.54%) CMS
3 4 (0.54%) Confluence
4 1 (0.13%) Adobe Experience Manager
4 1 (0.13%) Apache Spark
4 1 (0.13%) Documentum
4 1 (0.13%) GemFire
4 1 (0.13%) IIS
4 1 (0.13%) Microsoft Exchange
4 1 (0.13%) Oracle Coherence
4 1 (0.13%) SharePoint
Applications
1 5 (0.67%) Microsoft Excel
2 3 (0.40%) Microsoft Office
2 3 (0.40%) Microsoft PowerPoint
3 1 (0.13%) Adobe Creative Suite
3 1 (0.13%) Adobe Illustrator
3 1 (0.13%) InDesign
3 1 (0.13%) Photoshop
Business Applications
1 39 (5.24%) Aladdin
2 4 (0.54%) Eagle PACE
2 4 (0.54%) Markit EDM
Cloud Services
1 579 (77.82%) AWS
2 519 (69.76%) dbt
3 463 (62.23%) Snowflake
4 237 (31.85%) GCP
5 76 (10.22%) Amazon ECS
6 72 (9.68%) Amazon EC2
6 72 (9.68%) Amazon EKS
7 41 (5.51%) Power Platform
8 18 (2.42%) Azure
9 10 (1.34%) Microsoft 365
10 4 (0.54%) Amazon SQS
10 4 (0.54%) AWS Lambda
10 4 (0.54%) AWS Step Functions
10 4 (0.54%) Firebase
10 4 (0.54%) Serverless
11 3 (0.40%) Microsoft Purview
11 3 (0.40%) Power Automate
11 3 (0.40%) PowerApps
12 2 (0.27%) Amazon EMR
12 2 (0.27%) Amazon S3
Communications & Networking
1 13 (1.75%) Firewall
2 12 (1.61%) Remote Desktop
3 8 (1.08%) VPN
4 6 (0.81%) Cisco ASA
5 4 (0.54%) LAN
5 4 (0.54%) Unified Communications
5 4 (0.54%) WAN
6 2 (0.27%) DHCP
6 2 (0.27%) DNS
6 2 (0.27%) Internet
7 1 (0.13%) HTTP
7 1 (0.13%) SSH
Database & Business Intelligence
1 521 (70.03%) Apache Arrow
2 519 (69.76%) Dremio
3 498 (66.94%) Data Lake
4 485 (65.19%) Amazon Athena
5 483 (64.92%) Apache Ignite
6 41 (5.51%) Power BI
7 37 (4.97%) Tableau
8 31 (4.17%) Big Data
9 7 (0.94%) SQL Server Analysis Services
9 7 (0.94%) SQL Server Reporting Services
10 5 (0.67%) SQL Server
11 4 (0.54%) KDB
11 4 (0.54%) NoSQL
12 3 (0.40%) Data Warehouse
12 3 (0.40%) Hadoop
13 2 (0.27%) Apache Cassandra
13 2 (0.27%) MongoDB
13 2 (0.27%) MySQL
13 2 (0.27%) OLAP
13 2 (0.27%) OLTP
Development Applications
1 12 (1.61%) GitLab
1 12 (1.61%) Jenkins
2 8 (1.08%) Git
3 6 (0.81%) Maven
4 5 (0.67%) JIRA
5 4 (0.54%) Crashlytics
6 3 (0.40%) TeamCity
7 2 (0.27%) ERwin
7 2 (0.27%) MagicDraw
8 1 (0.13%) Bitbucket
8 1 (0.13%) Cucumber
8 1 (0.13%) FitNesse
8 1 (0.13%) JUnit
8 1 (0.13%) Octopus Deploy
8 1 (0.13%) Selenium
8 1 (0.13%) SonarQube
8 1 (0.13%) WebDriver
General
1 744 (100.00%) Banking
2 646 (86.83%) Finance
3 621 (83.47%) Front Office
4 31 (4.17%) Social Skills
5 15 (2.02%) Analytical Skills
6 12 (1.61%) Law
7 10 (1.34%) Financial Institution
8 8 (1.08%) Inclusion and Diversity
9 7 (0.94%) Marketing
10 6 (0.81%) Legal
10 6 (0.81%) Publishing
11 5 (0.67%) Back Office
12 4 (0.54%) Advertising
12 4 (0.54%) Corporate Banking
13 3 (0.40%) Presentation Skills
14 2 (0.27%) Influencing Skills
14 2 (0.27%) Mandarin Language
15 1 (0.13%) Automotive
15 1 (0.13%) Games
15 1 (0.13%) Organisational Skills
Job Titles
1 301 (40.46%) Software Engineer
2 214 (28.76%) Lead
3 200 (26.88%) AWS Engineer
4 199 (26.75%) AWS Software Engineer
5 190 (25.54%) Developer
6 186 (25.00%) Python Engineer
7 185 (24.87%) Java Engineer
8 184 (24.73%) Java Software Engineer
8 184 (24.73%) Python Software Engineer
9 180 (24.19%) Senior
10 151 (20.30%) Senior Software Engineer
11 120 (16.13%) Developer/Software Engineer
12 116 (15.59%) Software Developer
13 110 (14.78%) Architect
14 108 (14.52%) Team Leader
15 107 (14.38%) Lead Developer
15 107 (14.38%) Lead Software Engineer
15 107 (14.38%) Software Team Leader
16 106 (14.25%) Lead Software Developer
16 106 (14.25%) Solutions Architect
Libraries, Frameworks & Software Standards
1 483 (64.92%) Pandas
2 481 (64.65%) gRPC
2 481 (64.65%) NumPy
2 481 (64.65%) Protocol Buffers
2 481 (64.65%) SciPy
3 72 (9.68%) PySpark
4 22 (2.96%) AngularJS
5 18 (2.42%) .NET
6 16 (2.15%) React
7 15 (2.02%) HTML
7 15 (2.02%) Spring
8 13 (1.75%) REST
9 12 (1.61%) XML
10 10 (1.34%) ASP.NET
10 10 (1.34%) FIX Protocol
11 9 (1.21%) JSON
11 9 (1.21%) SOAP
11 9 (1.21%) Spring Boot
12 8 (1.08%) JSP
12 8 (1.08%) Servlets
Miscellaneous
1 582 (78.23%) Fixed Income
2 566 (76.08%) Equities
2 566 (76.08%) Foreign Exchange (FX)
3 561 (75.40%) Hedge funds
4 559 (75.13%) Derivative
5 75 (10.08%) Product Ownership
6 72 (9.68%) Pricing Data
7 12 (1.61%) Distributed Systems
8 10 (1.34%) Market Risk
9 9 (1.21%) Reference Data
10 7 (0.94%) Cloud Native
10 7 (0.94%) Data Centre
11 6 (0.81%) Public Cloud
12 5 (0.67%) Equity Derivative
12 5 (0.67%) Greenfield Project
13 4 (0.54%) Cyber Kill Chain
13 4 (0.54%) Legacy Applications
13 4 (0.54%) Mobile App
13 4 (0.54%) Virtual Team
14 3 (0.40%) Algorithms
Operating Systems
1 47 (6.32%) Windows
2 33 (4.44%) Linux
3 20 (2.69%) Red Hat Enterprise Linux
4 18 (2.42%) Windows Server
5 13 (1.75%) Unix
6 4 (0.54%) Android
6 4 (0.54%) Apple iOS
6 4 (0.54%) Windows XP
7 3 (0.40%) Windows 10
8 2 (0.27%) AIX
8 2 (0.27%) Debian
Processes & Methodologies
1 605 (81.32%) Agile
2 575 (77.28%) Asset Management
3 504 (67.74%) Software Engineering
4 410 (55.11%) Investment Management
5 206 (27.69%) Line Management
6 175 (23.52%) Greeks
7 83 (11.16%) Analytics
8 81 (10.89%) Migration
9 45 (6.05%) Artificial Intelligence
9 45 (6.05%) Fintech
10 44 (5.91%) Business Analysis
10 44 (5.91%) Roadmaps
11 42 (5.65%) Business Intelligence
11 42 (5.65%) Machine Learning
12 36 (4.84%) Electronic Trading
13 33 (4.44%) Multithreading
14 32 (4.30%) Problem-Solving
15 29 (3.90%) Low Latency
16 28 (3.76%) Mentoring
17 26 (3.49%) DevOps
Programming Languages
1 600 (80.65%) Python
2 553 (74.33%) Java
3 514 (69.09%) JavaScript
4 492 (66.13%) TypeScript
5 179 (24.06%) SQL
6 24 (3.23%) Ruby
7 23 (3.09%) Bash
8 22 (2.96%) Perl
9 18 (2.42%) C#
10 17 (2.28%) PowerShell
11 13 (1.75%) Scala
12 12 (1.61%) Korn
13 5 (0.67%) C++
13 5 (0.67%) Kotlin
14 4 (0.54%) Swift
15 2 (0.27%) VBA
16 1 (0.13%) Formula Language
16 1 (0.13%) Shell Script
16 1 (0.13%) VBScript
16 1 (0.13%) XAML
Qualifications
1 29 (3.90%) Degree
2 10 (1.34%) Computer Science Degree
3 6 (0.81%) Master's Degree
4 2 (0.27%) Azure Certification
4 2 (0.27%) MBA
4 2 (0.27%) MCSA
4 2 (0.27%) Microsoft Certification
5 1 (0.13%) AWS Certification
5 1 (0.13%) CBAP
5 1 (0.13%) CCAB
5 1 (0.13%) CFA
5 1 (0.13%) CISA
5 1 (0.13%) CISM
5 1 (0.13%) CISSP
5 1 (0.13%) IIBA
5 1 (0.13%) PhD
5 1 (0.13%) QiCA
Quality Assurance & Compliance
1 184 (24.73%) Data Quality
2 8 (1.08%) SLA
3 4 (0.54%) NIST
4 3 (0.40%) QA
5 1 (0.13%) COBIT
5 1 (0.13%) ISO/IEC 27001
5 1 (0.13%) ITGC
5 1 (0.13%) MiFID
5 1 (0.13%) PMO
System Software
1 15 (2.02%) Docker
2 13 (1.75%) VMware Infrastructure
3 12 (1.61%) XenApp
3 12 (1.61%) XenDesktop
4 3 (0.40%) Active Directory
5 2 (0.27%) VMware ESXi
5 2 (0.27%) VMware NSX
5 2 (0.27%) vSphere
6 1 (0.13%) GridGain
6 1 (0.13%) Microsoft Virtual Server
6 1 (0.13%) Virtual Servers
Systems Management
1 21 (2.82%) Ansible
2 17 (2.28%) Puppet
2 17 (2.28%) Terraform
3 13 (1.75%) Kubernetes
4 12 (1.61%) Red Hat Satellite
5 7 (0.94%) Single Sign-On
6 4 (0.54%) Grafana
7 2 (0.27%) ZABBIX
8 1 (0.13%) Active Directory Federation Services
8 1 (0.13%) Control-M
8 1 (0.13%) Microsoft Intune
8 1 (0.13%) PowerCLI
8 1 (0.13%) SCCM
8 1 (0.13%) SCOM
8 1 (0.13%) vCenter Server
Vendors
1 102 (13.71%) Bloomberg
2 64 (8.60%) Reuters
3 35 (4.70%) BISAM
4 28 (3.76%) Microsoft
5 20 (2.69%) Red Hat
6 19 (2.55%) Citrix
6 19 (2.55%) VMware
7 12 (1.61%) TOWER Software
8 10 (1.34%) Cisco
9 6 (0.81%) Fortinet
9 6 (0.81%) Oracle
9 6 (0.81%) Palo Alto
9 6 (0.81%) ServiceNow
10 4 (0.54%) Amplitude
10 4 (0.54%) Splunk
11 3 (0.40%) HP
11 3 (0.40%) Murex
11 3 (0.40%) Sybase
12 2 (0.27%) Adobe
12 2 (0.27%) Sun