Infrastructure as Code Job Trends in the UK excluding London

Infrastructure as Code (IaC, Infra as Code)
UK > UK excluding London

The table below provides summary statistics and salary benchmarking for jobs advertised in the UK excluding London requiring Infrastructure as Code skills. It covers vacancies from the 6 months leading up to 16 September 2025, with comparisons to the same periods in the previous two years.

6 months to
16 Sep 2025
Same period 2024 Same period 2023
Rank 216 153 106
Rank change year-on-year -63 -47 +37
Permanent jobs citing Infrastructure as Code 457 911 1,060
As % of all permanent jobs advertised in the UK excluding London 1.33% 1.65% 3.01%
As % of the Processes & Methodologies category 1.54% 2.10% 3.19%
Number of salaries quoted 324 597 810
10th Percentile £50,000 £40,000 £46,306
25th Percentile £57,500 £50,000 £55,000
Median annual salary (50th Percentile) £70,000 £65,000 £67,500
Median % change year-on-year +7.69% -3.70% +3.85%
75th Percentile £83,750 £77,500 £82,500
90th Percentile £95,000 £87,500 £96,539
UK median annual salary £75,000 £70,000 £72,500
% change year-on-year +7.14% -3.45% -3.33%

All Process and Methodology Skills
UK excluding London

Infrastructure as Code falls under the Processes and Methodologies category. For comparison with the information above, the following table provides summary statistics for all permanent job vacancies requiring process or methodology skills in the UK excluding London.

Permanent vacancies with a requirement for process or methodology skills 29,726 43,366 33,273
As % of all permanent jobs advertised in the UK excluding London 86.66% 78.46% 94.51%
Number of salaries quoted 16,010 23,501 23,769
10th Percentile £26,748 £30,000 £29,440
25th Percentile £32,500 £40,000 £40,000
Median annual salary (50th Percentile) £47,500 £52,500 £54,000
Median % change year-on-year -9.52% -2.78% +2.86%
75th Percentile £65,000 £67,500 £68,750
90th Percentile £80,000 £80,000 £81,250
UK median annual salary £55,000 £57,500 £60,000
% change year-on-year -4.35% -4.17% -

Infrastructure as Code
Job Vacancy Trend in the UK excluding London

Job postings citing Infrastructure as Code as a proportion of all IT jobs advertised in the UK excluding London.
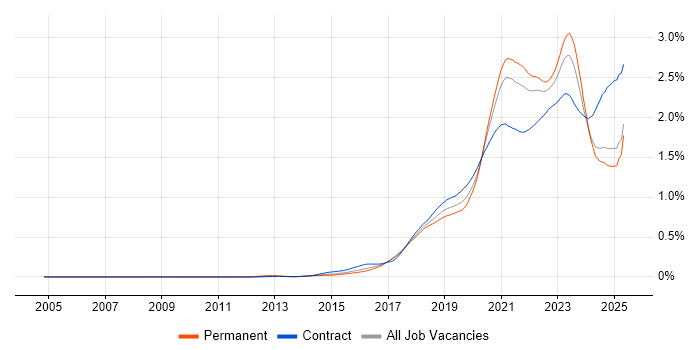
Job vacancy trend for Infrastructure as Code in the UK excluding London

Infrastructure as Code
Salary Trend in the UK excluding London

Salary distribution trend for jobs in the UK excluding London citing Infrastructure as Code.

Salary distribution trend for jobs in the UK excluding London citing Infrastructure as Code

Infrastructure as Code
Salary Histogram in the UK excluding London

Salary distribution for jobs citing Infrastructure as Code in the UK excluding London over the 6 months to 16 September 2025.

Salary histogram for Infrastructure as Code in the UK excluding London

Infrastructure as Code
Job Locations in the UK excluding London

The table below looks at the demand and provides a guide to the median salaries quoted in IT jobs citing Infrastructure as Code within the UK excluding London region over the 6 months to 16 September 2025. The 'Rank Change' column provides an indication of the change in demand within each location based on the same 6 month period last year.

Location Rank Change
on Same Period
Last Year
Matching
Permanent
IT Job Ads
Median Salary
Past 6 Months
Median Salary
% Change
on Same Period
Last Year
Live
Jobs
North of England -57 142 £70,000 +16.67% 141
South East -4 113 £82,500 +37.50% 203
North West -54 75 £65,000 -3.70% 73
Midlands -20 60 £65,000 -1.52% 31
Yorkshire -29 58 £70,000 +27.27% 41
South West -29 58 £75,000 +5.26% 56
Scotland +41 42 £70,000 -15.15% 47
West Midlands -3 41 £64,500 -7.86% 17
East of England +2 34 £65,000 -10.34% 21
East Midlands -7 19 £65,000 +13.04% 14
Wales +17 9 £57,500 -4.17% 11
North East -5 9 £72,500 +45.00% 27
Northern Ireland +14 1 £43,092 -28.18% 8
Infrastructure as Code
UK

Infrastructure as Code
Co-occurring Skills and Capabilities in the UK excluding London by Category

The follow tables expand on the table above by listing co-occurrences grouped by category. The same employment type, locality and period is covered with up to 20 co-occurrences shown in each of the following categories:

Application Platforms
1 15 (3.28%) Apache Spark
1 15 (3.28%) Microsoft Exchange
2 14 (3.06%) SharePoint
3 13 (2.84%) Apache Airflow
4 12 (2.63%) Confluence
5 10 (2.19%) Apache
6 9 (1.97%) Appian
7 3 (0.66%) nginx
8 1 (0.22%) OpenStack
8 1 (0.22%) SAS
Applications
1 5 (1.09%) Microsoft PowerPoint
2 4 (0.88%) Microsoft Excel
3 2 (0.44%) Simulink
4 1 (0.22%) Microsoft Office
4 1 (0.22%) Microsoft Project
4 1 (0.22%) MS Visio
Business Applications
1 4 (0.88%) Dynamics CRM
2 2 (0.44%) Dynamics GP
Cloud Services
1 290 (63.46%) Azure
2 254 (55.58%) AWS
3 114 (24.95%) Azure DevOps
4 81 (17.72%) GCP
5 62 (13.57%) SaaS
6 54 (11.82%) AWS CloudFormation
7 49 (10.72%) GitHub
8 47 (10.28%) PaaS
8 47 (10.28%) Serverless
9 44 (9.63%) Entra ID
10 43 (9.41%) IaaS
10 43 (9.41%) Microsoft 365
11 37 (8.10%) Power Platform
12 33 (7.22%) Amazon S3
12 33 (7.22%) AWS Lambda
12 33 (7.22%) GitHub Actions
12 33 (7.22%) Power Automate
13 31 (6.78%) Azure Monitor
14 29 (6.35%) Amazon EC2
15 23 (5.03%) Amazon CloudWatch
Communications & Networking
1 46 (10.07%) Firewall
2 44 (9.63%) VPN
2 44 (9.63%) WAN
3 39 (8.53%) DNS
4 24 (5.25%) LAN
5 23 (5.03%) SD-WAN
6 11 (2.41%) DHCP
6 11 (2.41%) Network Security
7 9 (1.97%) TCP/IP
7 9 (1.97%) Wi-Fi
8 7 (1.53%) VLAN
9 6 (1.31%) Unified Communications
9 6 (1.31%) VoIP
10 5 (1.09%) SAN
11 4 (0.88%) BGP
11 4 (0.88%) Internet
12 3 (0.66%) AMQP
12 3 (0.66%) F5 BIG-IP LTM
12 3 (0.66%) OSPF
13 2 (0.44%) MQTT
Database & Business Intelligence
1 31 (6.78%) Data Lake
2 26 (5.69%) SQL Server
3 24 (5.25%) NoSQL
4 19 (4.16%) Big Data
4 19 (4.16%) MySQL
5 18 (3.94%) Amazon RDS
5 18 (3.94%) Power BI
6 12 (2.63%) Data Warehouse
7 8 (1.75%) DynamoDB
7 8 (1.75%) Hadoop
8 7 (1.53%) PostgreSQL
8 7 (1.53%) Relational Database
9 4 (0.88%) Airbyte
9 4 (0.88%) Qlik Sense
9 4 (0.88%) Tableau
10 3 (0.66%) InfluxDB
10 3 (0.66%) MongoDB
11 2 (0.44%) Amazon Aurora
11 2 (0.44%) Amazon Redshift
11 2 (0.44%) Redis
Development Applications
1 57 (12.47%) Jenkins
2 52 (11.38%) Git
3 45 (9.85%) GitLab
4 16 (3.50%) JIRA
5 15 (3.28%) SonarQube
6 13 (2.84%) Selenium
7 11 (2.41%) CircleCI
8 10 (2.19%) JUnit
8 10 (2.19%) Snyk
9 9 (1.97%) Robot Framework
10 7 (1.53%) Maven
10 7 (1.53%) Sonatype Nexus
11 6 (1.31%) TeamCity
12 5 (1.09%) Artifactory
12 5 (1.09%) Bitbucket
13 4 (0.88%) Subversion
14 3 (0.66%) Cucumber
14 3 (0.66%) MSTest
14 3 (0.66%) NUnit
14 3 (0.66%) Octopus Deploy
General
1 97 (21.23%) Social Skills
2 67 (14.66%) Finance
3 33 (7.22%) Law
4 29 (6.35%) Inclusion and Diversity
5 26 (5.69%) Analytical Skills
6 12 (2.63%) Automotive
6 12 (2.63%) Public Sector
7 11 (2.41%) Banking
8 9 (1.97%) Advertising
8 9 (1.97%) Telecoms
9 8 (1.75%) Legal
9 8 (1.75%) Retail
10 7 (1.53%) Games
11 5 (1.09%) Documentation Skills
11 5 (1.09%) Financial Institution
12 3 (0.66%) Agriculture
12 3 (0.66%) Health Technology
13 2 (0.44%) Billing
13 2 (0.44%) Manufacturing
14 1 (0.22%) Publishing
Job Titles
1 97 (21.23%) Senior
2 74 (16.19%) Cloud Engineer
3 65 (14.22%) Architect
4 60 (13.13%) DevOps Engineer
5 59 (12.91%) Lead
6 33 (7.22%) Developer
7 31 (6.78%) Cloud Architect
8 30 (6.56%) Infrastructure Engineer
8 30 (6.56%) Software Engineer
9 29 (6.35%) Azure Engineer
9 29 (6.35%) Senior Cloud Engineer
10 27 (5.91%) Platform Engineer
11 23 (5.03%) Cloud Infrastructure Engineer
12 19 (4.16%) Senior Infrastructure Engineer
12 19 (4.16%) Senior Software Engineer
13 15 (3.28%) AWS Engineer
14 14 (3.06%) Solutions Architect
15 13 (2.84%) Senior DevOps
16 12 (2.63%) Site Reliability Engineer
17 11 (2.41%) Full-Stack Developer
Libraries, Frameworks & Software Standards
1 51 (11.16%) .NET
2 36 (7.88%) React
3 24 (5.25%) Kafka
3 24 (5.25%) REST
4 22 (4.81%) ARM Templates
5 17 (3.72%) RESTful
6 15 (3.28%) Elastic Stack
7 14 (3.06%) .NET Framework
8 13 (2.84%) Spring
8 13 (2.84%) YAML
9 12 (2.63%) .NET Core
9 12 (2.63%) HTML5 Canvas
9 12 (2.63%) SOAP
10 11 (2.41%) Node.js
10 11 (2.41%) OAuth
10 11 (2.41%) Spring Boot
11 10 (2.19%) Entity Framework
12 9 (1.97%) Apache NiFi
12 9 (1.97%) SAML
13 8 (1.75%) OAuth2
Miscellaneous
1 100 (21.88%) Cloud Native
2 39 (8.53%) Public Cloud
3 36 (7.88%) Data Centre
4 34 (7.44%) Hybrid Cloud
5 27 (5.91%) Product Ownership
6 18 (3.94%) Legacy Systems
7 17 (3.72%) Private Cloud
8 14 (3.06%) NHS
9 13 (2.84%) Enterprise Software
9 13 (2.84%) Management Information System
10 11 (2.41%) Onboarding
10 11 (2.41%) Security Posture
11 9 (1.97%) Distributed Systems
11 9 (1.97%) Low-Code
12 8 (1.75%) Data Protection Act
12 8 (1.75%) Data Structures
12 8 (1.75%) Greenfield Project
13 7 (1.53%) IoT
13 7 (1.53%) Operational Technology
14 6 (1.31%) Linux Command Line
Operating Systems
1 78 (17.07%) Linux
2 36 (7.88%) Windows
3 17 (3.72%) Windows Server
4 15 (3.28%) Debian
4 15 (3.28%) Ubuntu
5 10 (2.19%) Unix
6 7 (1.53%) VMS
7 4 (0.88%) Red Hat Enterprise Linux
8 2 (0.44%) AIX
8 2 (0.44%) CentOS
Processes & Methodologies
1 310 (67.83%) DevOps
2 273 (59.74%) CI/CD
3 164 (35.89%) Agile
4 85 (18.60%) Containerisation
5 83 (18.16%) Mentoring
6 78 (17.07%) Artificial Intelligence
7 76 (16.63%) Roadmaps
8 71 (15.54%) Software Engineering
9 70 (15.32%) Continuous Improvement
10 64 (14.00%) Problem-Solving
11 60 (13.13%) Test Automation
12 59 (12.91%) Analytics
13 58 (12.69%) Microservices
14 55 (12.04%) Infrastructure Engineering
15 53 (11.60%) Technical Leadership
16 50 (10.94%) Migration
17 46 (10.07%) Observability
18 45 (9.85%) Platform Engineering
19 44 (9.63%) Configuration Management
20 43 (9.41%) Cloud Security
Programming Languages
1 171 (37.42%) Python
2 95 (20.79%) SQL
3 92 (20.13%) PowerShell
4 63 (13.79%) Bash
5 57 (12.47%) Bicep
6 52 (11.38%) JavaScript
7 49 (10.72%) C#
8 43 (9.41%) Java
9 30 (6.56%) Go
10 26 (5.69%) TypeScript
11 6 (1.31%) R
12 5 (1.09%) Shell Script
13 4 (0.88%) Julia
13 4 (0.88%) Ruby
13 4 (0.88%) Rust
13 4 (0.88%) VBA
14 3 (0.66%) C++
14 3 (0.66%) Perl
14 3 (0.66%) PHP
14 3 (0.66%) VB
Qualifications
1 66 (14.44%) Security Cleared
2 55 (12.04%) Azure Certification
3 46 (10.07%) SC Cleared
4 40 (8.75%) AWS Certification
5 35 (7.66%) Degree
6 27 (5.91%) DV Cleared
7 17 (3.72%) Cisco Certification
7 17 (3.72%) Computer Science Degree
8 14 (3.06%) CCNP
8 14 (3.06%) DBS Check
8 14 (3.06%) Master's Degree
9 12 (2.63%) AWS Certified Solutions Architect
10 7 (1.53%) CCNA
11 6 (1.31%) PMI Certification
11 6 (1.31%) PMP
12 4 (0.88%) Microsoft Certification
13 3 (0.66%) BPSS Clearance
13 3 (0.66%) ISTQB
14 2 (0.44%) AWS Certified Cloud Practitioner
14 2 (0.44%) CISSP
Quality Assurance & Compliance
1 19 (4.16%) NIST
2 17 (3.72%) GDPR
3 11 (2.41%) QA
4 10 (2.19%) ISO/IEC 27001
5 7 (1.53%) California Consumer Privacy Act
6 3 (0.66%) HIPAA
7 2 (0.44%) Accessibility
7 2 (0.44%) Data Quality
7 2 (0.44%) PCI DSS
7 2 (0.44%) SOC 2
8 1 (0.22%) NCSC
System Software
1 120 (26.26%) Docker
2 33 (7.22%) Virtual Machines
3 24 (5.25%) VMware Infrastructure
4 15 (3.28%) Active Directory
5 13 (2.84%) Virtual Desktop
6 8 (1.75%) VMware ESXi
7 6 (1.31%) Hyper-V
8 4 (0.88%) vCloud
8 4 (0.88%) vSphere
9 3 (0.66%) Virtual Servers
10 2 (0.44%) Firmware
11 1 (0.22%) HDFS
11 1 (0.22%) iptables
Systems Management
1 302 (66.08%) Terraform
2 152 (33.26%) Kubernetes
3 108 (23.63%) Ansible
4 42 (9.19%) Prometheus
5 39 (8.53%) Grafana
6 18 (3.94%) Single Sign-On
7 17 (3.72%) Microsoft Intune
8 9 (1.97%) Argo
8 9 (1.97%) Docker Swarm
9 8 (1.75%) Progress Chef
10 7 (1.53%) Istio
10 7 (1.53%) Puppet
11 5 (1.09%) MaaS360
11 5 (1.09%) SCCM
12 4 (0.88%) Rundeck
12 4 (0.88%) ZABBIX
13 2 (0.44%) Control-M
13 2 (0.44%) Graylog
13 2 (0.44%) Proxmox
13 2 (0.44%) Salt
Vendors
1 102 (22.32%) Microsoft
2 37 (8.10%) VMware
3 27 (5.91%) Databricks
4 24 (5.25%) Cisco
5 20 (4.38%) Google
5 20 (4.38%) Palo Alto
6 19 (4.16%) Fortinet
7 16 (3.50%) Meraki
8 15 (3.28%) Splunk
9 14 (3.06%) Aruba
10 13 (2.84%) Mellanox
10 13 (2.84%) NVIDIA
11 10 (2.19%) Salesforce
12 9 (1.97%) BiZZdesign
12 9 (1.97%) Black Duck
12 9 (1.97%) UiPath
13 6 (1.31%) Oracle
13 6 (1.31%) Red Hat
13 6 (1.31%) ServiceNow
14 5 (1.09%) SolarWinds