Microservices Jobs in the UK excluding London

Microservices
UK > UK excluding London

The table below provides summary statistics for permanent job vacancies advertised in the UK excluding London requiring Microservices skills. It includes a benchmarking guide to the annual salaries offered in vacancies that cited Microservices over the 6 months leading up to 25 April 2025, comparing them to the same period in the previous two years.

6 months to
25 Apr 2025
Same period 2024 Same period 2023
Rank 104 68 78
Rank change year-on-year -36 +10 -14
Permanent jobs citing Microservices 952 2,611 2,572
As % of all permanent jobs advertised in the UK excluding London 2.60% 3.74% 4.13%
As % of the Processes & Methodologies category 2.82% 4.42% 4.32%
Number of salaries quoted 696 1,831 1,536
10th Percentile £47,500 £42,500 £46,250
25th Percentile £56,250 £50,000 £52,500
Median annual salary (50th Percentile) £70,000 £62,500 £67,500
Median % change year-on-year +12.00% -7.41% +12.50%
75th Percentile £85,000 £75,625 £82,500
90th Percentile £100,000 £91,250 £95,000
UK median annual salary £74,870 £65,000 £78,142
% change year-on-year +15.18% -16.82% +4.19%

All Process and Methodology Skills
UK excluding London

Microservices falls under the Processes and Methodologies category. For comparison with the information above, the following table provides summary statistics for all permanent job vacancies requiring process or methodology skills in the UK excluding London.

Permanent vacancies with a requirement for process or methodology skills 33,809 59,116 59,507
As % of all permanent jobs advertised in the UK excluding London 92.18% 84.56% 95.62%
Number of salaries quoted 17,728 41,079 30,443
10th Percentile £27,750 £27,250 £30,500
25th Percentile £38,750 £36,250 £40,000
Median annual salary (50th Percentile) £52,500 £50,000 £55,000
Median % change year-on-year +5.00% -9.09% +4.76%
75th Percentile £66,206 £65,000 £70,000
90th Percentile £79,000 £77,500 £82,500
UK median annual salary £57,500 £55,000 £61,900
% change year-on-year +4.55% -11.15% +3.17%

Microservices
Job Vacancy Trend in the UK excluding London

Job postings citing Microservices as a proportion of all IT jobs advertised in the UK excluding London.
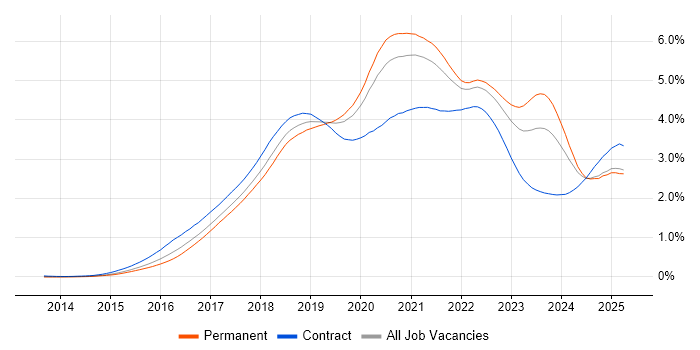
Job vacancy trend for Microservices in the UK excluding London

Microservices
Salary Trend in the UK excluding London

3-month moving average salary quoted in jobs citing Microservices in the UK excluding London.

Salary trend for Microservices in the UK excluding London

Microservices
Salary Histogram in the UK excluding London

Salary distribution for jobs citing Microservices in the UK excluding London over the 6 months to 25 April 2025.

Salary histogram for Microservices in the UK excluding London

Microservices
Job Locations in the UK excluding London

The table below looks at the demand and provides a guide to the median salaries quoted in IT jobs citing Microservices within the UK excluding London region over the 6 months to 25 April 2025. The 'Rank Change' column provides an indication of the change in demand within each location based on the same 6 month period last year.

Location Rank Change
on Same Period
Last Year
Matching
Permanent
IT Job Ads
Median Salary
Past 6 Months
Median Salary
% Change
on Same Period
Last Year
Live
Jobs
South East -7 288 £67,500 +12.50% 190
North of England -39 283 £70,000 +12.00% 254
North West -36 175 £67,037 +3.13% 164
Scotland -18 124 £75,000 +15.38% 87
South West -2 108 £68,525 +13.26% 88
Yorkshire -7 96 £72,246 +18.04% 69
Midlands -54 96 £65,000 +8.33% 116
West Midlands -52 58 £70,000 +7.69% 66
East Midlands 0 38 £65,000 +18.18% 46
East of England -34 37 £57,500 -11.54% 73
Wales +10 12 £67,000 +27.62% 22
North East -7 12 £50,000 -18.31% 24
Northern Ireland +7 7 £55,000 -15.38% 23
Microservices
UK

Microservices
Co-occurring Skills and Capabilities in the UK excluding London by Category

The follow tables expand on the table above by listing co-occurrences grouped by category. The same employment type, locality and period is covered with up to 20 co-occurrences shown in each of the following categories:

Application Platforms
1 38 (3.99%) Confluence
2 23 (2.42%) Jupyter
3 17 (1.79%) JBoss
4 12 (1.26%) Red Hat Fuse
5 11 (1.16%) CMS
6 7 (0.74%) OpenStack
6 7 (0.74%) SAS
7 6 (0.63%) Apache
7 6 (0.63%) Apache Spark
7 6 (0.63%) Headless CMS
8 4 (0.42%) GemFire
9 3 (0.32%) IIS
9 3 (0.32%) NetWeaver
9 3 (0.32%) SharePoint
10 2 (0.21%) Adobe Experience Manager
10 2 (0.21%) NServiceBus
10 2 (0.21%) Oracle SOA Suite
10 2 (0.21%) Sitecore CMS
11 1 (0.11%) ColdFusion
11 1 (0.11%) Umbraco
Applications
1 9 (0.95%) Microsoft Office
2 2 (0.21%) Adobe XD
2 2 (0.21%) Moqups
2 2 (0.21%) Sketch
3 1 (0.11%) Chatbot
3 1 (0.11%) Microsoft Excel
3 1 (0.11%) Microsoft PowerPoint
3 1 (0.11%) MS Visio
Business Applications
1 9 (0.95%) Dynamics CRM
2 2 (0.21%) Oracle EBS
3 1 (0.11%) Payment Gateway
3 1 (0.11%) Sprinklr
Cloud Services
1 389 (40.86%) AWS
2 365 (38.34%) Azure
3 164 (17.23%) GCP
4 141 (14.81%) Serverless
5 94 (9.87%) SaaS
6 79 (8.30%) Azure DevOps
7 63 (6.62%) AWS Lambda
8 54 (5.67%) Amazon EKS
9 52 (5.46%) Azure Service Bus
10 48 (5.04%) Azure Cosmos DB
11 47 (4.94%) Amazon ECS
12 46 (4.83%) Amazon EC2
13 36 (3.78%) GitHub
14 35 (3.68%) SonarCloud
15 34 (3.57%) Amazon S3
16 24 (2.52%) AWS CloudFormation
17 21 (2.21%) Salesforce Sales Cloud
18 20 (2.10%) Amazon SQS
18 20 (2.10%) Cloud Computing
18 20 (2.10%) npm
Communications & Networking
1 16 (1.68%) Internet
2 7 (0.74%) Network Security
3 4 (0.42%) DAB
3 4 (0.42%) TCP/IP
4 3 (0.32%) HTTP
5 2 (0.21%) Broadband
6 1 (0.11%) DNS
6 1 (0.11%) MQTT
6 1 (0.11%) VoIP
6 1 (0.11%) VSAN
6 1 (0.11%) Wireshark
Database & Business Intelligence
1 161 (16.91%) NoSQL
2 121 (12.71%) PostgreSQL
3 114 (11.97%) MongoDB
4 90 (9.45%) Relational Database
5 80 (8.40%) SQL Server
6 62 (6.51%) Elasticsearch
7 54 (5.67%) MySQL
8 52 (5.46%) Big Data
9 45 (4.73%) DynamoDB
10 33 (3.47%) RDBMS
11 32 (3.36%) Redis
12 18 (1.89%) Data Lake
13 14 (1.47%) Data Warehouse
14 13 (1.37%) Amazon RDS
15 11 (1.16%) Azure SQL Database
16 8 (0.84%) Metadata
17 7 (0.74%) Apache Cassandra
17 7 (0.74%) SQL Server Integration Services
18 6 (0.63%) Data Vault
19 4 (0.42%) Apache Ignite
Development Applications
1 190 (19.96%) Git
2 137 (14.39%) Jenkins
3 85 (8.93%) JUnit
4 62 (6.51%) Visual Studio
5 52 (5.46%) Mockito
6 51 (5.36%) JIRA
7 50 (5.25%) Octopus Deploy
8 49 (5.15%) GitLab
9 36 (3.78%) MSBuild
10 35 (3.68%) Team Foundation Server
11 34 (3.57%) SonarQube
12 28 (2.94%) Maven
12 28 (2.94%) Sonatype Nexus
13 25 (2.63%) Jasmine
13 25 (2.63%) Karma Test Runner
14 23 (2.42%) webpack
15 22 (2.31%) JMeter
16 21 (2.21%) IntelliJ
16 21 (2.21%) Protractor
17 20 (2.10%) Eclipse
General
1 248 (26.05%) Social Skills
2 247 (25.95%) Finance
3 168 (17.65%) Banking
4 73 (7.67%) Law
5 64 (6.72%) Retail
6 56 (5.88%) Inclusion and Diversity
7 53 (5.57%) Public Sector
8 35 (3.68%) Marketing
9 30 (3.15%) Analytical Skills
10 11 (1.16%) Automotive
10 11 (1.16%) Tech for Good
11 9 (0.95%) Financial Institution
11 9 (0.95%) Influencing Skills
12 8 (0.84%) Front Office
12 8 (0.84%) Games
13 7 (0.74%) Investment Banking
13 7 (0.74%) Organisational Skills
13 7 (0.74%) Presentation Skills
13 7 (0.74%) Telecoms
14 5 (0.53%) Advertising
Job Titles
1 333 (34.98%) Developer
2 209 (21.95%) Senior
3 184 (19.33%) Architect
4 178 (18.70%) Lead
5 150 (15.76%) Software Engineer
6 102 (10.71%) Java Developer
7 90 (9.45%) Solutions Architect
8 84 (8.82%) Senior Developer
9 72 (7.56%) Full-Stack Developer
10 70 (7.35%) .NET Developer
11 53 (5.57%) Senior Software Engineer
12 44 (4.62%) Technical Architect
13 42 (4.41%) Java Engineer
14 40 (4.20%) C# Developer
15 37 (3.89%) Software Developer
16 31 (3.26%) Enterprise Architect
17 25 (2.63%) AWS Engineer
17 25 (2.63%) Backend Developer
17 25 (2.63%) Senior Architect
18 23 (2.42%) Senior Data Scientist
Libraries, Frameworks & Software Standards
1 255 (26.79%) React
2 228 (23.95%) .NET
3 213 (22.37%) REST
4 160 (16.81%) Spring
4 160 (16.81%) Spring Boot
5 157 (16.49%) RESTful
6 142 (14.92%) HTML
7 136 (14.29%) AngularJS
7 136 (14.29%) CSS
8 130 (13.66%) Node.js
9 113 (11.87%) Kafka
10 95 (9.98%) Web Services
11 87 (9.14%) .NET Core
11 87 (9.14%) ASP.NET
12 72 (7.56%) RabbitMQ
13 71 (7.46%) Hibernate
14 67 (7.04%) .NET Framework
15 60 (6.30%) GraphQL
15 60 (6.30%) JSON
16 56 (5.88%) gRPC
Miscellaneous
1 91 (9.56%) Distributed Systems
2 84 (8.82%) Product Ownership
3 64 (6.72%) Algorithms
4 56 (5.88%) Cloud Native
5 53 (5.57%) Enterprise Software
6 43 (4.52%) Management Information System
7 41 (4.31%) Public Cloud
8 29 (3.05%) Data Structures
9 28 (2.94%) Greenfield Project
10 26 (2.73%) Cyberattack
11 24 (2.52%) Mobile App
12 22 (2.31%) Private Cloud
13 20 (2.10%) Virtual Team
14 19 (2.00%) IoT
15 17 (1.79%) Legacy Code
16 16 (1.68%) Legacy Systems
17 13 (1.37%) Distributed Architecture
18 10 (1.05%) Reference Data
18 10 (1.05%) Replication
19 9 (0.95%) Online Banking
Operating Systems
1 73 (7.67%) Linux
2 19 (2.00%) Unix
3 18 (1.89%) Android
4 9 (0.95%) Windows
5 7 (0.74%) Apple iOS
6 2 (0.21%) Windows Server
Processes & Methodologies
1 509 (53.47%) Agile
2 389 (40.86%) DevOps
3 348 (36.55%) Software Engineering
4 333 (34.98%) CI/CD
5 209 (21.95%) Containerisation
6 193 (20.27%) Full-Stack Development
7 187 (19.64%) TDD
8 179 (18.80%) Mentoring
9 177 (18.59%) Problem-Solving
10 162 (17.02%) Event-Driven
11 157 (16.49%) Test Automation
12 151 (15.86%) Roadmaps
13 146 (15.34%) Scrum
14 130 (13.66%) Unit Testing
15 128 (13.45%) Design Patterns
16 124 (13.03%) Event-Driven Architecture
17 123 (12.92%) Technical Leadership
18 112 (11.76%) Computer Science
19 108 (11.34%) Code Quality
20 105 (11.03%) Continuous Integration
Programming Languages
1 376 (39.50%) Java
2 270 (28.36%) JavaScript
3 242 (25.42%) C#
4 205 (21.53%) SQL
5 168 (17.65%) TypeScript
6 166 (17.44%) Python
7 51 (5.36%) Go
8 44 (4.62%) C
9 32 (3.36%) PHP
10 22 (2.31%) Shell Script
11 21 (2.21%) Apex Code
12 20 (2.10%) C++
13 14 (1.47%) Bash
14 13 (1.37%) PowerShell
15 12 (1.26%) Kotlin
15 12 (1.26%) Rust
16 11 (1.16%) Ruby
17 10 (1.05%) Perl
18 8 (0.84%) R
19 5 (0.53%) Groovy
Qualifications
1 154 (16.18%) Degree
2 85 (8.93%) Security Cleared
3 78 (8.19%) Computer Science Degree
4 51 (5.36%) SC Cleared
5 32 (3.36%) Master's Degree
6 28 (2.94%) DV Cleared
7 22 (2.31%) HND
8 18 (1.89%) AWS Certification
9 12 (1.26%) AWS Certified Solutions Architect
9 12 (1.26%) Azure Certification
10 5 (0.53%) TOGAF Certification
11 4 (0.42%) AWS Certified Developer
12 3 (0.32%) Microsoft Certification
12 3 (0.32%) OCP
12 3 (0.32%) Oracle Certification
13 2 (0.21%) AWS Certified Cloud Practitioner
13 2 (0.21%) Cisco Certification
13 2 (0.21%) CISM
13 2 (0.21%) CISSP
13 2 (0.21%) CompTIA Security+
Quality Assurance & Compliance
1 51 (5.36%) GDPR
2 48 (5.04%) QA
3 29 (3.05%) Data Quality
4 21 (2.21%) Accessibility
5 12 (1.26%) SLA
6 7 (0.74%) Basel II
6 7 (0.74%) Basel III
6 7 (0.74%) Dodd-Frank
6 7 (0.74%) HIPAA
6 7 (0.74%) IFRS
6 7 (0.74%) IFRS 9
6 7 (0.74%) PCI DSS
7 4 (0.42%) NIST
7 4 (0.42%) SOC 2
8 2 (0.21%) CDISC
8 2 (0.21%) ISO 20022
8 2 (0.21%) SEPA
8 2 (0.21%) TARGET2
9 1 (0.11%) Actionable Recommendations
9 1 (0.11%) NCSC
System Software
1 380 (39.92%) Docker
2 29 (3.05%) Virtual Machines
3 5 (0.53%) Active Directory
4 3 (0.32%) Firmware
5 2 (0.21%) HDFS
5 2 (0.21%) Postfix
6 1 (0.11%) Slurm Workload Manager
6 1 (0.11%) VMware Infrastructure
6 1 (0.11%) VMware NSX
Systems Management
1 336 (35.29%) Kubernetes
2 101 (10.61%) Terraform
3 28 (2.94%) Grafana
4 26 (2.73%) Ansible
5 22 (2.31%) Kibana
6 21 (2.21%) Prometheus
7 14 (1.47%) Istio
8 6 (0.63%) Argo
9 5 (0.53%) Progress Chef
10 3 (0.32%) Packer
11 2 (0.21%) Hadoop YARN
11 2 (0.21%) Single Sign-On
12 1 (0.11%) Control-M
12 1 (0.11%) Microsoft Intune
Vendors
1 76 (7.98%) Microsoft
2 50 (5.25%) Google
3 35 (3.68%) IBM
4 28 (2.94%) Dynatrace
5 23 (2.42%) Splunk
6 21 (2.21%) Salesforce
6 21 (2.21%) Salesforce Marketing Cloud
7 19 (2.00%) Oracle
8 10 (1.05%) Atlassian
8 10 (1.05%) Databricks
9 9 (0.95%) Cisco
10 7 (0.74%) ANSYS
10 7 (0.74%) Apple
11 5 (0.53%) Bloomberg
11 5 (0.53%) Ping Identity
12 4 (0.42%) Adobe
12 4 (0.42%) NVIDIA
12 4 (0.42%) Solace
12 4 (0.42%) TIBCO
13 3 (0.32%) SAP