Containerisation Jobs in the UK excluding London

Containerization
UK > UK excluding London

The table below provides summary statistics for permanent job vacancies advertised in the UK excluding London requiring Containerisation skills. It includes a benchmarking guide to the annual salaries offered in vacancies that cited Containerisation over the 6 months leading up to 15 June 2025, comparing them to the same period in the previous two years.

6 months to
15 Jun 2025
Same period 2024 Same period 2023
Rank 154 223 95
Rank change year-on-year +69 -128 +66
Permanent jobs citing Containerisation 836 955 1,860
As % of all permanent jobs advertised in the UK excluding London 2.11% 1.18% 3.39%
As % of the Processes & Methodologies category 2.31% 1.47% 3.55%
Number of salaries quoted 361 682 616
10th Percentile £47,500 £42,525 £40,000
25th Percentile £56,590 £50,000 £49,813
Median annual salary (50th Percentile) £65,000 £62,500 £65,000
Median % change year-on-year +4.00% -3.85% +6.57%
75th Percentile £82,500 £80,000 £80,000
90th Percentile £102,410 £87,500 £87,750
UK median annual salary £77,310 £70,000 £70,000
% change year-on-year +10.44% - -

All Process and Methodology Skills
UK excluding London

Containerisation falls under the Processes and Methodologies category. For comparison with the information above, the following table provides summary statistics for all permanent job vacancies requiring process or methodology skills in the UK excluding London.

Permanent vacancies with a requirement for process or methodology skills 36,233 65,053 52,380
As % of all permanent jobs advertised in the UK excluding London 91.36% 80.61% 95.51%
Number of salaries quoted 17,672 43,939 28,266
10th Percentile £26,000 £27,500 £30,500
25th Percentile £35,000 £36,250 £40,000
Median annual salary (50th Percentile) £50,055 £50,000 £55,000
Median % change year-on-year +0.11% -9.09% +4.76%
75th Percentile £65,000 £65,000 £70,000
90th Percentile £77,500 £77,500 £81,250
UK median annual salary £55,015 £55,000 £60,800
% change year-on-year +0.03% -9.54% +1.33%

Containerisation
Job Vacancy Trend in the UK excluding London

Job postings citing Containerisation as a proportion of all IT jobs advertised in the UK excluding London.

Job vacancy trend for Containerisation in the UK excluding London

Containerisation
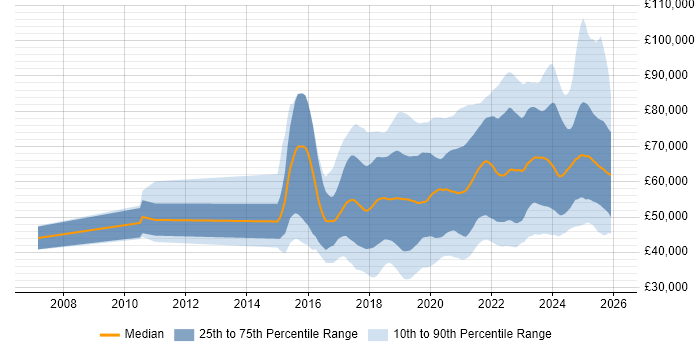
Salary Trend in the UK excluding London

3-month moving average salary quoted in jobs citing Containerisation in the UK excluding London.

Salary trend for Containerisation in the UK excluding London

Containerisation
Salary Histogram in the UK excluding London

Salary distribution for jobs citing Containerisation in the UK excluding London over the 6 months to 15 June 2025.

Salary histogram for Containerisation in the UK excluding London

Containerisation
Job Locations in the UK excluding London

The table below looks at the demand and provides a guide to the median salaries quoted in IT jobs citing Containerisation within the UK excluding London region over the 6 months to 15 June 2025. The 'Rank Change' column provides an indication of the change in demand within each location based on the same 6 month period last year.

Location Rank Change
on Same Period
Last Year
Matching
Permanent
IT Job Ads
Median Salary
Past 6 Months
Median Salary
% Change
on Same Period
Last Year
Live
Jobs
North of England +59 287 £65,000 +8.33% 327
North West +48 207 £57,836 -11.02% 207
South East +46 156 £60,000 -11.11% 568
Midlands +84 136 £62,500 +4.17% 98
Scotland +145 99 £85,000 +21.43% 41
South West +44 87 £75,000 +3.45% 163
West Midlands +66 74 £65,000 +8.33% 64
East of England +47 71 £68,750 +10.00% 60
Yorkshire +17 67 £70,000 +16.67% 95
East Midlands +74 62 £60,000 +4.35% 28
North East +54 13 £65,000 -4.41% 26
Wales +22 12 £60,000 +20.00% 27
Northern Ireland +20 2 £43,092 -28.18% 23
Isle of Man +9 1 £34,500 -58.18%
Containerisation
UK

Containerisation
Co-occurring Skills and Capabilities in the UK excluding London by Category

The follow tables expand on the table above by listing co-occurrences grouped by category. The same employment type, locality and period is covered with up to 20 co-occurrences shown in each of the following categories:

Application Platforms
1 179 (21.41%) Confluence
2 9 (1.08%) Apache Spark
3 6 (0.72%) IIS
4 5 (0.60%) Apache
4 5 (0.60%) CMS
4 5 (0.60%) SharePoint
5 4 (0.48%) Apache Solr
5 4 (0.48%) Microsoft Exchange
5 4 (0.48%) SAS
6 3 (0.36%) BizTalk Server
6 3 (0.36%) OpenStack
7 2 (0.24%) NetWeaver
7 2 (0.24%) Tomcat
8 1 (0.12%) CICS
8 1 (0.12%) Mendix
Applications
1 2 (0.24%) EngageOne
Business Applications
1 2 (0.24%) Dynamics CRM
2 1 (0.12%) Oracle Payables
2 1 (0.12%) Payment Gateway
Cloud Services
1 570 (68.18%) AWS
2 545 (65.19%) Azure
3 266 (31.82%) GCP
4 68 (8.13%) Pulumi
5 53 (6.34%) Azure DevOps
6 52 (6.22%) AWS CloudFormation
7 48 (5.74%) Amazon EKS
8 43 (5.14%) GitHub
9 39 (4.67%) Serverless
10 33 (3.95%) GitHub Actions
11 32 (3.83%) SaaS
12 31 (3.71%) Amazon S3
13 30 (3.59%) Amazon EC2
14 24 (2.87%) AWS Lambda
15 17 (2.03%) Amazon CloudWatch
15 17 (2.03%) PaaS
16 14 (1.67%) Amazon SQS
16 14 (1.67%) Cloud Computing
16 14 (1.67%) Route 53
17 11 (1.32%) IaaS
Communications & Networking
1 65 (7.78%) Broadband
2 16 (1.91%) Internet
3 15 (1.79%) TCP/IP
4 11 (1.32%) DNS
5 10 (1.20%) DHCP
5 10 (1.20%) SAN
6 9 (1.08%) Firewall
7 6 (0.72%) HTTP
8 5 (0.60%) Multicast
8 5 (0.60%) Network Security
8 5 (0.60%) VLAN
8 5 (0.60%) VPN
9 4 (0.48%) BGP
9 4 (0.48%) EIGRP
9 4 (0.48%) OSPF
10 3 (0.36%) NAS
11 1 (0.12%) IPsec
11 1 (0.12%) iSCSI
11 1 (0.12%) SpaceWire
11 1 (0.12%) SSL
Database & Business Intelligence
1 283 (33.85%) SQL Server
2 130 (15.55%) NoSQL
3 85 (10.17%) Relational Database
4 69 (8.25%) RDBMS
5 66 (7.89%) PostgreSQL
6 43 (5.14%) Elasticsearch
7 39 (4.67%) MongoDB
8 25 (2.99%) Amazon RDS
9 22 (2.63%) MySQL
10 16 (1.91%) DynamoDB
11 14 (1.67%) Big Data
12 13 (1.56%) Amazon Aurora
13 9 (1.08%) BigQuery
13 9 (1.08%) Redis
14 8 (0.96%) Power BI
15 7 (0.84%) Data Warehouse
15 7 (0.84%) Tableau
16 6 (0.72%) Data Lake
16 6 (0.72%) DB2
17 5 (0.60%) Data Hub
Development Applications
1 291 (34.81%) GitLab
2 277 (33.13%) JIRA
3 271 (32.42%) Maven
4 268 (32.06%) SonarQube
5 265 (31.70%) Cucumber
6 259 (30.98%) Sonatype Nexus
7 254 (30.38%) Selenium
8 249 (29.78%) Bitbucket
9 69 (8.25%) Jenkins
10 65 (7.78%) Git
10 65 (7.78%) Jaeger
11 34 (4.07%) JUnit
12 30 (3.59%) Mockito
13 14 (1.67%) Cypress.io
14 13 (1.56%) Eclipse
14 13 (1.56%) IntelliJ
14 13 (1.56%) Jasmine
14 13 (1.56%) Karma Test Runner
14 13 (1.56%) Protractor
14 13 (1.56%) webpack
General
1 410 (49.04%) Inclusion and Diversity
2 362 (43.30%) Finance
3 326 (39.00%) Banking
4 150 (17.94%) Social Skills
5 104 (12.44%) Retail
6 92 (11.00%) Investment Banking
7 90 (10.77%) Corporate Banking
8 63 (7.54%) Public Sector
9 56 (6.70%) Analytical Skills
10 14 (1.67%) Marketing
11 12 (1.44%) Law
12 8 (0.96%) Organisational Skills
13 7 (0.84%) Manufacturing
14 6 (0.72%) Electronics
14 6 (0.72%) Pharmaceutical
14 6 (0.72%) Telecoms
15 5 (0.60%) Automotive
16 4 (0.48%) Documentation Skills
17 3 (0.36%) Health Technology
18 2 (0.24%) Aerospace
Job Titles
1 317 (37.92%) Software Engineer
2 185 (22.13%) Lead
3 123 (14.71%) Developer
4 89 (10.65%) DevOps Engineer
5 86 (10.29%) Team Leader
6 77 (9.21%) Senior
7 59 (7.06%) Architect
8 44 (5.26%) Software Developer
8 44 (5.26%) Solutions Architect
9 36 (4.31%) Java Developer
10 32 (3.83%) Java Engineer
11 26 (3.11%) Azure Engineer
12 24 (2.87%) Senior Developer
13 21 (2.51%) Java Software Engineer
13 21 (2.51%) Software Team Leader
14 20 (2.39%) Azure DevOps Engineer
15 18 (2.15%) Backend Developer
15 18 (2.15%) Full-Stack Engineer
15 18 (2.15%) Lead Software Engineer
16 17 (2.03%) Senior Software Engineer
Libraries, Frameworks & Software Standards
1 326 (39.00%) React
2 318 (38.04%) Spring Boot
3 316 (37.80%) Spring
4 283 (33.85%) Kafka
5 277 (33.13%) JPA
6 267 (31.94%) HTML
7 265 (31.70%) CSS
8 248 (29.67%) Redux
9 193 (23.09%) Hibernate
10 168 (20.10%) RESTful
11 125 (14.95%) REST
12 108 (12.92%) Jest
13 97 (11.60%) HTML5
14 95 (11.36%) CSS3
15 90 (10.77%) Sass
16 83 (9.93%) .NET
17 81 (9.69%) Elastic Stack
18 73 (8.73%) AngularJS
19 67 (8.01%) OpenTelemetry
20 61 (7.30%) Node.js
Miscellaneous
1 287 (34.33%) Product Ownership
2 252 (30.14%) Enterprise Software
3 49 (5.86%) Cloud Native
4 45 (5.38%) Hybrid Cloud
5 42 (5.02%) Distributed Systems
6 36 (4.31%) Cyberattack
7 35 (4.19%) Management Information System
8 34 (4.07%) e-Learning
9 22 (2.63%) Algorithms
10 19 (2.27%) Public Cloud
11 16 (1.91%) Private Cloud
12 12 (1.44%) Onboarding
13 9 (1.08%) Legacy Systems
13 9 (1.08%) Mobile App
13 9 (1.08%) Virtual Team
14 8 (0.96%) Data Centre
14 8 (0.96%) Enterprise Storage
14 8 (0.96%) Online Banking
15 7 (0.84%) Distributed Architecture
16 6 (0.72%) Distributed Applications
Operating Systems
1 212 (25.36%) Linux
2 73 (8.73%) Unix
3 50 (5.98%) Android
4 49 (5.86%) Windows
5 25 (2.99%) Windows Server
6 12 (1.44%) Red Hat Enterprise Linux
7 9 (1.08%) Ubuntu
8 7 (0.84%) Windows Server 2019
9 6 (0.72%) Apple iOS
10 5 (0.60%) CentOS
10 5 (0.60%) Debian
10 5 (0.60%) SUSE
10 5 (0.60%) SUSE Linux Enterprise Server
10 5 (0.60%) Windows 10
10 5 (0.60%) Windows Server 2012
10 5 (0.60%) Windows Server 2016
11 2 (0.24%) Mac OS
11 2 (0.24%) Rocky
12 1 (0.12%) Solaris
Processes & Methodologies
1 604 (72.25%) Agile
2 589 (70.45%) DevOps
3 533 (63.76%) CI/CD
4 450 (53.83%) Microservices
5 410 (49.04%) Software Engineering
6 384 (45.93%) Test Automation
7 319 (38.16%) Performance Optimisation
8 310 (37.08%) Full-Stack Development
9 268 (32.06%) SDLC
10 266 (31.82%) Front End Development
11 253 (30.26%) Mentoring
12 202 (24.16%) TDD
13 194 (23.21%) Continuous Improvement
14 178 (21.29%) Clean Code
15 140 (16.75%) Infrastructure as Code
16 133 (15.91%) Roadmaps
17 126 (15.07%) Continuous Integration
18 115 (13.76%) User Experience
19 105 (12.56%) Migration
20 100 (11.96%) Problem-Solving
Programming Languages
1 532 (63.64%) Java
2 406 (48.56%) JavaScript
3 350 (41.87%) SQL
4 247 (29.55%) Python
5 128 (15.31%) TypeScript
6 115 (13.76%) Bash
7 114 (13.64%) Go
8 72 (8.61%) C#
9 63 (7.54%) Rust
10 44 (5.26%) C++
10 44 (5.26%) PowerShell
11 16 (1.91%) C
12 8 (0.96%) Kotlin
13 7 (0.84%) Bicep
14 6 (0.72%) PHP
15 5 (0.60%) R
16 4 (0.48%) Shell Script
16 4 (0.48%) T-SQL
17 3 (0.36%) Scala
18 2 (0.24%) XAML
Qualifications
1 115 (13.76%) Security Cleared
2 100 (11.96%) AWS Certification
3 67 (8.01%) DV Cleared
4 61 (7.30%) Degree
5 44 (5.26%) SC Cleared
6 33 (3.95%) Azure Certification
7 17 (2.03%) AWS Certified Solutions Architect
7 17 (2.03%) Computer Science Degree
8 15 (1.79%) HND
9 11 (1.32%) BPSS Clearance
10 7 (0.84%) Microsoft Certification
11 5 (0.60%) TOGAF Certification
12 4 (0.48%) AWS Certified Cloud Practitioner
12 4 (0.48%) Cisco Certification
12 4 (0.48%) VMware Certified Professional (VCP)
13 3 (0.36%) (ISC)2 CCSP
13 3 (0.36%) CISSP
13 3 (0.36%) CompTIA Security+
13 3 (0.36%) Linux+ Certification
13 3 (0.36%) RHCE
Quality Assurance & Compliance
1 268 (32.06%) QA
2 98 (11.72%) Accessibility
3 23 (2.75%) GDPR
4 17 (2.03%) HIPAA
5 9 (1.08%) NIST
6 7 (0.84%) Data Quality
6 7 (0.84%) SOC 2
7 6 (0.72%) NCSC
8 5 (0.60%) PCI DSS
9 4 (0.48%) Basel II
9 4 (0.48%) Basel III
9 4 (0.48%) Dodd-Frank
9 4 (0.48%) IFRS
9 4 (0.48%) IFRS 9
9 4 (0.48%) ISO/IEC 27001
10 2 (0.24%) CDISC
10 2 (0.24%) SLA
11 1 (0.12%) Cyber Essentials
11 1 (0.12%) ECSS
11 1 (0.12%) GMP
System Software
1 649 (77.63%) Docker
2 30 (3.59%) VMware Infrastructure
3 25 (2.99%) Virtual Machines
4 19 (2.27%) Active Directory
5 17 (2.03%) Hyper-V
6 8 (0.96%) VMware ESXi
7 6 (0.72%) NFS
7 6 (0.72%) Postfix
7 6 (0.72%) vSphere
8 4 (0.48%) VMware NSX
9 3 (0.36%) Dovecot
10 1 (0.12%) LXC
10 1 (0.12%) Samba
10 1 (0.12%) Slurm Workload Manager
10 1 (0.12%) vCloud
Systems Management
1 602 (72.01%) Kubernetes
2 201 (24.04%) Terraform
3 165 (19.74%) Ansible
4 89 (10.65%) Prometheus
5 66 (7.89%) Argo
6 65 (7.78%) Kustomize
7 27 (3.23%) Grafana
8 8 (0.96%) SCCM
9 6 (0.72%) Progress Chef
10 5 (0.60%) Microsoft Data Protection Manager
10 5 (0.60%) SCOM
10 5 (0.60%) WSUS
11 4 (0.48%) Puppet
12 3 (0.36%) Docker Swarm
12 3 (0.36%) Rancher
13 2 (0.24%) AWS Copilot
13 2 (0.24%) Microsoft Intune
13 2 (0.24%) Proxmox
13 2 (0.24%) Single Sign-On
13 2 (0.24%) vCenter Server
Vendors
1 246 (29.43%) Solace
2 95 (11.36%) Google
3 72 (8.61%) Microsoft
4 59 (7.06%) IBM
5 45 (5.38%) Red Hat
6 36 (4.31%) VMware
7 18 (2.15%) Oracle
8 13 (1.56%) Atlassian
8 13 (1.56%) SAP
9 10 (1.20%) Cisco
10 7 (0.84%) Ping Identity
11 6 (0.72%) Apple
12 5 (0.60%) Databricks
12 5 (0.60%) Splunk
13 4 (0.48%) Bloomberg
13 4 (0.48%) Jaspersoft
14 3 (0.36%) Okta
15 2 (0.24%) ForgeRock
15 2 (0.24%) Guidewire
15 2 (0.24%) Pega