Ubuntu Jobs in the UK excluding London

Ubuntu Linux
UK > UK excluding London

The table below provides summary statistics for permanent job vacancies advertised in the UK excluding London requiring Ubuntu skills. It includes a benchmarking guide to the annual salaries offered in vacancies that cited Ubuntu over the 6 months leading up to 30 May 2025, comparing them to the same period in the previous two years.

6 months to
30 May 2025
Same period 2024 Same period 2023
Rank 515 473 533
Rank change year-on-year -42 +60 -90
Permanent jobs citing Ubuntu 62 318 227
As % of all permanent jobs advertised in the UK excluding London 0.16% 0.43% 0.39%
As % of the Operating Systems category 1.23% 2.98% 2.36%
Number of salaries quoted 49 151 169
10th Percentile £32,500 £36,000 £28,750
25th Percentile £36,250 £40,000 £42,155
Median annual salary (50th Percentile) £40,000 £50,000 £57,500
Median % change year-on-year -20.00% -13.04% +21.05%
75th Percentile £55,000 £60,750 £75,000
90th Percentile £65,000 £85,000 £80,000
UK median annual salary £46,500 £52,500 £62,450
% change year-on-year -11.43% -15.93% +13.55%

All Operating Systems
UK excluding London

Ubuntu falls under the Operating Systems category. For comparison with the information above, the following table provides summary statistics for all permanent job vacancies requiring operating system skills in the UK excluding London.

Permanent vacancies with a requirement for operating system skills 5,036 10,675 9,625
As % of all permanent jobs advertised in the UK excluding London 12.79% 14.32% 16.59%
Number of salaries quoted 2,937 8,160 5,973
10th Percentile £26,250 £25,500 £25,500
25th Percentile £31,250 £30,000 £31,250
Median annual salary (50th Percentile) £40,000 £42,500 £45,000
Median % change year-on-year -5.88% -5.56% -
75th Percentile £55,000 £57,500 £60,000
90th Percentile £70,000 £68,750 £73,750
UK median annual salary £45,000 £45,000 £52,500
% change year-on-year - -14.29% -

Ubuntu
Job Vacancy Trend in the UK excluding London

Job postings citing Ubuntu as a proportion of all IT jobs advertised in the UK excluding London.
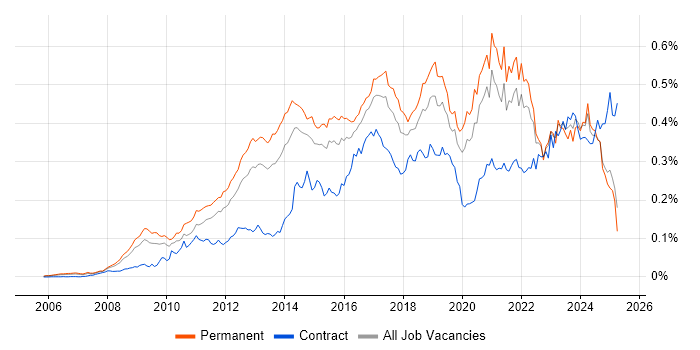
Job vacancy trend for Ubuntu in the UK excluding London

Ubuntu
Salary Trend in the UK excluding London

3-month moving average salary quoted in jobs citing Ubuntu in the UK excluding London.

Salary trend for Ubuntu in the UK excluding London

Ubuntu
Salary Histogram in the UK excluding London

Salary distribution for jobs citing Ubuntu in the UK excluding London over the 6 months to 30 May 2025.

Salary histogram for Ubuntu in the UK excluding London

Ubuntu
Job Locations in the UK excluding London

The table below looks at the demand and provides a guide to the median salaries quoted in IT jobs citing Ubuntu within the UK excluding London region over the 6 months to 30 May 2025. The 'Rank Change' column provides an indication of the change in demand within each location based on the same 6 month period last year.

Location Rank Change
on Same Period
Last Year
Matching
Permanent
IT Job Ads
Median Salary
Past 6 Months
Median Salary
% Change
on Same Period
Last Year
Live
Jobs
Midlands +79 26 £35,000 -30.00% 39
West Midlands +57 19 £35,000 -66.67% 22
South East -35 16 £40,000 -15.79% 60
North of England +15 8 £55,000 +10.00% 52
North West -16 8 £55,000 +10.00% 27
East Midlands +40 7 £40,000 +61.62% 13
Scotland +112 4 £43,750 -50.00% 14
Wales +41 4 £47,500 -5.00% 5
East of England +30 4 £62,500 +4.17% 37
South West +56 1 £62,500 +45.35% 29
Ubuntu
UK

Ubuntu
Co-occurring Skills and Capabilities in the UK excluding London by Category

The follow tables expand on the table above by listing co-occurrences grouped by category. The same employment type, locality and period is covered with up to 20 co-occurrences shown in each of the following categories:

Application Platforms
1 3 (4.84%) Confluence
1 3 (4.84%) Microsoft Exchange
1 3 (4.84%) SharePoint
2 2 (3.23%) nginx
3 1 (1.61%) Apache
3 1 (1.61%) Apache Airflow
3 1 (1.61%) Tomcat
Applications
1 11 (17.74%) Microsoft Excel
1 11 (17.74%) Microsoft Office
2 9 (14.52%) Mozilla Thunderbird
Cloud Services
1 22 (35.48%) Azure
2 21 (33.87%) AWS
3 13 (20.97%) Google Workspace
4 12 (19.35%) Virtual Private Cloud
5 10 (16.13%) Amazon S3
5 10 (16.13%) Microsoft 365
6 9 (14.52%) Amazon ECS
6 9 (14.52%) AWS KMS
7 8 (12.90%) Amazon EC2
7 8 (12.90%) AWS Lambda
7 8 (12.90%) Serverless
8 7 (11.29%) Amazon CloudWatch
8 7 (11.29%) Amazon GuardDuty
9 5 (8.06%) Amazon ELB
10 4 (6.45%) Route 53
11 3 (4.84%) Amazon Glacier
11 3 (4.84%) Cloud Computing
11 3 (4.84%) Entra ID
11 3 (4.84%) OneDrive
12 2 (3.23%) AWS CodeBuild
Communications & Networking
1 31 (50.00%) Firewall
2 20 (32.26%) DNS
3 18 (29.03%) DHCP
4 17 (27.42%) VLAN
5 13 (20.97%) TCP/IP
6 12 (19.35%) OSPF
7 11 (17.74%) BGP
7 11 (17.74%) WLAN
8 9 (14.52%) SSL
9 7 (11.29%) Wireshark
10 6 (9.68%) VPN
11 4 (6.45%) HTTP
12 3 (4.84%) OpenLDAP
12 3 (4.84%) SSH
13 2 (3.23%) FTP
13 2 (3.23%) IMAP
13 2 (3.23%) Multicast
13 2 (3.23%) SAN
13 2 (3.23%) SMTP
14 1 (1.61%) VoIP
Database & Business Intelligence
1 6 (9.68%) MySQL
2 5 (8.06%) Amazon RDS
2 5 (8.06%) MariaDB
3 4 (6.45%) RDBMS
3 4 (6.45%) Relational Database
3 4 (6.45%) SQL Server
4 3 (4.84%) PostgreSQL
5 2 (3.23%) Amazon Aurora
5 2 (3.23%) Big Data
5 2 (3.23%) Elasticsearch
6 1 (1.61%) Airbyte
6 1 (1.61%) Cloud Spanner
6 1 (1.61%) Couchbase
6 1 (1.61%) Data Warehouse
6 1 (1.61%) DB2
6 1 (1.61%) Metadata
6 1 (1.61%) MongoDB
6 1 (1.61%) NoSQL
6 1 (1.61%) Power BI
6 1 (1.61%) Qlik Sense
Development Applications
1 15 (24.19%) Jenkins
2 7 (11.29%) Bitbucket Server
3 6 (9.68%) Git
3 6 (9.68%) JIRA
4 5 (8.06%) Vagrant
5 3 (4.84%) GitLab
6 2 (3.23%) CircleCI
7 1 (1.61%) Maven
7 1 (1.61%) SoapUI
7 1 (1.61%) Sonatype Nexus
General
1 19 (30.65%) Social Skills
2 12 (19.35%) Retail
3 11 (17.74%) Automotive
4 3 (4.84%) Public Sector
5 2 (3.23%) Finance
5 2 (3.23%) Inclusion and Diversity
5 2 (3.23%) Law
5 2 (3.23%) Marketing
5 2 (3.23%) Presentation Skills
6 1 (1.61%) Health Technology
Job Titles
1 13 (20.97%) Linux Engineer
1 13 (20.97%) Systems Engineer
2 12 (19.35%) IT Engineer
3 10 (16.13%) Infrastructure Engineer
4 9 (14.52%) DevOps Engineer
5 6 (9.68%) NOC Engineer
6 5 (8.06%) Administrator
6 5 (8.06%) Linux Administrator
6 5 (8.06%) Linux Systems Administrator
6 5 (8.06%) Platform Engineer
6 5 (8.06%) Server Engineer
6 5 (8.06%) Systems Administrator
7 4 (6.45%) 3rd Line Engineer
7 4 (6.45%) 3rd Line Infrastructure Engineer
7 4 (6.45%) VMWare Administrator
8 3 (4.84%) Linux Systems Engineer
8 3 (4.84%) Senior
8 3 (4.84%) VMware Engineer
9 2 (3.23%) Linux Server Engineer
9 2 (3.23%) Site Engineer
Libraries, Frameworks & Software Standards
1 4 (6.45%) Elastic Stack
2 3 (4.84%) LDAP
3 2 (3.23%) .NET
3 2 (3.23%) Pandas
3 2 (3.23%) REST
4 1 (1.61%) 802.1X
4 1 (1.61%) JSON
4 1 (1.61%) Middleware
4 1 (1.61%) NumPy
4 1 (1.61%) OpenCV
4 1 (1.61%) PyTorch
4 1 (1.61%) RabbitMQ
4 1 (1.61%) SAML
4 1 (1.61%) SQLAlchemy
4 1 (1.61%) TensorFlow
4 1 (1.61%) XML
4 1 (1.61%) XMPP
4 1 (1.61%) YAML
Miscellaneous
1 16 (25.81%) Management Information System
2 11 (17.74%) Smartphone
3 9 (14.52%) Data Centre
4 2 (3.23%) Driving Licence
4 2 (3.23%) NHS
4 2 (3.23%) Public Cloud
4 2 (3.23%) Replication
5 1 (1.61%) Cloud Native
5 1 (1.61%) Hybrid Cloud
5 1 (1.61%) Linux Command Line
5 1 (1.61%) Mobile App
5 1 (1.61%) PKI
5 1 (1.61%) Smartcard
5 1 (1.61%) Video Conferencing
Operating Systems
1 62 (100.00%) Linux
2 33 (53.23%) Windows
3 23 (37.10%) CentOS
4 20 (32.26%) Windows Server
5 13 (20.97%) Windows Server 2016
5 13 (20.97%) Windows Server 2019
6 12 (19.35%) Debian
6 12 (19.35%) Windows 10
7 11 (17.74%) Mac OS X
8 8 (12.90%) Red Hat Enterprise Linux
9 7 (11.29%) Rocky
10 5 (8.06%) VMS
11 3 (4.84%) Windows Server 2012
12 2 (3.23%) Amazon Linux
12 2 (3.23%) SUSE
13 1 (1.61%) Unix
Processes & Methodologies
1 21 (33.87%) DevOps
2 16 (25.81%) Computer Science
3 15 (24.19%) Performance Tuning
4 13 (20.97%) CI/CD
5 12 (19.35%) Disaster Recovery
5 12 (19.35%) Infrastructure Engineering
5 12 (19.35%) Service Delivery
6 11 (17.74%) Business Case
6 11 (17.74%) Systems Engineering
7 10 (16.13%) Patch Management
8 9 (14.52%) Capacity Management
9 8 (12.90%) Agile
9 8 (12.90%) Configuration Management
9 8 (12.90%) Containerisation
10 7 (11.29%) Key Management
11 6 (9.68%) Information Security
11 6 (9.68%) Information Security Management
11 6 (9.68%) Penetration Testing
11 6 (9.68%) Platform Engineering
11 6 (9.68%) Proactive Monitoring
Programming Languages
1 27 (43.55%) PowerShell
2 20 (32.26%) Python
3 18 (29.03%) SQL
4 10 (16.13%) Bash
5 8 (12.90%) Shell Script
6 6 (9.68%) Java
7 5 (8.06%) Groovy
8 3 (4.84%) Perl
8 3 (4.84%) Ruby
9 2 (3.23%) T-SQL
10 1 (1.61%) C++
10 1 (1.61%) PL/SQL
Qualifications
1 23 (37.10%) Degree
2 18 (29.03%) Microsoft Certification
3 17 (27.42%) MCSE
4 11 (17.74%) Computer Science Degree
4 11 (17.74%) HNC
4 11 (17.74%) HND
4 11 (17.74%) Security Cleared
5 8 (12.90%) Azure Certification
6 7 (11.29%) CCNA
6 7 (11.29%) Cisco Certification
7 6 (9.68%) AWS Certification
7 6 (9.68%) CCNP
7 6 (9.68%) MCSA
7 6 (9.68%) Network+ Certification
7 6 (9.68%) SC Cleared
7 6 (9.68%) VMware Certified Professional (VCP)
8 3 (4.84%) Linux+ Certification
8 3 (4.84%) RHCE
9 1 (1.61%) AWS Certified Solutions Architect
9 1 (1.61%) DV Cleared
Quality Assurance & Compliance
1 5 (8.06%) SLA
2 3 (4.84%) GDPR
2 3 (4.84%) HIPAA
3 1 (1.61%) Cyber Essentials
3 1 (1.61%) ISO/IEC 27001
3 1 (1.61%) NCSC
3 1 (1.61%) NIST
3 1 (1.61%) QA
System Software
1 25 (40.32%) Active Directory
2 22 (35.48%) Docker
3 21 (33.87%) VMware Infrastructure
4 8 (12.90%) vSphere
5 7 (11.29%) Hyper-V
5 7 (11.29%) Virtual Desktop
5 7 (11.29%) Virtual Machines
6 6 (9.68%) VMware ESXi
7 5 (8.06%) Dovecot
7 5 (8.06%) Postfix
8 4 (6.45%) Virtual Servers
9 2 (3.23%) DFS Replication
9 2 (3.23%) Squid
10 1 (1.61%) Firmware
10 1 (1.61%) KVM
Systems Management
1 21 (33.87%) Ansible
2 17 (27.42%) Terraform
3 11 (17.74%) Nessus
3 11 (17.74%) Proxmox
4 9 (14.52%) Kubernetes
5 8 (12.90%) Grafana
5 8 (12.90%) Prometheus
6 3 (4.84%) FortiGate
6 3 (4.84%) Nagios
7 2 (3.23%) Microsoft Intune
7 2 (3.23%) NetBackup
8 1 (1.61%) Puppet
8 1 (1.61%) WMI
8 1 (1.61%) WSUS
Vendors
1 33 (53.23%) Microsoft
2 22 (35.48%) VMware
3 19 (30.65%) Cisco
4 17 (27.42%) Red Hat
5 14 (22.58%) Dell
6 13 (20.97%) Google
7 11 (17.74%) Apple
7 11 (17.74%) Fortinet
7 11 (17.74%) Ubiquiti
8 7 (11.29%) Juniper
9 6 (9.68%) Palo Alto
10 4 (6.45%) Splunk
11 3 (4.84%) Okta
11 3 (4.84%) Ping Identity
12 2 (3.23%) Commvault
12 2 (3.23%) Jaspersoft
12 2 (3.23%) Salesforce
12 2 (3.23%) ServiceNow
12 2 (3.23%) Veeam
12 2 (3.23%) Zerto