Node.js Jobs in the UK excluding London

Node
UK > UK excluding London

The table below provides summary statistics for permanent job vacancies advertised in the UK excluding London requiring Node.js skills. It includes a benchmarking guide to the annual salaries offered in vacancies that cited Node.js over the 6 months leading up to 26 July 2024, comparing them to the same period in the previous two years.

6 months to
26 Jul 2024
Same period 2023 Same period 2022
Rank 129 141 69
Rank change year-on-year +12 -72 -12
Permanent jobs citing Node.js 1,296 1,188 3,360
As % of all permanent jobs advertised in the UK excluding London 1.99% 2.47% 4.29%
As % of the Libraries, Frameworks & Software Standards category 11.14% 9.82% 13.74%
Number of salaries quoted 751 888 1,675
10th Percentile £38,066 £42,500 £37,500
25th Percentile £45,000 £52,500 £45,000
Median annual salary (50th Percentile) £60,000 £65,000 £60,000
Median % change year-on-year -7.69% +8.33% +20.00%
75th Percentile £73,886 £77,500 £72,500
90th Percentile £81,250 £92,500 £85,000
UK median annual salary £65,000 £75,000 £67,500
% change year-on-year -13.33% +11.11% +8.00%

All Software Libraries and Frameworks
UK excluding London

Node.js falls under the Software Libraries and Frameworks category. For comparison with the information above, the following table provides summary statistics for all permanent job vacancies requiring technical specification, industry standards, software libraries and framework skills in the UK excluding London.

Permanent vacancies with a requirement for technical specification, industry standards, software libraries and framework skills 11,631 12,099 24,450
As % of all permanent jobs advertised in the UK excluding London 17.82% 25.13% 31.22%
Number of salaries quoted 8,091 7,940 14,523
10th Percentile £34,000 £36,250 £35,000
25th Percentile £42,500 £45,000 £42,500
Median annual salary (50th Percentile) £55,000 £57,500 £55,000
Median % change year-on-year -4.35% +4.55% +10.00%
75th Percentile £68,750 £72,500 £70,000
90th Percentile £80,000 £85,000 £82,500
UK median annual salary £60,000 £67,500 £65,000
% change year-on-year -11.11% +3.85% +13.04%

Node.js
Job Vacancy Trend in the UK excluding London

Job postings citing Node.js as a proportion of all IT jobs advertised in the UK excluding London.
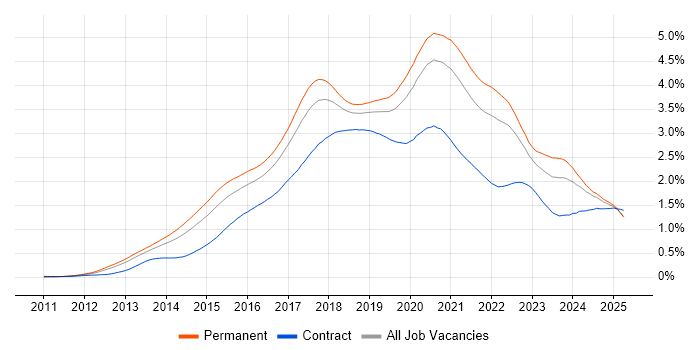
Job vacancy trend for Node.js in the UK excluding London

Node.js
Salary Trend in the UK excluding London

3-month moving average salary quoted in jobs citing Node.js in the UK excluding London.

Salary trend for Node.js in the UK excluding London

Node.js
Salary Histogram in the UK excluding London

Salary distribution for jobs citing Node.js in the UK excluding London over the 6 months to 26 July 2024.

Salary histogram for Node.js in the UK excluding London

Node.js
Job Locations in the UK excluding London

The table below looks at the demand and provides a guide to the median salaries quoted in IT jobs citing Node.js within the UK excluding London region over the 6 months to 26 July 2024. The 'Rank Change' column provides an indication of the change in demand within each location based on the same 6 month period last year.

Location Rank Change
on Same Period
Last Year
Matching
Permanent
IT Job Ads
Median Salary
Past 6 Months
Median Salary
% Change
on Same Period
Last Year
Live
Jobs
North of England +22 405 £60,000 -7.69% 36
South East -21 282 £55,000 -21.43% 30
North West +23 267 £65,000 +4.00% 22
Scotland +42 233 £70,000 +7.69% 7
South West +10 123 £62,500 -3.85% 21
Midlands -63 120 £60,000 -7.69% 29
Yorkshire +12 116 £60,000 -8.40% 8
West Midlands -27 80 £65,000 +8.33% 16
East of England +40 68 £54,500 -0.91% 15
East Midlands -54 40 £50,000 -28.57% 13
Wales +16 34 £50,000 -16.67% 4
Northern Ireland +26 31 £80,000 +146.15% 6
North East 0 22 £75,000 +34.53% 6
Node.js
UK

Node.js
Co-occurring Skills and Capabilities in the UK excluding London by Category

The follow tables expand on the table above by listing co-occurrences grouped by category. The same employment type, locality and period is covered with up to 20 co-occurrences shown in each of the following categories:

Application Platforms
1 53 (4.09%) FileNet
2 43 (3.32%) nginx
3 33 (2.55%) Apache
3 33 (2.55%) Camunda
4 29 (2.24%) Apache Spark
5 21 (1.62%) CMS
6 15 (1.16%) Confluence
7 11 (0.85%) OpenStack
7 11 (0.85%) SharePoint
8 10 (0.77%) WordPress
9 7 (0.54%) ArcGIS
9 7 (0.54%) Headless CMS
10 5 (0.39%) JBoss
10 5 (0.39%) Red Hat Fuse
11 3 (0.23%) Microsoft Exchange
12 1 (0.077%) DNN
12 1 (0.077%) Kentico
12 1 (0.077%) Sitecore CMS
12 1 (0.077%) Sitefinity
12 1 (0.077%) Umbraco
Applications
1 9 (0.69%) Chatbot
2 3 (0.23%) MS Visio
3 1 (0.077%) Microsoft Office
3 1 (0.077%) Photoshop
Business Applications
1 6 (0.46%) Payment Gateway
2 2 (0.15%) Sage 200
2 2 (0.15%) Salesforce CRM
2 2 (0.15%) SAP S/4HANA
2 2 (0.15%) Shopify
Cloud Services
1 644 (49.69%) AWS
2 446 (34.41%) Azure
3 273 (21.06%) Serverless
4 149 (11.50%) IBM Cloud
5 147 (11.34%) Azure DevOps
6 135 (10.42%) Azure Functions
7 116 (8.95%) Azure Service Bus
8 115 (8.87%) Azure API Management
8 115 (8.87%) Azure Logic Apps
9 93 (7.18%) GCP
10 83 (6.40%) AWS Lambda
11 71 (5.48%) Amazon S3
12 66 (5.09%) OpenShift
13 58 (4.48%) SaaS
14 50 (3.86%) GitHub
15 48 (3.70%) AWS CloudFormation
16 43 (3.32%) Amazon EKS
17 33 (2.55%) dbt
18 24 (1.85%) Cloud Computing
19 23 (1.77%) Amazon ECS
Communications & Networking
1 33 (2.55%) HTTP
1 33 (2.55%) MQTT
2 30 (2.31%) AMQP
3 21 (1.62%) TCP/IP
4 10 (0.77%) Wireshark
5 7 (0.54%) DNS
5 7 (0.54%) Internet
6 5 (0.39%) VPN
7 4 (0.31%) Broadband
7 4 (0.31%) Reverse Proxy
7 4 (0.31%) RS-232
7 4 (0.31%) RS-485
8 3 (0.23%) Hyperconnected
8 3 (0.23%) Wi-Fi
9 2 (0.15%) Firewall
10 1 (0.077%) LAN
10 1 (0.077%) WAN
10 1 (0.077%) Wireless
Database & Business Intelligence
1 320 (24.69%) MongoDB
2 271 (20.91%) NoSQL
3 241 (18.60%) PostgreSQL
4 198 (15.28%) Relational Database
5 132 (10.19%) Elasticsearch
6 123 (9.49%) SQL Server
7 120 (9.26%) MySQL
8 116 (8.95%) DB2
9 85 (6.56%) Hadoop
10 54 (4.17%) Apache Cassandra
11 43 (3.32%) Big Data
12 37 (2.85%) DynamoDB
13 33 (2.55%) Oracle Database
14 31 (2.39%) Redis
15 29 (2.24%) Cloudera CDH
16 14 (1.08%) Amazon RDS
17 10 (0.77%) Data Warehouse
18 8 (0.62%) Amazon Aurora
18 8 (0.62%) Power BI
19 7 (0.54%) Geospatial Data
Development Applications
1 155 (11.96%) Git
2 142 (10.96%) JUnit
3 70 (5.40%) Cypress.io
4 68 (5.25%) Selenium
5 65 (5.02%) WebDriver
6 62 (4.78%) Protractor
7 60 (4.63%) Jasmine
7 60 (4.63%) Karma Test Runner
8 50 (3.86%) JIRA
9 46 (3.55%) Jenkins
10 35 (2.70%) GitLab
11 21 (1.62%) SonarQube
12 19 (1.47%) gulp
12 19 (1.47%) webpack
13 17 (1.31%) Bitbucket
14 12 (0.93%) Visual Studio
15 11 (0.85%) Storybook
16 10 (0.77%) Terragrunt
16 10 (0.77%) Yeoman
17 8 (0.62%) Maven
General
1 259 (19.98%) Inclusion and Diversity
2 242 (18.67%) Finance
3 196 (15.12%) Law
4 194 (14.97%) Social Skills
5 159 (12.27%) Public Sector
6 69 (5.32%) Legal
7 68 (5.25%) Banking
8 60 (4.63%) Investment Banking
9 52 (4.01%) Marketing
10 42 (3.24%) Retail
11 32 (2.47%) Games
12 31 (2.39%) Tech for Good
13 29 (2.24%) Aerospace
14 23 (1.77%) Manufacturing
15 20 (1.54%) Analytical Skills
16 11 (0.85%) Organisational Skills
17 10 (0.77%) Automotive
17 10 (0.77%) Financial Institution
17 10 (0.77%) Pharmaceutical
18 9 (0.69%) Electronics
Job Titles
1 631 (48.69%) Developer
2 359 (27.70%) Software Engineer
3 256 (19.75%) Senior
4 221 (17.05%) Full Stack Developer
5 171 (13.19%) Lead
6 128 (9.88%) Azure Developer
7 115 (8.87%) Java Engineer
8 114 (8.80%) Senior Developer
9 113 (8.72%) Java Software Engineer
10 110 (8.49%) Full Stack Engineer
11 81 (6.25%) Lead Software Engineer
12 78 (6.02%) .NET Developer
13 75 (5.79%) DevOps Engineer
14 73 (5.63%) Senior Software Engineer
15 70 (5.40%) Full Stack Software Engineer
16 66 (5.09%) Architect
17 65 (5.02%) Software Developer
18 63 (4.86%) Node.js Developer
19 55 (4.24%) JavaScript Developer
20 48 (3.70%) Technical Architect
Libraries, Frameworks & Software Standards
1 862 (66.51%) React
2 531 (40.97%) AngularJS
3 482 (37.19%) HTML
4 450 (34.72%) CSS
5 295 (22.76%) Vue
6 293 (22.61%) .NET
7 291 (22.45%) Twitter Bootstrap
8 274 (21.14%) jQuery
9 210 (16.20%) Spring
10 207 (15.97%) REST
11 196 (15.12%) ASP.NET
12 189 (14.58%) JSON
13 186 (14.35%) Web Services
14 146 (11.27%) Kafka
15 135 (10.42%) Hibernate
15 135 (10.42%) J2EE
16 132 (10.19%) JMS
16 132 (10.19%) RESTful
17 128 (9.88%) ASP.NET Core
18 119 (9.18%) Ember.js
Miscellaneous
1 218 (16.82%) Algorithms
2 205 (15.82%) Data Structures
3 155 (11.96%) Blockchain
4 149 (11.50%) Hybrid Cloud
5 124 (9.57%) Cloud Native
6 67 (5.17%) IoT
7 58 (4.48%) Greenfield Project
8 37 (2.85%) Onboarding
9 36 (2.78%) e-Learning
10 35 (2.70%) Product Ownership
11 21 (1.62%) Mobile App
12 16 (1.23%) Enterprise Software
13 15 (1.16%) Distributed Systems
14 14 (1.08%) Management Information System
15 12 (0.93%) Low-Code
16 9 (0.69%) Legacy Applications
16 9 (0.69%) Smart Home
17 8 (0.62%) Educational Technology
17 8 (0.62%) Legacy Code
17 8 (0.62%) Public Cloud
Operating Systems
1 232 (17.90%) Linux
2 138 (10.65%) Windows
3 129 (9.95%) Android
4 125 (9.65%) Apple iOS
5 32 (2.47%) Ubuntu
6 30 (2.31%) CentOS
6 30 (2.31%) Red Hat Enterprise Linux
7 29 (2.24%) Debian
8 16 (1.23%) Unix
9 6 (0.46%) Embedded Linux
10 4 (0.31%) Alpine Linux
11 2 (0.15%) Windows Server
Processes & Methodologies
1 499 (38.50%) Agile
2 478 (36.88%) Software Engineering
3 469 (36.19%) Full Stack Development
4 369 (28.47%) DevOps
5 357 (27.55%) Artificial Intelligence
6 344 (26.54%) CI/CD
7 291 (22.45%) Microservices
8 262 (20.22%) Web Development
9 239 (18.44%) SDLC
10 222 (17.13%) TDD
11 210 (16.20%) User Experience
12 209 (16.13%) MVC
13 173 (13.35%) Machine Learning
14 162 (12.50%) Problem-Solving
14 162 (12.50%) Scrum
15 150 (11.57%) Community of Practice
15 150 (11.57%) Mentoring
16 148 (11.42%) Continuous Improvement
17 147 (11.34%) Operational Stability
18 139 (10.73%) OO
Programming Languages
1 851 (65.66%) JavaScript
2 530 (40.90%) TypeScript
3 521 (40.20%) Java
4 415 (32.02%) Python
5 371 (28.63%) SQL
6 266 (20.52%) C#
7 100 (7.72%) PHP
8 33 (2.55%) Lua
9 25 (1.93%) Go
10 23 (1.77%) Ruby
11 21 (1.62%) C
12 19 (1.47%) PowerShell
13 18 (1.39%) Perl
14 14 (1.08%) C++
15 12 (0.93%) Bash
16 8 (0.62%) Kotlin
17 7 (0.54%) VB.NET
18 6 (0.46%) T-SQL
19 5 (0.39%) Rust
19 5 (0.39%) VB
Qualifications
1 154 (11.88%) Security Cleared
2 144 (11.11%) SC Cleared
3 136 (10.49%) Degree
4 49 (3.78%) Computer Science Degree
5 36 (2.78%) DV Cleared
6 19 (1.47%) AWS Certification
7 16 (1.23%) Master's Degree
8 14 (1.08%) PhD
9 10 (0.77%) Azure Certification
10 2 (0.15%) ACCA
10 2 (0.15%) PMI Certification
11 1 (0.077%) AWS Certified DevOps Engineer
11 1 (0.077%) AWS Certified Solutions Architect
11 1 (0.077%) BPSS Clearance
11 1 (0.077%) DBS Check
11 1 (0.077%) ISTQB
Quality Assurance & Compliance
1 45 (3.47%) QA
2 24 (1.85%) Accessibility
3 6 (0.46%) JTAG
4 3 (0.23%) GDPR
5 2 (0.15%) California Consumer Privacy Act
5 2 (0.15%) Data Quality
5 2 (0.15%) HIPAA
System Software
1 192 (14.81%) Docker
2 14 (1.08%) Firmware
3 5 (0.39%) Hyper-V
4 2 (0.15%) Active Directory
4 2 (0.15%) Virtual Machines
4 2 (0.15%) VMware ESXi
Systems Management
1 204 (15.74%) Kubernetes
2 122 (9.41%) Terraform
3 61 (4.71%) Ansible
4 32 (2.47%) Puppet
5 6 (0.46%) Grafana
6 4 (0.31%) Istio
7 3 (0.23%) Kibana
7 3 (0.23%) Podman
7 3 (0.23%) Rancher
8 2 (0.15%) Opsgenie
9 1 (0.077%) HP Fortify
9 1 (0.077%) Kiali
9 1 (0.077%) logstash
9 1 (0.077%) Progress Chef
9 1 (0.077%) Prometheus
9 1 (0.077%) Single Sign-On
Vendors
1 178 (13.73%) Red Hat
2 150 (11.57%) IBM
3 95 (7.33%) Oracle
4 92 (7.10%) Microsoft
5 74 (5.71%) Google
6 29 (2.24%) SaltStack
7 12 (0.93%) ServiceNow
8 10 (0.77%) Black Duck
8 10 (0.77%) WSO2
9 8 (0.62%) Facebook
10 7 (0.54%) ESRI
11 5 (0.39%) SAP
12 4 (0.31%) Apple
13 3 (0.23%) Atlassian
13 3 (0.23%) Databricks
13 3 (0.23%) MuleSoft
13 3 (0.23%) New Relic
13 3 (0.23%) Salesforce
13 3 (0.23%) Zend
14 2 (0.15%) Dynatrace