High Availability Jobs in the UK excluding London

High Availability
UK > UK excluding London

The table below provides summary statistics for permanent job vacancies advertised in the UK excluding London requiring High Availability skills. It includes a benchmarking guide to the annual salaries offered in vacancies that cited High Availability over the 6 months leading up to 26 July 2024, comparing them to the same period in the previous two years.

6 months to
26 Jul 2024
Same period 2023 Same period 2022
Rank 378 253 274
Rank change year-on-year -125 +21 -14
Permanent jobs citing High Availability 362 654 1,019
As % of all permanent jobs advertised in the UK excluding London 0.55% 1.36% 1.30%
As % of the Processes & Methodologies category 0.70% 1.42% 1.36%
Number of salaries quoted 296 405 658
10th Percentile £37,500 £33,500 £33,750
25th Percentile £46,063 £40,000 £41,250
Median annual salary (50th Percentile) £57,500 £55,000 £54,255
Median % change year-on-year +4.55% +1.37% +4.84%
75th Percentile £68,750 £68,750 £68,750
90th Percentile £88,750 £80,000 £76,385
UK median annual salary £60,000 £64,000 £59,526
% change year-on-year -6.25% +7.52% +3.52%

All Process and Methodology Skills
UK excluding London

High Availability falls under the Processes and Methodologies category. For comparison with the information above, the following table provides summary statistics for all permanent job vacancies requiring process or methodology skills in the UK excluding London.

Permanent vacancies with a requirement for process or methodology skills 51,975 45,995 74,754
As % of all permanent jobs advertised in the UK excluding London 79.63% 95.53% 95.46%
Number of salaries quoted 33,355 26,900 43,045
10th Percentile £28,371 £30,500 £30,076
25th Percentile £37,500 £40,000 £39,000
Median annual salary (50th Percentile) £50,000 £55,000 £52,500
Median % change year-on-year -9.09% +4.76% +6.06%
75th Percentile £65,000 £69,500 £67,500
90th Percentile £80,000 £82,050 £81,250
UK median annual salary £55,000 £60,000 £60,000
% change year-on-year -8.33% - +9.09%

High Availability
Job Vacancy Trend in the UK excluding London

Job postings citing High Availability as a proportion of all IT jobs advertised in the UK excluding London.
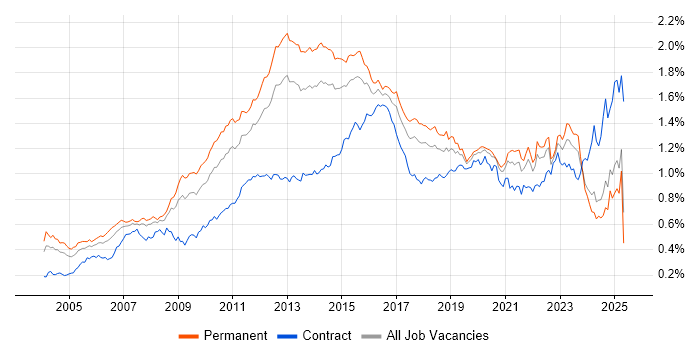
Job vacancy trend for High Availability in the UK excluding London

High Availability
Salary Trend in the UK excluding London

3-month moving average salary quoted in jobs citing High Availability in the UK excluding London.

Salary trend for High Availability in the UK excluding London

High Availability
Salary Histogram in the UK excluding London

Salary distribution for jobs citing High Availability in the UK excluding London over the 6 months to 26 July 2024.

Salary histogram for High Availability in the UK excluding London

High Availability
Job Locations in the UK excluding London

The table below looks at the demand and provides a guide to the median salaries quoted in IT jobs citing High Availability within the UK excluding London region over the 6 months to 26 July 2024. The 'Rank Change' column provides an indication of the change in demand within each location based on the same 6 month period last year.

Location Rank Change
on Same Period
Last Year
Matching
Permanent
IT Job Ads
Median Salary
Past 6 Months
Median Salary
% Change
on Same Period
Last Year
Live
Jobs
South East +10 105 £57,500 -4.17% 17
North of England -110 94 £57,500 +9.52% 13
Midlands -58 65 £52,500 -8.70% 9
North West -91 53 £57,500 +4.55% 8
South West -39 48 £57,500 +27.78% 12
West Midlands -45 41 £60,500 +15.24% 7
Yorkshire -8 32 £65,000 +85.71% 4
East of England -14 28 £57,500 -16.36% 2
East Midlands -25 24 £45,000 -21.74% 2
Scotland -65 17 £57,500 -12.01% 1
North East -9 9 £57,500 +4.55% 1
Wales +25 7 £57,500 -14.05% 2
High Availability
UK

High Availability
Co-occurring Skills and Capabilities in the UK excluding London by Category

The follow tables expand on the table above by listing co-occurrences grouped by category. The same employment type, locality and period is covered with up to 20 co-occurrences shown in each of the following categories:

Application Platforms
1 26 (7.18%) IIS
2 17 (4.70%) Microsoft Exchange
3 11 (3.04%) Apache
4 9 (2.49%) JBoss
5 8 (2.21%) SharePoint
6 7 (1.93%) Apache Spark
7 4 (1.10%) CMS
7 4 (1.10%) MQSeries
7 4 (1.10%) nginx
7 4 (1.10%) Oracle HTTP Server
7 4 (1.10%) Umbraco
7 4 (1.10%) WebSphere
8 3 (0.83%) Apache Airflow
8 3 (0.83%) GlassFish
8 3 (0.83%) Tomcat
9 2 (0.55%) WebLogic
10 1 (0.28%) Confluence
10 1 (0.28%) OpenStack
Applications
1 4 (1.10%) Microsoft Excel
1 4 (1.10%) Microsoft Office
Business Applications
1 5 (1.38%) SAP ERP
2 4 (1.10%) Maximo
2 4 (1.10%) SAP S/4HANA
3 2 (0.55%) Teamcenter
4 1 (0.28%) Oracle Applications
4 1 (0.28%) Remedy ITSM
4 1 (0.28%) SAP PLM
Cloud Services
1 177 (48.90%) Azure
2 87 (24.03%) AWS
3 47 (12.98%) Power Platform
4 35 (9.67%) SaaS
5 29 (8.01%) GCP
6 28 (7.73%) Microsoft 365
7 24 (6.63%) GitHub
8 11 (3.04%) Azure DevOps
8 11 (3.04%) Entra ID
9 10 (2.76%) Azure AKS
10 9 (2.49%) Azure Service Bus
10 9 (2.49%) Serverless
11 8 (2.21%) Amazon CloudWatch
11 8 (2.21%) Amazon S3
11 8 (2.21%) AWS CloudFormation
11 8 (2.21%) Azure App Service
11 8 (2.21%) Cloud Computing
12 6 (1.66%) OneDrive
13 5 (1.38%) Azure Data Factory
13 5 (1.38%) Datadog
Communications & Networking
1 47 (12.98%) Firewall
2 46 (12.71%) Broadband
3 28 (7.73%) SAN
4 24 (6.63%) WAN
5 23 (6.35%) VPN
6 18 (4.97%) MPLS
7 17 (4.70%) BGP
7 17 (4.70%) DNS
8 16 (4.42%) OSPF
8 16 (4.42%) SNMP
9 15 (4.14%) LAN
10 14 (3.87%) Wireless
11 12 (3.31%) Network Security
11 12 (3.31%) SD-WAN
11 12 (3.31%) WLAN
12 10 (2.76%) HTTP
12 10 (2.76%) VLAN
13 9 (2.49%) Internet
14 8 (2.21%) TCP/IP
14 8 (2.21%) Wi-Fi
Database & Business Intelligence
1 113 (31.22%) SQL Server
2 48 (13.26%) Azure SQL Database
3 47 (12.98%) Power BI
4 29 (8.01%) NoSQL
5 28 (7.73%) MySQL
6 26 (7.18%) PostgreSQL
7 23 (6.35%) Relational Database
8 22 (6.08%) Big Data
9 16 (4.42%) MongoDB
10 13 (3.59%) Amazon RDS
11 11 (3.04%) Hadoop
12 10 (2.76%) Elasticsearch
13 9 (2.49%) Oracle Database
14 6 (1.66%) Amazon Aurora
14 6 (1.66%) DynamoDB
15 5 (1.38%) Data Lake
15 5 (1.38%) MaxDB
15 5 (1.38%) SAP HANA
16 4 (1.10%) Redis
16 4 (1.10%) Scylla
Development Applications
1 35 (9.67%) Git
2 14 (3.87%) GitLab
3 13 (3.59%) Jenkins
4 9 (2.49%) Octopus Deploy
4 9 (2.49%) TeamCity
5 8 (2.21%) Bitbucket
6 7 (1.93%) Visual Studio
7 3 (0.83%) Android Studio
7 3 (0.83%) SQL Server Management Studio (SSMS)
8 2 (0.55%) Cucumber
8 2 (0.55%) IntelliJ
8 2 (0.55%) JIRA
8 2 (0.55%) JMeter
8 2 (0.55%) JUnit
9 1 (0.28%) Robot Framework
9 1 (0.28%) Selenium
General
1 157 (43.37%) Social Skills
2 42 (11.60%) Analytical Skills
3 38 (10.50%) Finance
4 16 (4.42%) Retail
5 13 (3.59%) Aerospace
5 13 (3.59%) Inclusion and Diversity
6 12 (3.31%) Law
7 8 (2.21%) Influencing Skills
7 8 (2.21%) Organisational Skills
7 8 (2.21%) Telecoms
8 7 (1.93%) Automotive
8 7 (1.93%) Manufacturing
8 7 (1.93%) Music Industry
9 6 (1.66%) Games
10 5 (1.38%) Banking
11 4 (1.10%) Back Office
11 4 (1.10%) Marketing
12 3 (0.83%) Advertising
12 3 (0.83%) Local Government
12 3 (0.83%) Police
Job Titles
1 61 (16.85%) DBA
2 50 (13.81%) Senior
3 45 (12.43%) SQL DBA
4 41 (11.33%) Lead
5 36 (9.94%) Architect
5 36 (9.94%) Developer
6 31 (8.56%) Infrastructure Engineer
7 30 (8.29%) DevOps Engineer
8 19 (5.25%) Administrator
9 18 (4.97%) Software Engineer
10 16 (4.42%) Support Engineer
11 15 (4.14%) Analyst
11 15 (4.14%) Azure Engineer
11 15 (4.14%) Operations Engineer
11 15 (4.14%) Team Leader
12 13 (3.59%) Technical Architect
13 12 (3.31%) .NET Developer
13 12 (3.31%) IT Engineer
13 12 (3.31%) Senior Developer
14 11 (3.04%) C# .NET Developer
Libraries, Frameworks & Software Standards
1 46 (12.71%) HTML
2 41 (11.33%) .NET
3 30 (8.29%) CSS
4 29 (8.01%) RESTful
5 28 (7.73%) HTML5
6 19 (5.25%) .NET Core
6 19 (5.25%) .NET Framework
7 18 (4.97%) ASP.NET
8 16 (4.42%) Kafka
8 16 (4.42%) Node.js
8 16 (4.42%) XML
9 15 (4.14%) ASP.NET Web API
9 15 (4.14%) React
10 13 (3.59%) CSS3
11 12 (3.31%) jQuery
12 9 (2.49%) Laravel
12 9 (2.49%) Symfony
13 8 (2.21%) Entity Framework
13 8 (2.21%) JSON
13 8 (2.21%) Razor View Engine
Miscellaneous
1 34 (9.39%) Clustering
2 32 (8.84%) Data Centre
3 23 (6.35%) Public Cloud
4 20 (5.52%) Replication
5 15 (4.14%) Management Information System
6 14 (3.87%) Cloud Native
6 14 (3.87%) Legacy Systems
7 13 (3.59%) Distributed Systems
8 11 (3.04%) Self-Motivation
9 8 (2.21%) Onboarding
9 8 (2.21%) Virtual Team
10 7 (1.93%) Driving Licence
10 7 (1.93%) FMCG
10 7 (1.93%) Hybrid Cloud
10 7 (1.93%) PKI
11 5 (1.38%) Blackberry
11 5 (1.38%) Cyber Threat
11 5 (1.38%) PMI
12 4 (1.10%) Data Structures
12 4 (1.10%) Team-Oriented Environment
Operating Systems
1 73 (20.17%) Windows
2 70 (19.34%) Linux
3 50 (13.81%) VMS
4 37 (10.22%) Windows Server
5 17 (4.70%) Red Hat Enterprise Linux
6 11 (3.04%) CentOS
7 7 (1.93%) Ubuntu
8 6 (1.66%) Unix
9 4 (1.10%) Amazon Linux
9 4 (1.10%) Android
9 4 (1.10%) Solaris
9 4 (1.10%) Windows Server 2016
10 3 (0.83%) AIX
10 3 (0.83%) Debian
10 3 (0.83%) Rocky
10 3 (0.83%) Windows Server 2019
11 2 (0.55%) Windows Server 2012
12 1 (0.28%) Windows 10
Processes & Methodologies
1 125 (34.53%) Problem-Solving
2 103 (28.45%) Disaster Recovery
3 82 (22.65%) Performance Tuning
4 76 (20.99%) DevOps
5 59 (16.30%) Collaborative Working
6 55 (15.19%) CI/CD
7 54 (14.92%) Business Intelligence
8 53 (14.64%) Agile
9 52 (14.36%) Continuous Improvement
10 44 (12.15%) Computer Science
11 38 (10.50%) Infrastructure Engineering
12 35 (9.67%) Infrastructure as Code
13 34 (9.39%) Cybersecurity
13 34 (9.39%) Software Engineering
14 26 (7.18%) Customer Service
14 26 (7.18%) Roadmaps
15 24 (6.63%) Mentoring
15 24 (6.63%) Migration
16 23 (6.35%) ITIL
17 22 (6.08%) Containerisation
Programming Languages
1 140 (38.67%) SQL
2 55 (15.19%) T-SQL
3 50 (13.81%) Python
4 37 (10.22%) C#
4 37 (10.22%) JavaScript
5 33 (9.12%) Java
6 32 (8.84%) PowerShell
7 19 (5.25%) Bash
8 17 (4.70%) Go
9 14 (3.87%) C
9 14 (3.87%) PHP
10 12 (3.31%) C++
11 6 (1.66%) Embedded C++
11 6 (1.66%) TypeScript
12 5 (1.38%) ABAP
12 5 (1.38%) Perl
12 5 (1.38%) Shell Script
13 4 (1.10%) Scala
14 3 (0.83%) VB.NET
15 2 (0.55%) PL/SQL
Qualifications
1 70 (19.34%) Degree
2 54 (14.92%) Microsoft Certification
3 35 (9.67%) Security Cleared
4 28 (7.73%) Computer Science Degree
5 20 (5.52%) SC Cleared
6 17 (4.70%) Cisco Certification
7 13 (3.59%) DV Cleared
8 12 (3.31%) Azure Certification
9 11 (3.04%) CCNP
10 9 (2.49%) CCIE
11 7 (1.93%) CCDP
11 7 (1.93%) CCIE Routing and Switching
12 6 (1.66%) Master's Degree
12 6 (1.66%) RHCE
13 5 (1.38%) HND
13 5 (1.38%) PMI Certification
13 5 (1.38%) RHCSA
14 4 (1.10%) CTC Cleared
15 3 (0.83%) CCNA
15 3 (0.83%) CISSP
Quality Assurance & Compliance
1 23 (6.35%) QA
2 16 (4.42%) SLA
3 14 (3.87%) GDPR
4 7 (1.93%) ISO 9001
4 7 (1.93%) ISO/IEC 27001
5 6 (1.66%) HIPAA
6 5 (1.38%) Data Quality
7 1 (0.28%) ISO/IEC 20000
7 1 (0.28%) NIST
7 1 (0.28%) PCI DSS
7 1 (0.28%) PMO
System Software
1 56 (15.47%) Virtual Machines
2 51 (14.09%) Active Directory
3 38 (10.50%) VMware Infrastructure
4 31 (8.56%) Docker
5 17 (4.70%) VMware ESXi
6 13 (3.59%) Firmware
7 7 (1.93%) Hyper-V
8 6 (1.66%) Virtual Desktop
8 6 (1.66%) vSphere
9 5 (1.38%) Virtual Servers
9 5 (1.38%) VMware NSX
10 2 (0.55%) Oracle RAC
11 1 (0.28%) DFS Replication
11 1 (0.28%) Microsoft Virtual Server
11 1 (0.28%) XenApp
11 1 (0.28%) XenDesktop
Systems Management
1 50 (13.81%) Kubernetes
2 39 (10.77%) Terraform
3 24 (6.63%) Ansible
4 13 (3.59%) Puppet
5 11 (3.04%) Grafana
5 11 (3.04%) Microsoft Clustering
6 9 (2.49%) Nagios
7 8 (2.21%) Failover Clustering
7 8 (2.21%) Microsoft Intune
7 8 (2.21%) Single Sign-On
8 6 (1.66%) vCenter Server
8 6 (1.66%) WSUS
9 5 (1.38%) Oracle Enterprise Manager
9 5 (1.38%) Progress Chef
9 5 (1.38%) Prometheus
10 4 (1.10%) Active Directory Federation Services
10 4 (1.10%) Cacti
11 3 (0.83%) Data Guard
11 3 (0.83%) Oracle Statspack
11 3 (0.83%) SCCM
Vendors
1 141 (38.95%) Microsoft
2 48 (13.26%) VMware
3 25 (6.91%) Cisco
4 21 (5.80%) Oracle
5 17 (4.70%) Veeam
6 13 (3.59%) New Relic
6 13 (3.59%) Red Hat
7 11 (3.04%) SAP
8 9 (2.49%) Splunk
9 8 (2.21%) Google
10 7 (1.93%) Ekahau
11 6 (1.66%) IBM
12 5 (1.38%) Atlassian
12 5 (1.38%) Citrix
12 5 (1.38%) Databricks
12 5 (1.38%) Dell
12 5 (1.38%) McAfee
12 5 (1.38%) Sybase
13 4 (1.10%) Fortinet
13 4 (1.10%) SolarWinds