VMware ESXi Jobs with Work from Home Options

VMware ESXi (formerly ESX Server)
UK > Work from Home

The table below provides summary statistics for permanent remote or hybrid work requiring VMware ESXi skills. It includes a benchmarking guide to the annual salaries offered in vacancies that cited VMware ESXi over the 6 months leading up to 26 July 2024, comparing them to the same period in the previous two years.

6 months to
26 Jul 2024
Same period 2023 Same period 2022
Rank 417 470 640
Rank change year-on-year +53 +170 -73
Permanent jobs citing VMware ESXi 117 110 280
As % of all permanent jobs with a WFH option 0.42% 0.34% 0.36%
As % of the System Software category 3.56% 2.35% 1.85%
Number of salaries quoted 95 93 234
10th Percentile £36,250 £27,000 £31,650
25th Percentile £42,500 £38,250 £41,250
Median annual salary (50th Percentile) £50,000 £50,000 £50,000
75th Percentile £57,000 £57,500 £61,938
90th Percentile £87,500 £86,750 £71,750
UK median annual salary £51,000 £48,000 £47,500
% change year-on-year +6.25% +1.05% +5.56%

All System Software Skills
Work from Home

VMware ESXi falls under the System Software category. For comparison with the information above, the following table provides summary statistics for all permanent job vacancies with remote or hybrid options requiring system software skills.

Permanent vacancies with a requirement for system software skills 3,287 4,676 15,106
As % of all permanent jobs with a WFH option 11.77% 14.25% 19.24%
Number of salaries quoted 2,404 3,848 8,000
10th Percentile £31,250 £32,000 £32,500
25th Percentile £41,250 £45,000 £45,000
Median annual salary (50th Percentile) £55,000 £62,500 £60,000
Median % change year-on-year -12.00% +4.17% -
75th Percentile £70,000 £80,000 £82,500
90th Percentile £85,000 £92,500 £95,000
UK median annual salary £50,000 £55,000 £55,000
% change year-on-year -9.09% - -

VMware ESXi
Trend for Jobs with a WFH Option

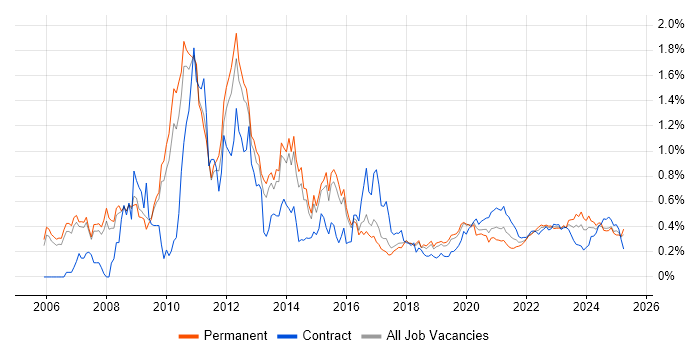
Job vacancies with a work from home option citing VMware ESXi as a proportion of all IT jobs advertised.

VMware ESXi trend for jobs with a WFH option

VMware ESXi
Salary Trend for Jobs with a WFH Option

3-month moving average salary quoted in job vacancies with a work from home option citing VMware ESXi.

VMware ESXi salary trend for jobs with a WFH option

VMware ESXi
Salary Histogram for Jobs with a WFH Option

Salary distribution for jobs with a work from home option citing VMware ESXi over the 6 months to 26 July 2024.

VMware ESXi salary histogram for jobs with a WFH option

VMware ESXi
Co-occurring Skills and Capabilities with WFH Options by Category

The follow tables expand on the table above by listing co-occurrences grouped by category. The same employment type, locality and period is covered with up to 20 co-occurrences shown in each of the following categories:

Application Platforms
1 49 (41.88%) Microsoft Exchange
2 21 (17.95%) SharePoint
3 4 (3.42%) WebSphere
4 2 (1.71%) IIS
Applications
1 2 (1.71%) Microsoft Office
2 1 (0.85%) MS Visio
Cloud Services
1 63 (53.85%) Azure
2 50 (42.74%) Microsoft 365
3 35 (29.91%) Entra ID
4 13 (11.11%) Nutanix
5 12 (10.26%) AWS
6 10 (8.55%) SaaS
7 3 (2.56%) Azure DevOps
7 3 (2.56%) IaaS
7 3 (2.56%) OneDrive
8 2 (1.71%) OpenShift
8 2 (1.71%) PaaS
8 2 (1.71%) WhatsApp
9 1 (0.85%) Amazon S3
9 1 (0.85%) Azure ExpressRoute
9 1 (0.85%) Azure Sentinel
9 1 (0.85%) Azure Stack
9 1 (0.85%) Azure Storage
9 1 (0.85%) Cloudflare
9 1 (0.85%) GCP
Communications & Networking
1 42 (35.90%) DNS
1 42 (35.90%) Firewall
2 31 (26.50%) VPN
3 29 (24.79%) LAN
4 28 (23.93%) DHCP
5 23 (19.66%) WAN
6 19 (16.24%) VLAN
7 17 (14.53%) Wi-Fi
8 16 (13.68%) Internet
8 16 (13.68%) MPLS
8 16 (13.68%) Remote Desktop
9 14 (11.97%) TCP/IP
10 11 (9.40%) SAN
11 8 (6.84%) Wireless
12 6 (5.13%) HTTP
12 6 (5.13%) SMTP
12 6 (5.13%) SNMP
12 6 (5.13%) SSL
13 5 (4.27%) FTP
13 5 (4.27%) WLAN
Database & Business Intelligence
1 12 (10.26%) SQL Server
2 11 (9.40%) Amazon RDS
3 4 (3.42%) DB2
4 3 (2.56%) MySQL
4 3 (2.56%) NoSQL
4 3 (2.56%) PostgreSQL
4 3 (2.56%) Redis
4 3 (2.56%) TimescaleDB
5 2 (1.71%) RDBMS
5 2 (1.71%) Relational Database
6 1 (0.85%) Elasticsearch
6 1 (0.85%) MongoDB
6 1 (0.85%) Oracle Database
Development Applications
1 9 (7.69%) JIRA
2 1 (0.85%) Jenkins
General
1 45 (38.46%) Social Skills
2 24 (20.51%) Finance
3 15 (12.82%) Public Sector
4 10 (8.55%) Analytical Skills
5 5 (4.27%) Telecoms
6 4 (3.42%) Documentation Skills
7 3 (2.56%) Organisational Skills
8 2 (1.71%) Aerospace
8 2 (1.71%) Inclusion and Diversity
8 2 (1.71%) Law
8 2 (1.71%) Legal
9 1 (0.85%) Advertising
9 1 (0.85%) Back Office
Job Titles
1 54 (46.15%) Infrastructure Engineer
2 31 (26.50%) Support Engineer
3 28 (23.93%) Senior
4 25 (21.37%) Infrastructure Support
4 25 (21.37%) Infrastructure Support Engineer
5 18 (15.38%) Senior Infrastructure Engineer
6 17 (14.53%) VMware Engineer
6 17 (14.53%) VMware Infrastructure Engineer
7 16 (13.68%) Project Manager
7 16 (13.68%) VMware Support Engineer
8 13 (11.11%) Wintel Engineer
9 12 (10.26%) Data Centre Manager
9 12 (10.26%) Data Centre Project Manager
10 10 (8.55%) Virtualisation Engineer
10 10 (8.55%) Wintel Infrastructure Engineer
11 9 (7.69%) 3rd Line Engineer
11 9 (7.69%) Infrastructure Manager
11 9 (7.69%) Senior Infrastructure Support Engineer
11 9 (7.69%) Senior Support Engineer
12 8 (6.84%) IT Engineer
Libraries, Frameworks & Software Standards
1 10 (8.55%) REST
2 4 (3.42%) WebSphere MQ
3 3 (2.56%) ActiveMQ
3 3 (2.56%) CSS
3 3 (2.56%) Flask
3 3 (2.56%) HTML
3 3 (2.56%) jQuery
3 3 (2.56%) JSON
3 3 (2.56%) Plotly
4 2 (1.71%) ADO
4 2 (1.71%) ARM Templates
4 2 (1.71%) RESTful
4 2 (1.71%) XML
4 2 (1.71%) YAML
5 1 (0.85%) 802.1X
5 1 (0.85%) Elastic Stack
5 1 (0.85%) Middleware
Miscellaneous
1 37 (31.62%) Clustering
2 26 (22.22%) Data Centre
3 23 (19.66%) Public Cloud
4 17 (14.53%) PKI
5 12 (10.26%) Self-Motivation
6 10 (8.55%) Enterprise Cloud
6 10 (8.55%) Hybrid Cloud
7 7 (5.98%) Management Information System
7 7 (5.98%) Replication
8 5 (4.27%) EFT
8 5 (4.27%) Private Cloud
9 4 (3.42%) Algorithms
10 2 (1.71%) EMC VNX
10 2 (1.71%) Onboarding
11 1 (0.85%) Data Structures
11 1 (0.85%) Driving Licence
11 1 (0.85%) IoT
11 1 (0.85%) Linux Command Line
11 1 (0.85%) Product Ownership
Operating Systems
1 85 (72.65%) Windows
2 75 (64.10%) Windows Server
3 35 (29.91%) Windows Server 2012
4 19 (16.24%) Linux
5 16 (13.68%) Windows Server 2019
6 15 (12.82%) Windows Server 2016
7 9 (7.69%) Windows 10
8 6 (5.13%) Red Hat Enterprise Linux
9 4 (3.42%) Ubuntu
10 3 (2.56%) Windows Server 2008
11 1 (0.85%) Unix
Processes & Methodologies
1 54 (46.15%) Infrastructure Engineering
2 21 (17.95%) Problem-Solving
3 19 (16.24%) Agile
4 18 (15.38%) Project Management
5 17 (14.53%) ITIL
6 16 (13.68%) Change Management
6 16 (13.68%) PRINCE2
7 15 (12.82%) Customer Requirements
7 15 (12.82%) Problem Management
8 14 (11.97%) Service Management
9 13 (11.11%) Mentoring
10 11 (9.40%) Capacity Management
10 11 (9.40%) Proactive Monitoring
11 10 (8.55%) Business Strategy
11 10 (8.55%) Coaching
11 10 (8.55%) Continuous Improvement
11 10 (8.55%) Converged Infrastructure
11 10 (8.55%) Information Security
11 10 (8.55%) Operational Stability
11 10 (8.55%) Systems Engineering
Programming Languages
1 50 (42.74%) PowerShell
2 15 (12.82%) ActionScript
2 15 (12.82%) VB
3 7 (5.98%) Python
4 4 (3.42%) C
4 4 (3.42%) Java
5 3 (2.56%) C#
5 3 (2.56%) C++
5 3 (2.56%) JavaScript
5 3 (2.56%) Perl
5 3 (2.56%) SQL
6 2 (1.71%) Lua
6 2 (1.71%) Ruby
6 2 (1.71%) Tcl
7 1 (0.85%) Bash
7 1 (0.85%) Go
Qualifications
1 22 (18.80%) Degree
2 16 (13.68%) APMP
3 7 (5.98%) Security Cleared
4 6 (5.13%) Microsoft Certification
5 5 (4.27%) HND
5 5 (4.27%) VMware Certified Professional (VCP)
6 4 (3.42%) Azure Certification
6 4 (3.42%) Computer Science Degree
6 4 (3.42%) MCSE
6 4 (3.42%) RHCA
6 4 (3.42%) SC Cleared
6 4 (3.42%) TOGAF Certification
7 2 (1.71%) DV Cleared
7 2 (1.71%) HNC
7 2 (1.71%) MCSA
8 1 (0.85%) CCNA
8 1 (0.85%) ITIL Certification
8 1 (0.85%) Master's Degree
8 1 (0.85%) Microsoft Certified Architect
8 1 (0.85%) Numerate Degree
Quality Assurance & Compliance
1 15 (12.82%) SLA
2 3 (2.56%) ISO/IEC 27001
3 1 (0.85%) ISO/IEC 27002 (supersedes ISO/IEC 17799)
3 1 (0.85%) NIST
3 1 (0.85%) PMO
System Software
1 94 (80.34%) Active Directory
2 84 (71.79%) VMware Infrastructure
3 37 (31.62%) Hyper-V
4 30 (25.64%) vSphere
5 15 (12.82%) OpenSSH
5 15 (12.82%) XenApp
6 9 (7.69%) Virtual Machines
7 4 (3.42%) Microsoft Virtual Server
7 4 (3.42%) Virtual Servers
7 4 (3.42%) XenDesktop
8 3 (2.56%) Docker
8 3 (2.56%) Firmware
8 3 (2.56%) KVM
9 2 (1.71%) NFS
10 1 (0.85%) Virtual Desktop
Systems Management
1 53 (45.30%) vCenter Server
2 18 (15.38%) Microsoft Intune
2 18 (15.38%) WSUS
3 17 (14.53%) SCCM
4 16 (13.68%) PowerCLI
5 15 (12.82%) Ansible
5 15 (12.82%) IBM BigFix
6 11 (9.40%) Single Sign-On
7 10 (8.55%) Failover Clustering
8 9 (7.69%) Microsoft Clustering
9 4 (3.42%) SCOM
10 3 (2.56%) FortiGate
10 3 (2.56%) HAProxy
10 3 (2.56%) Nagios
10 3 (2.56%) Puppet
10 3 (2.56%) Tivoli Identity Manager
10 3 (2.56%) vRealize
11 2 (1.71%) Kubernetes
11 2 (1.71%) Progress Chef
11 2 (1.71%) Terraform
Vendors
1 107 (91.45%) VMware
2 47 (40.17%) Microsoft
3 37 (31.62%) Cisco
4 32 (27.35%) Citrix
5 22 (18.80%) IBM
6 16 (13.68%) Ruckus Wireless
7 14 (11.97%) Veeam
8 12 (10.26%) ServiceNow
9 10 (8.55%) Commvault
10 9 (7.69%) HP
10 9 (7.69%) Sun
11 8 (6.84%) Dell
11 8 (6.84%) Juniper
11 8 (6.84%) Meraki
11 8 (6.84%) Red Hat
12 5 (4.27%) Extreme Networks
12 5 (4.27%) Globalscape
12 5 (4.27%) Oracle
13 4 (3.42%) Aruba
14 3 (2.56%) SolarWinds