Vulnerability Scanning Jobs with Work from Home Options

Vulnerability Scanning
UK > Work from Home

The table below provides summary statistics for permanent job vacancies with an option to work from home (WFH) and a requirement for Vulnerability Scanning skills. Included is a benchmarking guide to the salaries offered in vacancies that have cited Vulnerability Scanning over the 6 months to 10 May 2024 with a comparison to the same period in the previous 2 years.

6 months to
10 May 2024
Same period 2023 Same period 2022
Rank 507 544 724
Rank change year-on-year +37 +180 -217
Permanent jobs citing Vulnerability Scanning 86 114 121
As % of all permanent jobs with a WFH option 0.25% 0.28% 0.18%
As % of the Processes & Methodologies category 0.28% 0.29% 0.18%
Number of salaries quoted 73 90 90
10th Percentile £38,250 £45,211 £39,897
25th Percentile £47,500 £51,250 £43,750
Median annual salary (50th Percentile) £55,000 £59,526 £50,000
Median % change year-on-year -7.60% +19.05% -0.50%
75th Percentile £75,000 £86,563 £69,688
90th Percentile £80,000 £103,750 £80,125
UK median annual salary £60,000 £55,554 £60,000
% change year-on-year +8.00% -7.41% +14.29%

All Process and Methodology Skills
Work from Home

Vulnerability Scanning is in the Processes and Methodologies category. The following table is for comparison with the above and provides summary statistics for all permanent job vacancies with a WFH option and a requirement for process or methodology skills.

Permanent vacancies with a requirement for process or methodology skills 30,902 39,630 66,571
As % of all permanent jobs with a WFH option 91.40% 96.09% 96.98%
Number of salaries quoted 23,451 27,583 41,127
10th Percentile £33,750 £37,500 £36,250
25th Percentile £42,500 £47,500 £45,750
Median annual salary (50th Percentile) £57,500 £62,500 £60,000
Median % change year-on-year -8.00% +4.17% +9.09%
75th Percentile £75,000 £82,500 £80,000
90th Percentile £95,000 £100,000 £95,000
UK median annual salary £55,000 £61,190 £60,000
% change year-on-year -10.12% +1.98% +9.09%

Vulnerability Scanning
Trend for Jobs with a WFH Option

Job vacancies with a work from home option citing Vulnerability Scanning as a proportion of all IT jobs advertised.
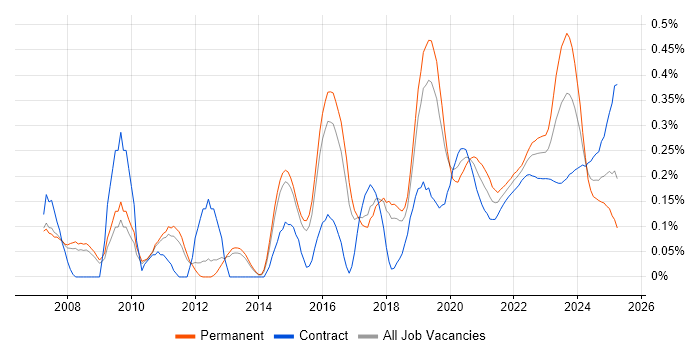
Vulnerability Scanning trend for jobs with a WFH option

Vulnerability Scanning
Salary Trend for Jobs with a WFH Option

3-month moving average salary quoted in job vacancies with a work from home option citing Vulnerability Scanning.

Vulnerability Scanning salary trend for jobs with a WFH option

Vulnerability Scanning
Salary Histogram for Jobs with a WFH Option

Salary distribution for jobs with a work from home option citing Vulnerability Scanning over the 6 months to 10 May 2024.

Vulnerability Scanning salary histogram for jobs with a WFH option

Vulnerability Scanning
Co-occurring Skills and Capabilities with WFH Options by Category

The follow tables expand on the table above by listing co-occurrences grouped by category. The same employment type, locality and period is covered with up to 20 co-occurrences shown in each of the following categories:

Application Platforms
1 6 (6.98%) Microsoft Exchange
Applications
1 7 (8.14%) Microsoft Office
2 1 (1.16%) Microsoft Excel
2 1 (1.16%) MS Visio
Business Applications
1 1 (1.16%) Remedy ITSM
Cloud Services
1 38 (44.19%) Azure
2 22 (25.58%) Microsoft 365
3 19 (22.09%) AWS
4 11 (12.79%) Google Workspace
5 10 (11.63%) SaaS
6 7 (8.14%) Entra ID
7 5 (5.81%) IaaS
8 4 (4.65%) Mimecast
9 3 (3.49%) Amazon GuardDuty
9 3 (3.49%) Azure Monitor
9 3 (3.49%) PaaS
10 2 (2.33%) AWS CloudTrail
10 2 (2.33%) AWS Control Tower
11 1 (1.16%) Azure AKS
11 1 (1.16%) Azure DevOps
11 1 (1.16%) Azure Storage
11 1 (1.16%) GCP
Communications & Networking
1 42 (48.84%) Firewall
2 16 (18.60%) Network Security
3 14 (16.28%) DNS
3 14 (16.28%) Wireless
4 12 (13.95%) VPN
5 11 (12.79%) Broadband
5 11 (12.79%) NAS
6 10 (11.63%) VLAN
7 6 (6.98%) Wireshark
8 4 (4.65%) LAN
8 4 (4.65%) WAN
9 2 (2.33%) BGP
9 2 (2.33%) Intrusion Detection
9 2 (2.33%) IPsec
9 2 (2.33%) OSPF
10 1 (1.16%) Cisco ISE
10 1 (1.16%) DHCP
10 1 (1.16%) TCP/IP
Database & Business Intelligence
1 6 (6.98%) SQL Server
2 2 (2.33%) MongoDB
3 1 (1.16%) Azure SQL Database
Development Applications
1 6 (6.98%) Snyk
2 4 (4.65%) Jenkins
3 3 (3.49%) Burp Suite
3 3 (3.49%) Metasploit
General
1 22 (25.58%) Social Skills
2 21 (24.42%) Analytical Skills
3 13 (15.12%) Finance
4 11 (12.79%) Games
5 7 (8.14%) Aerospace
5 7 (8.14%) Aviation
5 7 (8.14%) Inclusion and Diversity
5 7 (8.14%) Influencing Skills
5 7 (8.14%) Military
6 5 (5.81%) Legal
7 3 (3.49%) Public Sector
8 2 (2.33%) Manufacturing
9 1 (1.16%) Pharmaceutical
Job Titles
1 14 (16.28%) Consultant
1 14 (16.28%) IT Consultant
2 13 (15.12%) Analyst
2 13 (15.12%) Senior
3 12 (13.95%) Security Analyst
4 10 (11.63%) Architect
4 10 (11.63%) Cybersecurity Analyst
4 10 (11.63%) Infrastructure Architect
5 7 (8.14%) Security Manager
6 6 (6.98%) Email Analyst
6 6 (6.98%) IT Analyst
6 6 (6.98%) IT Security Analyst
6 6 (6.98%) Network Engineer
6 6 (6.98%) Security Engineer
6 6 (6.98%) Senior Network Engineer
6 6 (6.98%) Vulnerability Analyst
6 6 (6.98%) Vulnerability Management Analyst
7 5 (5.81%) Cloud Engineer
7 5 (5.81%) Infrastructure Engineer
7 5 (5.81%) IT Engineer
Libraries, Frameworks & Software Standards
1 2 (2.33%) OAuth
1 2 (2.33%) OpenID
1 2 (2.33%) SAML
2 1 (1.16%) ARM Templates
2 1 (1.16%) JSON
Miscellaneous
1 14 (16.28%) Management Information System
2 12 (13.95%) Onboarding
3 11 (12.79%) Video Conferencing
4 7 (8.14%) Cyber Threat
4 7 (8.14%) IoT
4 7 (8.14%) Operational Technology
5 6 (6.98%) Security Posture
6 5 (5.81%) Security Operations Centre
7 4 (4.65%) Cloud Native
7 4 (4.65%) Cyber Security Posture
8 3 (3.49%) Mobile App
9 2 (2.33%) Data Centre
9 2 (2.33%) Distributed Denial-of-Service
9 2 (2.33%) Life Science
9 2 (2.33%) PKI
9 2 (2.33%) Renewable Energy
9 2 (2.33%) Virtual Team
10 1 (1.16%) Cyberattack
10 1 (1.16%) Data Protection Act
10 1 (1.16%) Linux Command Line
Operating Systems
1 36 (41.86%) Windows
1 36 (41.86%) Windows Server
2 20 (23.26%) Unix
3 11 (12.79%) Mac OS
4 8 (9.30%) Linux
5 4 (4.65%) Windows Server 2016
6 3 (3.49%) Kali Linux
6 3 (3.49%) VMS
7 2 (2.33%) Windows 10
7 2 (2.33%) Windows Server 2012
Processes & Methodologies
1 49 (56.98%) Cybersecurity
2 32 (37.21%) SIEM
3 26 (30.23%) Penetration Testing
4 21 (24.42%) Vulnerability Management
5 20 (23.26%) Information Security
5 20 (23.26%) Problem-Solving
6 19 (22.09%) Security Operations
7 18 (20.93%) Data Protection
8 14 (16.28%) Business Continuity
9 13 (15.12%) Identity Management
9 13 (15.12%) Incident Response
9 13 (15.12%) Patch Management
9 13 (15.12%) Threat and Vulnerability Management
10 12 (13.95%) Computer Science
11 11 (12.79%) Asset Management
11 11 (12.79%) Cloud Security
11 11 (12.79%) IT Audit
11 11 (12.79%) Mobile Device Management
12 10 (11.63%) Roadmaps
12 10 (11.63%) Threat Management
Programming Languages
1 16 (18.60%) PowerShell
2 12 (13.95%) Bash
3 8 (9.30%) Python
4 3 (3.49%) Java
4 3 (3.49%) JavaScript
5 1 (1.16%) SQL
Qualifications
1 7 (8.14%) Degree
2 4 (4.65%) Security Cleared
3 3 (3.49%) CISSP
3 3 (3.49%) CREST Certified
3 3 (3.49%) OSCE
3 3 (3.49%) OSCP
3 3 (3.49%) SC Cleared
4 2 (2.33%) CISA
5 1 (1.16%) AWS Certification
5 1 (1.16%) Azure Certification
5 1 (1.16%) CISM
5 1 (1.16%) Computer Science Degree
5 1 (1.16%) Master's Degree
5 1 (1.16%) Microsoft Certification
Quality Assurance & Compliance
1 32 (37.21%) ISO/IEC 27001
2 22 (25.58%) Cyber Essentials
3 17 (19.77%) SOC 2
4 10 (11.63%) GDPR
5 8 (9.30%) NCSC
5 8 (9.30%) PCI DSS
6 7 (8.14%) DO-254
7 6 (6.98%) GRC
8 2 (2.33%) Cyber Essentials PLUS
8 2 (2.33%) HIPAA
8 2 (2.33%) NIST
9 1 (1.16%) GxP
9 1 (1.16%) ISO/IEC 27002 (supersedes ISO/IEC 17799)
9 1 (1.16%) SLA
System Software
1 22 (25.58%) Active Directory
2 16 (18.60%) Hyper-V
3 14 (16.28%) VMware Infrastructure
4 10 (11.63%) Virtual Machines
5 3 (3.49%) Docker
6 2 (2.33%) VMware ESXi
Systems Management
1 13 (15.12%) Nessus
2 11 (12.79%) SCCM
2 11 (12.79%) Single Sign-On
3 10 (11.63%) Microsoft Intune
4 6 (6.98%) CSIRT
4 6 (6.98%) Nexpose
5 5 (5.81%) Terraform
5 5 (5.81%) WSUS
6 3 (3.49%) Kubernetes
6 3 (3.49%) Nmap
7 2 (2.33%) Grafana
7 2 (2.33%) SolarWinds Orion
8 1 (1.16%) Active Directory Federation Services
8 1 (1.16%) DatAdvantage
8 1 (1.16%) QRadar
8 1 (1.16%) Stealthwatch
8 1 (1.16%) Symantec Endpoint Protection
8 1 (1.16%) vCenter Server
Vendors
1 32 (37.21%) Microsoft
2 24 (27.91%) VMware
3 17 (19.77%) Qualys
4 11 (12.79%) Apple
4 11 (12.79%) Google
5 7 (8.14%) Cisco
6 6 (6.98%) Dell
7 4 (4.65%) Aderant
7 4 (4.65%) HP
7 4 (4.65%) iManage
8 2 (2.33%) arcserve
8 2 (2.33%) Juniper
8 2 (2.33%) SolarWinds
8 2 (2.33%) Veeam
9 1 (1.16%) BMC
9 1 (1.16%) Rapid7
9 1 (1.16%) Remedy
9 1 (1.16%) ServiceNow
9 1 (1.16%) Splunk
9 1 (1.16%) Symantec