Bash Jobs with Hybrid/Remote/WFH Options

Bash Shell
UK > Work from Home

The table below provides summary statistics for permanent remote or hybrid work requiring Bash skills. It includes a benchmarking guide to the annual salaries offered in vacancies that cited Bash over the 6 months leading up to 2 July 2025, comparing them to the same period in the previous two years.

6 months to
2 Jul 2025
Same period 2024 Same period 2023
Rank 106 192 116
Rank change year-on-year +86 -76 +47
Permanent jobs citing Bash 664 598 1,018
As % of all permanent jobs with a WFH option 3.27% 1.73% 2.83%
As % of the Programming Languages category 9.39% 4.31% 5.99%
Number of salaries quoted 157 316 716
10th Percentile £48,306 £43,000 £42,874
25th Percentile £55,000 £47,500 £57,500
Median annual salary (50th Percentile) £70,000 £62,500 £71,000
Median % change year-on-year +12.00% -11.97% +1.43%
75th Percentile £85,000 £80,000 £91,250
90th Percentile £93,000 £97,362 £122,500
UK median annual salary £67,500 £61,250 £70,000
% change year-on-year +10.20% -12.50% -

All Programming Languages
Work from Home

Bash falls under the Programming Languages category. For comparison with the information above, the following table provides summary statistics for all permanent job vacancies with remote or hybrid options requiring coding skills.

Permanent vacancies with a requirement for coding skills 7,075 13,874 17,002
As % of all permanent jobs with a WFH option 34.88% 40.19% 47.29%
Number of salaries quoted 4,431 11,219 13,300
10th Percentile £38,750 £38,750 £40,579
25th Percentile £47,683 £46,250 £50,000
Median annual salary (50th Percentile) £62,500 £60,000 £65,000
Median % change year-on-year +4.17% -7.69% +4.00%
75th Percentile £83,750 £80,000 £85,000
90th Percentile £115,000 £105,000 £105,000
UK median annual salary £60,000 £60,000 £65,000
% change year-on-year - -7.69% +4.00%

Bash
Trend for Jobs with a WFH Option

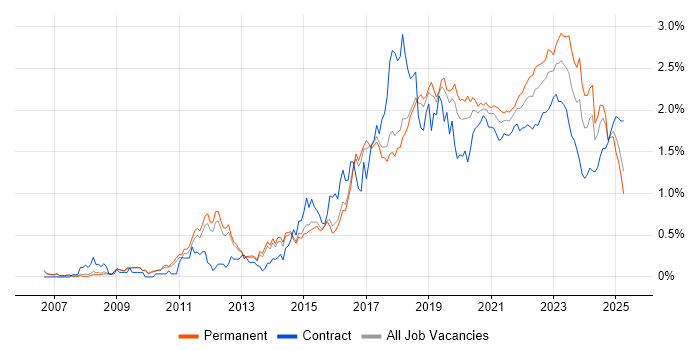
Job vacancies with remote working options citing Bash as a proportion of all IT jobs advertised.

Bash trend for jobs with Hybrid/Remote/WFH options

Bash
Salary Trend for Jobs with a WFH Option

3-month moving average salary quoted in job vacancies with remote working options citing Bash.

Bash salary trend for jobs with a WFH option

Bash
Salary Histogram for Jobs with a WFH Option

Salary distribution for jobs with remote working options citing Bash over the 6 months to 2 July 2025.

Bash salary histogram for jobs with a WFH option

Bash
Co-occurring Skills and Capabilities with WFH Options by Category

The follow tables expand on the table above by listing co-occurrences grouped by category. The same employment type, locality and period is covered with up to 20 co-occurrences shown in each of the following categories:

Application Platforms
1 8 (1.20%) Apache Spark
2 7 (1.05%) Confluence
2 7 (1.05%) Microsoft Exchange
3 4 (0.60%) SharePoint
4 3 (0.45%) IIS
5 2 (0.30%) Apache Airflow
5 2 (0.30%) nginx
5 2 (0.30%) Tomcat
6 1 (0.15%) Apache
Applications
1 14 (2.11%) Microsoft Excel
2 3 (0.45%) Microsoft Office
3 1 (0.15%) AutoCAD
3 1 (0.15%) Autodesk Inventor
3 1 (0.15%) SOLIDWORKS
3 1 (0.15%) Weka
Cloud Services
1 284 (42.77%) AWS
2 215 (32.38%) Pulumi
3 82 (12.35%) Azure
4 33 (4.97%) GitHub
5 31 (4.67%) Azure DevOps
6 25 (3.77%) GCP
7 24 (3.61%) Serverless
8 20 (3.01%) GitHub Actions
9 18 (2.71%) Amazon CloudWatch
10 17 (2.56%) AWS CloudFormation
11 16 (2.41%) AWS Lambda
12 15 (2.26%) Azure Monitor
13 13 (1.96%) SaaS
14 12 (1.81%) Microsoft 365
15 11 (1.66%) Azure Data Factory
15 11 (1.66%) Power Platform
16 10 (1.51%) Amazon S3
16 10 (1.51%) Entra ID
17 9 (1.36%) Amazon EC2
18 8 (1.20%) IaaS
Communications & Networking
1 270 (40.66%) VPN
2 262 (39.46%) Cisco IOS
3 219 (32.98%) Broadband
4 14 (2.11%) Firewall
5 13 (1.96%) DNS
6 7 (1.05%) DHCP
7 6 (0.90%) 5G
7 6 (0.90%) TCP/IP
8 4 (0.60%) HTTPS
8 4 (0.60%) InfiniBand
8 4 (0.60%) IPv4
8 4 (0.60%) VLAN
9 2 (0.30%) Internet
9 2 (0.30%) Multicast
9 2 (0.30%) Network Security
9 2 (0.30%) OSPF
9 2 (0.30%) SD-WAN
9 2 (0.30%) WAN
10 1 (0.15%) LTE
10 1 (0.15%) Software-Defined Radio
Database & Business Intelligence
1 221 (33.28%) NoSQL
1 221 (33.28%) Relational Database
2 217 (32.68%) RDBMS
3 11 (1.66%) Data Warehouse
3 11 (1.66%) Power BI
3 11 (1.66%) SQL Server Integration Services
3 11 (1.66%) SQL Server Reporting Services
4 9 (1.36%) Amazon RDS
5 8 (1.20%) Big Data
5 8 (1.20%) SQL Server
6 6 (0.90%) MySQL
7 4 (0.60%) PostgreSQL
8 3 (0.45%) Amazon Aurora
8 3 (0.45%) Amazon Redshift
9 2 (0.30%) DynamoDB
9 2 (0.30%) Elasticsearch
9 2 (0.30%) Metadata
9 2 (0.30%) MongoDB
10 1 (0.15%) Redis
10 1 (0.15%) SQLite
Development Applications
1 215 (32.38%) Jaeger
2 33 (4.97%) Git
3 26 (3.92%) Jenkins
4 18 (2.71%) GitLab
5 13 (1.96%) JIRA
6 6 (0.90%) Visual Studio
7 5 (0.75%) WiX
8 4 (0.60%) Artifactory
9 3 (0.45%) Sonatype Nexus
9 3 (0.45%) TeamCity
10 2 (0.30%) Bitbucket
11 1 (0.15%) Atlassian Bamboo
11 1 (0.15%) Burp Suite
11 1 (0.15%) CMake
11 1 (0.15%) Maven
11 1 (0.15%) Metasploit
11 1 (0.15%) MSBuild
11 1 (0.15%) SonarQube
11 1 (0.15%) Subversion
11 1 (0.15%) TestRail
General
1 478 (71.99%) Inclusion and Diversity
2 273 (41.11%) Analytical Skills
3 53 (7.98%) Social Skills
4 43 (6.48%) Finance
5 24 (3.61%) Banking
6 8 (1.20%) Telecoms
7 5 (0.75%) Presentation Skills
8 4 (0.60%) Back Office
9 3 (0.45%) Documentation Skills
9 3 (0.45%) Manufacturing
9 3 (0.45%) Marketing
10 2 (0.30%) Advertising
10 2 (0.30%) Law
10 2 (0.30%) Public Sector
11 1 (0.15%) Electronics
11 1 (0.15%) Financial Institution
11 1 (0.15%) Games
11 1 (0.15%) Influencing Skills
11 1 (0.15%) Investment Banking
Job Titles
1 268 (40.36%) Infrastructure Engineer
2 236 (35.54%) Lead
3 215 (32.38%) Team Leader
4 44 (6.63%) DevOps Engineer
5 41 (6.17%) Senior
6 23 (3.46%) Platform Engineer
7 17 (2.56%) Software Engineer
8 16 (2.41%) Site Reliability Engineer
9 15 (2.26%) Analyst
10 14 (2.11%) AWS Engineer
10 14 (2.11%) Developer
11 13 (1.96%) Cloud Engineer
12 12 (1.81%) Azure Engineer
13 11 (1.66%) Administrator
13 11 (1.66%) Systems Administrator
14 10 (1.51%) Automation Engineer
14 10 (1.51%) Linux Engineer
15 9 (1.36%) Business Intelligence Analyst
15 9 (1.36%) Linux Administrator
15 9 (1.36%) Linux Systems Administrator
Libraries, Frameworks & Software Standards
1 490 (73.80%) Elastic Stack
2 215 (32.38%) OpenTelemetry
3 12 (1.81%) .NET
3 12 (1.81%) REST
4 10 (1.51%) Pandas
5 9 (1.36%) ARM Templates
6 6 (0.90%) React
6 6 (0.90%) YAML
7 5 (0.75%) AWS CDK
7 5 (0.75%) LDAP
8 4 (0.60%) .NET Framework
8 4 (0.60%) Blazor
8 4 (0.60%) COM
8 4 (0.60%) Entity Framework
8 4 (0.60%) FIX Protocol
8 4 (0.60%) HTML
8 4 (0.60%) Jinja
8 4 (0.60%) SOAP
9 3 (0.45%) Kafka
9 3 (0.45%) Node.js
Miscellaneous
1 262 (39.46%) Cyberattack
2 16 (2.41%) Cloud Native
3 11 (1.66%) Hybrid Cloud
4 7 (1.05%) Data Centre
4 7 (1.05%) Public Cloud
5 6 (0.90%) Algorithms
6 4 (0.60%) Linux Command Line
6 4 (0.60%) Onboarding
6 4 (0.60%) Security Posture
6 4 (0.60%) Wiki
7 3 (0.45%) Data Protection Act
7 3 (0.45%) Distributed Systems
7 3 (0.45%) Enterprise Cloud
7 3 (0.45%) Management Information System
7 3 (0.45%) Product Ownership
7 3 (0.45%) Self-Motivation
7 3 (0.45%) Virtual Team
8 2 (0.30%) Acoustics
8 2 (0.30%) GNSS
8 2 (0.30%) Self-Driving Car
Operating Systems
1 574 (86.45%) Linux
2 299 (45.03%) Windows
3 262 (39.46%) Android
4 241 (36.30%) Unix
5 15 (2.26%) Red Hat Enterprise Linux
6 12 (1.81%) Windows Server
7 8 (1.20%) CentOS
8 6 (0.90%) Mac OS
9 4 (0.60%) Ubuntu
9 4 (0.60%) Windows 10
10 3 (0.45%) Solaris
11 2 (0.30%) Debian
11 2 (0.30%) Rocky
11 2 (0.30%) VMS
11 2 (0.30%) Windows Server 2016
12 1 (0.15%) Check Point GAiA
12 1 (0.15%) Kali Linux
Processes & Methodologies
1 574 (86.45%) DevOps
2 492 (74.10%) Task Automation
3 302 (45.48%) Problem-Solving
4 295 (44.43%) Platform Engineering
5 275 (41.42%) Infrastructure as Code
6 272 (40.96%) Infrastructure Engineering
7 268 (40.36%) Mathematics
8 263 (39.61%) Storage Management
9 262 (39.46%) Line Management
9 262 (39.46%) Risk Management
10 255 (38.40%) Containerisation
11 244 (36.75%) Agile
12 242 (36.45%) Mentoring
13 232 (34.94%) High Availability
14 222 (33.43%) Resource Management
15 221 (33.28%) Performance Optimisation
16 220 (33.13%) Continuous Integration
17 219 (32.98%) Roadmaps
18 215 (32.38%) Cost Optimisation
18 215 (32.38%) GitOps
Programming Languages
1 637 (95.93%) Python
2 360 (54.22%) PowerShell
3 235 (35.39%) Java
4 228 (34.34%) Go
5 226 (34.04%) JavaScript
6 33 (4.97%) SQL
7 18 (2.71%) Perl
8 17 (2.56%) C++
9 14 (2.11%) Bicep
9 14 (2.11%) TypeScript
10 12 (1.81%) C
11 11 (1.66%) Data Analysis Expressions
12 8 (1.20%) Fortran
13 6 (0.90%) C#
13 6 (0.90%) R
14 5 (0.75%) Ruby
15 3 (0.45%) Shell Script
16 1 (0.15%) Kusto Query Language
16 1 (0.15%) PHP
Qualifications
1 231 (34.79%) AWS Certification
2 28 (4.22%) Degree
3 24 (3.61%) Security Cleared
4 17 (2.56%) SC Cleared
5 14 (2.11%) Azure Certification
6 13 (1.96%) Microsoft Certification
7 11 (1.66%) DV Cleared
8 8 (1.20%) Master's Degree
8 8 (1.20%) PhD
9 7 (1.05%) RHCE
10 6 (0.90%) Computer Science Degree
11 4 (0.60%) Linux+ Certification
11 4 (0.60%) MCSE
11 4 (0.60%) RHCSA
12 3 (0.45%) LPIC
13 2 (0.30%) AWS Certified DevOps Engineer
13 2 (0.30%) OSCP
14 1 (0.15%) AWS Certified Cloud Practitioner
14 1 (0.15%) CISSP
14 1 (0.15%) MCSA
Quality Assurance & Compliance
1 25 (3.77%) GDPR
2 9 (1.36%) QA
2 9 (1.36%) Sarbanes-Oxley
3 6 (0.90%) HIPAA
3 6 (0.90%) ISO/IEC 27001
4 4 (0.60%) NIST
5 2 (0.30%) PMO
5 2 (0.30%) SOC 2
6 1 (0.15%) GRC
6 1 (0.15%) SLA
System Software
1 529 (79.67%) Docker
2 267 (40.21%) Hyper-V
3 264 (39.76%) vSphere
4 262 (39.46%) VMware NSX
5 19 (2.86%) Active Directory
6 14 (2.11%) VMware Infrastructure
7 5 (0.75%) Virtual Machines
8 4 (0.60%) Dovecot
8 4 (0.60%) Postfix
9 3 (0.45%) GPFS
9 3 (0.45%) Lustre
9 3 (0.45%) NFS
9 3 (0.45%) VMware ESXi
10 2 (0.30%) Firmware
10 2 (0.30%) KVM
11 1 (0.15%) Corosync
11 1 (0.15%) Kamailio
11 1 (0.15%) Virtual Servers
11 1 (0.15%) Xen
Systems Management
1 537 (80.87%) Terraform
2 531 (79.97%) Ansible
3 269 (40.51%) Kubernetes
4 244 (36.75%) Prometheus
5 216 (32.53%) Argo
5 216 (32.53%) Kustomize
6 23 (3.46%) Grafana
7 12 (1.81%) Puppet
8 10 (1.51%) Red Hat Satellite
9 9 (1.36%) Nagios
10 8 (1.20%) Progress Chef
11 6 (0.90%) SCCM
12 5 (0.75%) Kibana
12 5 (0.75%) SCOM
13 4 (0.60%) Microsoft Intune
14 3 (0.45%) Active Directory Federation Services
14 3 (0.45%) SCOrch
15 2 (0.30%) FortiGate
15 2 (0.30%) logstash
15 2 (0.30%) Packer
Vendors
1 269 (40.51%) Splunk
2 263 (39.61%) Juniper
3 262 (39.46%) 3PAR
3 262 (39.46%) Cisco
4 218 (32.83%) Google
5 38 (5.72%) Microsoft
6 32 (4.82%) Red Hat
7 24 (3.61%) VMware
8 6 (0.90%) SolarWinds
9 5 (0.75%) Okta
9 5 (0.75%) ServiceNow
10 4 (0.60%) Atlassian
10 4 (0.60%) F5
10 4 (0.60%) Ping Identity
11 3 (0.45%) Commvault
11 3 (0.45%) Oracle
12 2 (0.30%) ArcSight
12 2 (0.30%) Dynatrace
12 2 (0.30%) ESRI
12 2 (0.30%) SAP