GDPR Jobs with Work from Home Options

General Data Protection Regulation EU 2016/679 (GDPR)
UK > Work from Home

The table below provides summary statistics for permanent remote or hybrid work requiring GDPR skills. It includes a benchmarking guide to the annual salaries offered in vacancies that cited GDPR over the 6 months leading up to 26 July 2024, comparing them to the same period in the previous two years.

6 months to
26 Jul 2024
Same period 2023 Same period 2022
Rank 281 276 299
Rank change year-on-year -5 +23 -60
Permanent jobs citing GDPR 294 372 977
As % of all permanent jobs with a WFH option 1.05% 1.13% 1.24%
As % of the Quality Assurance & Compliance category 8.07% 7.94% 7.74%
Number of salaries quoted 221 263 577
10th Percentile £31,500 £39,705 £31,250
25th Percentile £37,500 £46,250 £41,750
Median annual salary (50th Percentile) £52,500 £60,249 £57,500
Median % change year-on-year -12.86% +4.78% +5.02%
75th Percentile £77,500 £82,500 £75,000
90th Percentile £90,000 £95,000 £90,000
UK median annual salary £50,000 £55,000 £55,000
% change year-on-year -9.09% - -

All Quality Assurance and Compliance Skills
Work from Home

GDPR falls under the Quality Assurance and Compliance category. For comparison with the information above, the following table provides summary statistics for all permanent job vacancies with remote or hybrid options requiring quality assurance or compliance skills.

Permanent vacancies with a requirement for quality assurance or compliance skills 3,644 4,686 12,625
As % of all permanent jobs with a WFH option 13.04% 14.28% 16.08%
Number of salaries quoted 2,573 3,463 6,469
10th Percentile £35,050 £37,500 £32,500
25th Percentile £45,000 £45,750 £42,500
Median annual salary (50th Percentile) £58,457 £60,000 £57,500
Median % change year-on-year -2.57% +4.35% +9.52%
75th Percentile £77,500 £77,500 £73,000
90th Percentile £97,500 £92,500 £90,000
UK median annual salary £53,500 £57,500 £55,000
% change year-on-year -6.96% +4.55% +2.33%

GDPR
Trend for Jobs with a WFH Option

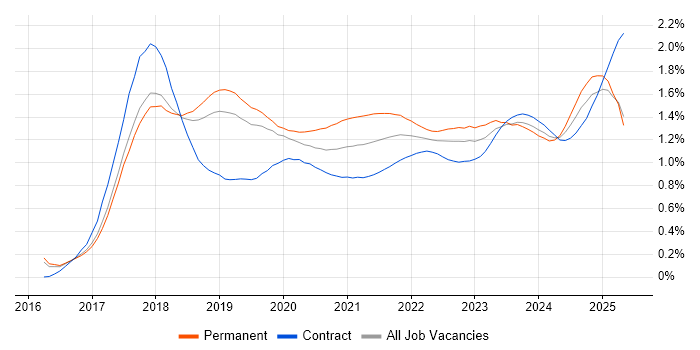
Job vacancies with a work from home option citing GDPR as a proportion of all IT jobs advertised.

GDPR trend for jobs with a WFH option

GDPR
Salary Trend for Jobs with a WFH Option

3-month moving average salary quoted in job vacancies with a work from home option citing GDPR.

GDPR salary trend for jobs with a WFH option

GDPR
Salary Histogram for Jobs with a WFH Option

Salary distribution for jobs with a work from home option citing GDPR over the 6 months to 26 July 2024.

GDPR salary histogram for jobs with a WFH option

GDPR
Co-occurring Skills and Capabilities with WFH Options by Category

The follow tables expand on the table above by listing co-occurrences grouped by category. The same employment type, locality and period is covered with up to 20 co-occurrences shown in each of the following categories:

Application Platforms
1 26 (8.84%) SharePoint
2 13 (4.42%) Microsoft Exchange
3 6 (2.04%) Confluence
4 5 (1.70%) WordPress
5 4 (1.36%) CMS
6 2 (0.68%) Apache Airflow
6 2 (0.68%) Apache Spark
6 2 (0.68%) BizTalk Server
7 1 (0.34%) ArcGIS
7 1 (0.34%) IIS
7 1 (0.34%) SAS
Applications
1 19 (6.46%) Microsoft Office
2 16 (5.44%) Microsoft Excel
3 4 (1.36%) Microsoft PowerPoint
4 2 (0.68%) Adobe After Effects
4 2 (0.68%) Adobe Illustrator
4 2 (0.68%) Photoshop
5 1 (0.34%) Microsoft Project
5 1 (0.34%) MS Visio
Business Applications
1 11 (3.74%) Dynamics CRM
2 3 (1.02%) SAP S/4HANA
3 2 (0.68%) BambooHR
3 2 (0.68%) iTrent
3 2 (0.68%) Raiser’s Edge
3 2 (0.68%) Salesforce CRM
4 1 (0.34%) Carpe Diem
4 1 (0.34%) Elite 3E
4 1 (0.34%) Exchequer
4 1 (0.34%) Primavera
4 1 (0.34%) Remedy ITSM
4 1 (0.34%) SAP ERP
Cloud Services
1 84 (28.57%) Azure
2 50 (17.01%) Power Platform
3 49 (16.67%) Microsoft 365
4 24 (8.16%) AWS
5 15 (5.10%) Azure Data Factory
6 14 (4.76%) SaaS
7 12 (4.08%) Dynamics 365
7 12 (4.08%) OneDrive
8 10 (3.40%) Azure DevOps
8 10 (3.40%) Serverless
8 10 (3.40%) WhatsApp
9 9 (3.06%) Azure Synapse Analytics
9 9 (3.06%) Entra ID
10 8 (2.72%) OCI
11 6 (2.04%) Snowflake
12 5 (1.70%) Azure Cosmos DB
12 5 (1.70%) Azure Service Bus
12 5 (1.70%) Matillion
13 4 (1.36%) Azure Logic Apps
13 4 (1.36%) SonarCloud
Communications & Networking
1 13 (4.42%) Firewall
2 12 (4.08%) Intrusion Detection
3 7 (2.38%) Network Security
4 5 (1.70%) DNS
4 5 (1.70%) VoIP
4 5 (1.70%) VPN
4 5 (1.70%) Wi-Fi
5 4 (1.36%) Skype
5 4 (1.36%) Wireless
6 3 (1.02%) Internet
7 2 (0.68%) Cisco IOS
7 2 (0.68%) Cisco ISE
7 2 (0.68%) DKIM
7 2 (0.68%) DMARC
7 2 (0.68%) PBX
7 2 (0.68%) Remote Desktop
7 2 (0.68%) WAN
8 1 (0.34%) Cisco ASA
8 1 (0.34%) Cisco Firepower
8 1 (0.34%) SD-WAN
Database & Business Intelligence
1 28 (9.52%) Power BI
2 19 (6.46%) Data Lake
3 18 (6.12%) Data Warehouse
4 17 (5.78%) SQL Server
5 12 (4.08%) Relational Database
6 9 (3.06%) Metadata
7 6 (2.04%) NoSQL
7 6 (2.04%) Tableau
8 5 (1.70%) QlikView
8 5 (1.70%) SQL Server Integration Services
9 4 (1.36%) Elasticsearch
9 4 (1.36%) HDInsight
9 4 (1.36%) Looker
9 4 (1.36%) MySQL
10 3 (1.02%) Azure SQL Database
10 3 (1.02%) DTS
10 3 (1.02%) MS Access
10 3 (1.02%) RDBMS
10 3 (1.02%) SAP HANA
10 3 (1.02%) SQL Server Analysis Services
Development Applications
1 11 (3.74%) JIRA
2 9 (3.06%) Git
3 7 (2.38%) Jenkins
4 5 (1.70%) Team Foundation Server
4 5 (1.70%) Visual Studio
5 4 (1.36%) MSBuild
5 4 (1.36%) Octopus Deploy
6 2 (0.68%) Atlassian Bamboo
6 2 (0.68%) GitLab
6 2 (0.68%) MLflow
7 1 (0.34%) Bitbucket
7 1 (0.34%) TeamCity
General
1 91 (30.95%) Social Skills
2 50 (17.01%) Legal
3 44 (14.97%) Finance
4 43 (14.63%) Analytical Skills
5 34 (11.56%) Law
6 29 (9.86%) Marketing
7 20 (6.80%) Retail
8 15 (5.10%) Inclusion and Diversity
9 12 (4.08%) Organisational Skills
9 12 (4.08%) Telecoms
10 9 (3.06%) Manufacturing
11 7 (2.38%) Pharmaceutical
11 7 (2.38%) Presentation Skills
12 6 (2.04%) Games
13 5 (1.70%) Advertising
13 5 (1.70%) Documentation Skills
13 5 (1.70%) Influencing Skills
14 4 (1.36%) Publishing
15 3 (1.02%) Local Government
15 3 (1.02%) Social Housing
Job Titles
1 32 (10.88%) Analyst
2 28 (9.52%) Lead
3 27 (9.18%) Architect
4 21 (7.14%) Senior
5 20 (6.80%) Information Officer
6 19 (6.46%) Security Manager
7 17 (5.78%) Developer
8 16 (5.44%) Information Security Officer
8 16 (5.44%) IT Manager
8 16 (5.44%) Security Officer
9 15 (5.10%) Data Manager
10 13 (4.42%) Technical Architect
11 12 (4.08%) Information Manager
11 12 (4.08%) Information Security Manager
11 12 (4.08%) Security Analyst
12 11 (3.74%) Business Manager
13 10 (3.40%) Consultant
13 10 (3.40%) Information Analyst
13 10 (3.40%) Information Security Analyst
13 10 (3.40%) Security Consultant
Libraries, Frameworks & Software Standards
1 20 (6.80%) HTML
2 14 (4.76%) .NET
3 13 (4.42%) XML
4 12 (4.08%) CSS
5 7 (2.38%) JSON
5 7 (2.38%) Web Services
6 4 (1.36%) ARM Templates
6 4 (1.36%) ASP.NET
6 4 (1.36%) gRPC
6 4 (1.36%) Middleware
6 4 (1.36%) REST
6 4 (1.36%) Twitter Bootstrap
6 4 (1.36%) YAML
7 3 (1.02%) jQuery
7 3 (1.02%) Node.js
7 3 (1.02%) React
7 3 (1.02%) RESTful
8 2 (0.68%) Ajax
8 2 (0.68%) Oracle Fusion
9 1 (0.34%) SAP Fiori
Miscellaneous
1 38 (12.93%) Management Information System
2 16 (5.44%) Data Protection Act
3 15 (5.10%) Self-Motivation
4 13 (4.42%) Data Centre
5 12 (4.08%) Security Posture
6 11 (3.74%) Cyber Threat
6 11 (3.74%) Driving Licence
7 8 (2.72%) e-Learning
7 8 (2.72%) Product Ownership
8 7 (2.38%) Housing Association
9 6 (2.04%) Distributed Systems
9 6 (2.04%) Mobile App
10 4 (1.36%) Cyber Security Posture
10 4 (1.36%) Freedom of Information
10 4 (1.36%) IoT
10 4 (1.36%) Linux Command Line
10 4 (1.36%) NHS
10 4 (1.36%) Security Operations Centre
10 4 (1.36%) Virtual Team
11 3 (1.02%) Cloud Native
Operating Systems
1 21 (7.14%) Windows
2 10 (3.40%) Linux
3 8 (2.72%) Android
3 8 (2.72%) Apple iOS
3 8 (2.72%) Windows Server
4 4 (1.36%) Red Hat Enterprise Linux
4 4 (1.36%) Windows 10
5 3 (1.02%) Mac OS X
6 1 (0.34%) Windows Server 2008
6 1 (0.34%) Windows Server 2012
6 1 (0.34%) Windows Server 2016
6 1 (0.34%) Windows Server 2019
Processes & Methodologies
1 112 (38.10%) Information Security
2 83 (28.23%) Data Protection
3 62 (21.09%) Cybersecurity
3 62 (21.09%) Problem-Solving
4 56 (19.05%) Continuous Improvement
5 47 (15.99%) Agile
6 43 (14.63%) Project Management
7 39 (13.27%) DevOps
8 38 (12.93%) ITIL
9 35 (11.90%) CRM
10 34 (11.56%) Stakeholder Management
11 33 (11.22%) Analytics
12 32 (10.88%) Business Continuity
12 32 (10.88%) Risk Management
13 30 (10.20%) Data Management
13 30 (10.20%) Disaster Recovery
13 30 (10.20%) Roadmaps
14 24 (8.16%) Customer Service
15 23 (7.82%) Data Security
16 22 (7.48%) Data Governance
Programming Languages
1 43 (14.63%) SQL
2 16 (5.44%) Python
3 15 (5.10%) C#
3 15 (5.10%) JavaScript
4 14 (4.76%) PowerShell
5 10 (3.40%) T-SQL
6 8 (2.72%) Java
7 6 (2.04%) PHP
8 5 (1.70%) Bash
9 4 (1.36%) PL/SQL
10 1 (0.34%) ABAP
10 1 (0.34%) R
10 1 (0.34%) TypeScript
10 1 (0.34%) VBScript
Qualifications
1 56 (19.05%) Degree
2 51 (17.35%) CISM
3 46 (15.65%) CISSP
4 31 (10.54%) CISA
5 24 (8.16%) Security Cleared
6 19 (6.46%) CRISC
6 19 (6.46%) Microsoft Certification
7 15 (5.10%) SC Cleared
8 14 (4.76%) Azure Certification
9 12 (4.08%) DBS Check
10 10 (3.40%) PMI Certification
10 10 (3.40%) PMP
11 9 (3.06%) Computer Science Degree
11 9 (3.06%) GIAC
12 8 (2.72%) Master's Degree
13 7 (2.38%) CEH
13 7 (2.38%) ISO 27001 Lead Implementer
14 6 (2.04%) ISO 27001 Lead Auditor
15 5 (1.70%) GSEC
15 5 (1.70%) SSCP
Quality Assurance & Compliance
1 107 (36.39%) ISO/IEC 27001
2 50 (17.01%) Cyber Essentials
3 37 (12.59%) PCI DSS
4 35 (11.90%) GRC
5 29 (9.86%) NIST
6 18 (6.12%) California Consumer Privacy Act
6 18 (6.12%) HIPAA
7 11 (3.74%) Data Quality
7 11 (3.74%) QA
8 10 (3.40%) Sarbanes-Oxley
8 10 (3.40%) SOC 2
9 9 (3.06%) COBIT
10 7 (2.38%) SLA
11 5 (1.70%) ISO 9001
11 5 (1.70%) NCSC
12 4 (1.36%) Cyber Essentials PLUS
12 4 (1.36%) ISO/IEC 27002 (supersedes ISO/IEC 17799)
12 4 (1.36%) NIST 800
13 2 (0.68%) GxP
14 1 (0.34%) PMO
System Software
1 21 (7.14%) Active Directory
2 10 (3.40%) Docker
3 7 (2.38%) VMware Infrastructure
4 4 (1.36%) Virtual Machines
5 2 (0.68%) Terminal Services
6 1 (0.34%) Embedded Firmware
6 1 (0.34%) Firmware
6 1 (0.34%) Hyper-V
6 1 (0.34%) VMware NSX
Systems Management
1 15 (5.10%) Microsoft Intune
2 10 (3.40%) Terraform
3 6 (2.04%) Kubernetes
3 6 (2.04%) SCCM
4 4 (1.36%) Ansible
4 4 (1.36%) Autotask
4 4 (1.36%) Progress Chef
4 4 (1.36%) Puppet
5 2 (0.68%) Active Directory Federation Services
5 2 (0.68%) Computer Emergency Response Teams
5 2 (0.68%) Nessus
6 1 (0.34%) DatAdvantage
6 1 (0.34%) QRadar
6 1 (0.34%) RSA Archer
6 1 (0.34%) Single Sign-On
6 1 (0.34%) Stealthwatch
6 1 (0.34%) Symantec Endpoint Protection
6 1 (0.34%) vCenter Server
6 1 (0.34%) WSUS
Vendors
1 72 (24.49%) Microsoft
2 18 (6.12%) Databricks
3 11 (3.74%) Oracle
4 8 (2.72%) Cisco
5 7 (2.38%) Qualys
5 7 (2.38%) VMware
6 5 (1.70%) Palo Alto
6 5 (1.70%) SAP
7 4 (1.36%) ArcSight
7 4 (1.36%) Datto
7 4 (1.36%) IBM
7 4 (1.36%) LogRhythm
7 4 (1.36%) Sage
7 4 (1.36%) Splunk
8 3 (1.02%) Adobe
8 3 (1.02%) Google
8 3 (1.02%) Meraki
8 3 (1.02%) Salesforce
8 3 (1.02%) ServiceNow
8 3 (1.02%) Sophos