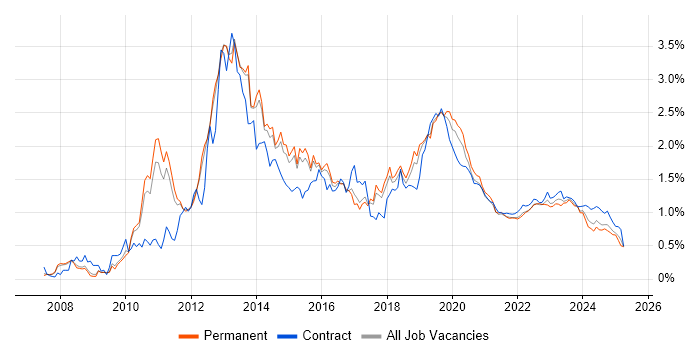
SCCM Jobs with Hybrid/Remote/WFH Options

Microsoft System Center Configuration Manager (SCCM)
UK > Work from Home

The table below provides summary statistics for permanent remote or hybrid work requiring SCCM skills. It includes a benchmarking guide to the annual salaries offered in vacancies that cited SCCM over the 6 months leading up to 5 May 2025, comparing them to the same period in the previous two years.

6 months to
5 May 2025
Same period 2024 Same period 2023
Rank 330 340 320
Rank change year-on-year +10 -20 +58
Permanent jobs citing SCCM 90 274 415
As % of all permanent jobs with a WFH option 0.58% 0.81% 0.98%
As % of the Systems Management category 5.03% 7.00% 6.13%
Number of salaries quoted 68 239 392
10th Percentile £33,935 £31,250 £24,000
25th Percentile £39,821 £36,250 £31,250
Median annual salary (50th Percentile) £52,500 £50,000 £48,500
Median % change year-on-year +5.00% +3.09% -
75th Percentile £67,500 £59,000 £60,063
90th Percentile £84,875 £70,000 £73,750
UK median annual salary £50,000 £43,000 £42,500
% change year-on-year +16.28% +1.18% -

All Systems Management Skills
Work from Home

SCCM falls under the Systems Management category. For comparison with the information above, the following table provides summary statistics for all permanent job vacancies with remote or hybrid options requiring systems management skills.

Permanent vacancies with a requirement for systems management skills 1,791 3,917 6,767
As % of all permanent jobs with a WFH option 11.62% 11.59% 15.97%
Number of salaries quoted 1,332 2,973 4,789
10th Percentile £41,000 £37,101 £41,250
25th Percentile £51,831 £47,500 £52,500
Median annual salary (50th Percentile) £70,000 £65,000 £69,447
Median % change year-on-year +7.69% -6.40% -0.79%
75th Percentile £90,000 £83,750 £88,750
90th Percentile £115,000 £102,500 £105,000
UK median annual salary £67,813 £60,000 £67,500
% change year-on-year +13.02% -11.11% -3.57%

SCCM
Trend for Jobs with a WFH Option

Job vacancies with remote working options citing SCCM as a proportion of all IT jobs advertised.

SCCM trend for jobs with Hybrid/Remote/WFH options

SCCM
Salary Trend for Jobs with a WFH Option

3-month moving average salary quoted in job vacancies with remote working options citing SCCM.

SCCM salary trend for jobs with a WFH option

SCCM
Salary Histogram for Jobs with a WFH Option

Salary distribution for jobs with remote working options citing SCCM over the 6 months to 5 May 2025.

SCCM salary histogram for jobs with a WFH option

SCCM
Co-occurring Skills and Capabilities with WFH Options by Category

The follow tables expand on the table above by listing co-occurrences grouped by category. The same employment type, locality and period is covered with up to 20 co-occurrences shown in each of the following categories:

Application Platforms
1 21 (23.33%) Microsoft Exchange
2 12 (13.33%) SharePoint
3 4 (4.44%) IIS
4 2 (2.22%) Skype for Business
5 1 (1.11%) Blackberry Enterprise Server
5 1 (1.11%) Tomcat
Applications
1 17 (18.89%) Microsoft Office
Business Applications
1 4 (4.44%) Elite 3E
2 3 (3.33%) Remedy ITSM
3 1 (1.11%) Carpe Diem
3 1 (1.11%) Dynamics CRM
Cloud Services
1 53 (58.89%) Microsoft 365
2 42 (46.67%) Azure
3 18 (20.00%) Entra ID
4 16 (17.78%) AWS
5 7 (7.78%) Cloud Computing
5 7 (7.78%) Mimecast
6 6 (6.67%) OneDrive
6 6 (6.67%) SaaS
7 5 (5.56%) PaaS
8 3 (3.33%) IaaS
8 3 (3.33%) Power Automate
8 3 (3.33%) Power Platform
8 3 (3.33%) PowerApps
9 2 (2.22%) Azure Logic Apps
9 2 (2.22%) Azure Monitor
10 1 (1.11%) Azure DevOps
10 1 (1.11%) Dynamics 365
10 1 (1.11%) WhatsApp
Communications & Networking
1 12 (13.33%) Firewall
2 10 (11.11%) DHCP
2 10 (11.11%) DNS
3 7 (7.78%) Wi-Fi
4 6 (6.67%) TCP/IP
5 3 (3.33%) LAN
5 3 (3.33%) VoIP
5 3 (3.33%) WAN
6 2 (2.22%) NetScaler
6 2 (2.22%) Remote Desktop
6 2 (2.22%) SAN
6 2 (2.22%) Skype
6 2 (2.22%) VSAN
7 1 (1.11%) Network Security
7 1 (1.11%) VLAN
7 1 (1.11%) VPN
7 1 (1.11%) Wireless
Database & Business Intelligence
1 14 (15.56%) SQL Server
2 2 (2.22%) Power BI
2 2 (2.22%) SQL Server Reporting Services
Development Applications
1 1 (1.11%) MSI
General
1 36 (40.00%) Finance
2 15 (16.67%) Law
3 13 (14.44%) Social Skills
4 12 (13.33%) Analytical Skills
5 6 (6.67%) Legal
6 4 (4.44%) Games
7 3 (3.33%) Organisational Skills
8 2 (2.22%) Public Sector
9 1 (1.11%) Banking
9 1 (1.11%) Documentation Skills
9 1 (1.11%) Inclusion and Diversity
9 1 (1.11%) Presentation Skills
Job Titles
1 15 (16.67%) Analyst
1 15 (16.67%) Support Engineer
2 14 (15.56%) Senior
3 13 (14.44%) Infrastructure Engineer
4 8 (8.89%) Azure Engineer
4 8 (8.89%) Lead
4 8 (8.89%) Support Analyst
5 7 (7.78%) Service Analyst
5 7 (7.78%) Systems Engineer
5 7 (7.78%) Windows Engineer
6 6 (6.67%) Administrator
6 6 (6.67%) AWS Administrator
6 6 (6.67%) Citrix Administrator
6 6 (6.67%) Citrix Support
6 6 (6.67%) Desktop Engineer
6 6 (6.67%) Server Administrator
6 6 (6.67%) Server Support
6 6 (6.67%) VMWare Administrator
6 6 (6.67%) Windows Administrator
6 6 (6.67%) Windows Systems Administrator
Libraries, Frameworks & Software Standards
1 3 (3.33%) ARM Templates
2 1 (1.11%) .NET
2 1 (1.11%) .NET Framework
2 1 (1.11%) SAML
2 1 (1.11%) Software Packaging
Miscellaneous
1 12 (13.33%) Management Information System
2 10 (11.11%) Data Centre
3 4 (4.44%) CMDB
3 4 (4.44%) Mobile Games
4 3 (3.33%) Client/Server
4 3 (3.33%) Enterprise Cloud
4 3 (3.33%) iPad
4 3 (3.33%) iPhone
4 3 (3.33%) Self-Motivation
5 2 (2.22%) Driving Licence
5 2 (2.22%) Hybrid Cloud
5 2 (2.22%) Onboarding
6 1 (1.11%) Cyber Threat
6 1 (1.11%) Data Protection Act
6 1 (1.11%) Enterprise Software
6 1 (1.11%) Low-Code
6 1 (1.11%) Video Conferencing
Operating Systems
1 64 (71.11%) Windows
2 31 (34.44%) Windows 10
3 24 (26.67%) Windows Server
4 22 (24.44%) Linux
5 8 (8.89%) AIX
6 7 (7.78%) Apple iOS
7 5 (5.56%) Windows Server 2019
8 4 (4.44%) Red Hat Enterprise Linux
9 3 (3.33%) Unix
9 3 (3.33%) Windows 7
9 3 (3.33%) Windows 8
9 3 (3.33%) Windows Server 2012
9 3 (3.33%) Windows Server 2016
10 2 (2.22%) SUSE
10 2 (2.22%) Windows Server 2003
11 1 (1.11%) Android
Processes & Methodologies
1 33 (36.67%) ITIL
2 18 (20.00%) Infrastructure Engineering
3 14 (15.56%) Asset Management
3 14 (15.56%) Customer Service
3 14 (15.56%) Disaster Recovery
3 14 (15.56%) Incident Management
3 14 (15.56%) Problem Management
3 14 (15.56%) Problem-Solving
4 12 (13.33%) Mobile Device Management
4 12 (13.33%) User Experience
5 11 (12.22%) Project Delivery
6 10 (11.11%) Change Management
7 8 (8.89%) Document Management
7 8 (8.89%) ITSM
7 8 (8.89%) Service Delivery
7 8 (8.89%) Virtual Infrastructure
8 7 (7.78%) Cybersecurity
8 7 (7.78%) Mentoring
9 6 (6.67%) Continuous Improvement
9 6 (6.67%) Data Protection
Programming Languages
1 33 (36.67%) PowerShell
2 12 (13.33%) Python
3 7 (7.78%) Bash
4 6 (6.67%) SQL
5 3 (3.33%) Bicep
5 3 (3.33%) VB
6 1 (1.11%) Java
Qualifications
1 16 (17.78%) Degree
2 11 (12.22%) Microsoft Certification
3 8 (8.89%) AWS Certification
3 8 (8.89%) DV Cleared
3 8 (8.89%) Security Cleared
4 7 (7.78%) A+ Certification
4 7 (7.78%) Cisco Certification
5 6 (6.67%) IBM AIX Certification
5 6 (6.67%) ITIL Certification
6 4 (4.44%) MCSE
7 3 (3.33%) Azure Certification
7 3 (3.33%) MCP
8 1 (1.11%) CCNA
8 1 (1.11%) Computer Science Degree
8 1 (1.11%) MCSA
Quality Assurance & Compliance
1 17 (18.89%) SLA
2 4 (4.44%) GDPR
System Software
1 63 (70.00%) Active Directory
2 20 (22.22%) VMware Infrastructure
3 7 (7.78%) Hyper-V
4 6 (6.67%) BitLocker
4 6 (6.67%) Firmware
5 3 (3.33%) Virtual Desktop
5 3 (3.33%) Virtual Machines
6 2 (2.22%) VMware ESXi
6 2 (2.22%) vSphere
7 1 (1.11%) Microsoft App-V
7 1 (1.11%) Virtual Servers
7 1 (1.11%) XenApp
Systems Management
1 22 (24.44%) Microsoft Intune
2 12 (13.33%) SCOM
3 7 (7.78%) Ansible
4 6 (6.67%) SCOrch
5 5 (5.56%) Single Sign-On
5 5 (5.56%) vCenter Server
6 4 (4.44%) Jamf Pro
6 4 (4.44%) Terraform
7 3 (3.33%) WMI
8 2 (2.22%) Kubernetes
8 2 (2.22%) Microsoft Data Protection Manager
8 2 (2.22%) SCSM
8 2 (2.22%) WSUS
9 1 (1.11%) Norton AntiVirus
Vendors
1 73 (81.11%) Microsoft
2 27 (30.00%) Citrix
3 26 (28.89%) VMware
4 16 (17.78%) ServiceNow
5 10 (11.11%) iManage
6 9 (10.00%) Cisco
7 7 (7.78%) MobileIron
8 6 (6.67%) Apple
8 6 (6.67%) HP
8 6 (6.67%) Remedy
9 5 (5.56%) Sophos
10 4 (4.44%) Intapp
11 3 (3.33%) McAfee
11 3 (3.33%) Riverbed
12 2 (2.22%) Ab Initio
12 2 (2.22%) arcserve
12 2 (2.22%) Aruba
12 2 (2.22%) Avaya
12 2 (2.22%) Oracle
12 2 (2.22%) Red Hat