SIEM Jobs with Hybrid/Remote/WFH Options

Security Information and Event Management (SIEM)
UK > Work from Home

The table below provides summary statistics for permanent remote or hybrid work requiring SIEM skills. It includes a benchmarking guide to the annual salaries offered in vacancies that cited SIEM over the 6 months leading up to 7 May 2025, comparing them to the same period in the previous two years.

6 months to
7 May 2025
Same period 2024 Same period 2023
Rank 294 304 310
Rank change year-on-year +10 +6 +40
Permanent jobs citing SIEM 140 331 423
As % of all permanent jobs with a WFH option 0.85% 0.98% 1.00%
As % of the Processes & Methodologies category 0.91% 1.07% 1.04%
Number of salaries quoted 114 297 326
10th Percentile £40,950 £42,250 £42,500
25th Percentile £47,298 £50,000 £51,250
Median annual salary (50th Percentile) £60,000 £60,000 £65,000
Median % change year-on-year - -7.69% -6.61%
75th Percentile £72,500 £70,000 £77,500
90th Percentile £85,875 £82,500 £87,500
UK median annual salary £62,500 £62,783 £65,000
% change year-on-year -0.45% -3.41% -

All Process and Methodology Skills
Work from Home

SIEM falls under the Processes and Methodologies category. For comparison with the information above, the following table provides summary statistics for all permanent job vacancies with remote or hybrid options requiring process or methodology skills.

Permanent vacancies with a requirement for process or methodology skills 15,361 31,014 40,730
As % of all permanent jobs with a WFH option 93.62% 91.60% 96.11%
Number of salaries quoted 9,801 23,557 28,305
10th Percentile £29,913 £33,750 £37,500
25th Percentile £45,000 £42,500 £47,500
Median annual salary (50th Percentile) £60,000 £57,500 £62,500
Median % change year-on-year +4.35% -8.00% +4.17%
75th Percentile £77,500 £75,000 £82,500
90th Percentile £102,500 £95,000 £100,000
UK median annual salary £57,500 £55,000 £61,500
% change year-on-year +4.55% -10.57% +2.50%

SIEM
Trend for Jobs with a WFH Option

Job vacancies with remote working options citing SIEM as a proportion of all IT jobs advertised.
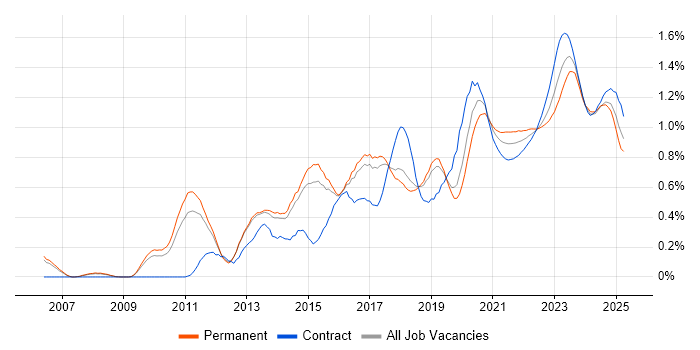
SIEM trend for jobs with Hybrid/Remote/WFH options

SIEM
Salary Trend for Jobs with a WFH Option

3-month moving average salary quoted in job vacancies with remote working options citing SIEM.

SIEM salary trend for jobs with a WFH option

SIEM
Salary Histogram for Jobs with a WFH Option

Salary distribution for jobs with remote working options citing SIEM over the 6 months to 7 May 2025.

SIEM salary histogram for jobs with a WFH option

SIEM
Co-occurring Skills and Capabilities with WFH Options by Category

The follow tables expand on the table above by listing co-occurrences grouped by category. The same employment type, locality and period is covered with up to 20 co-occurrences shown in each of the following categories:

Application Platforms
1 5 (3.57%) SharePoint
2 4 (2.86%) Microsoft Exchange
Cloud Services
1 59 (42.14%) Azure
2 31 (22.14%) AWS
3 29 (20.71%) Azure Sentinel
4 25 (17.86%) Microsoft 365
5 11 (7.86%) Entra ID
6 8 (5.71%) SaaS
7 6 (4.29%) PaaS
8 5 (3.57%) GCP
8 5 (3.57%) Serverless
9 4 (2.86%) Amazon GuardDuty
9 4 (2.86%) AWS Lambda
9 4 (2.86%) IaaS
10 3 (2.14%) Amazon CloudWatch
10 3 (2.14%) Cloud Computing
10 3 (2.14%) IBM Cloud
11 2 (1.43%) Amazon EC2
11 2 (1.43%) Amazon S3
11 2 (1.43%) AWS CloudFormation
11 2 (1.43%) AWS CloudTrail
11 2 (1.43%) AWS Control Tower
Communications & Networking
1 75 (53.57%) Firewall
2 23 (16.43%) Intrusion Detection
3 22 (15.71%) Network Security
4 15 (10.71%) VPN
5 10 (7.14%) SAN
5 10 (7.14%) TCP/IP
6 9 (6.43%) DHCP
6 9 (6.43%) DNS
7 7 (5.00%) WAN
8 5 (3.57%) SD-WAN
9 4 (2.86%) Cisco ASA
9 4 (2.86%) Cisco Firepower
9 4 (2.86%) Cisco Nexus
9 4 (2.86%) VSAN
9 4 (2.86%) Wi-Fi
10 3 (2.14%) NGFW
11 2 (1.43%) LAN
12 1 (0.71%) Internet
12 1 (0.71%) IPv4
12 1 (0.71%) IPv6
Development Applications
1 2 (1.43%) JIRA
2 1 (0.71%) Artifactory
2 1 (0.71%) Jenkins
General
1 38 (27.14%) Social Skills
2 32 (22.86%) Finance
3 27 (19.29%) Analytical Skills
4 16 (11.43%) Law
5 12 (8.57%) Retail
6 10 (7.14%) Legal
7 7 (5.00%) Manufacturing
8 6 (4.29%) Telecoms
9 5 (3.57%) Inclusion and Diversity
10 4 (2.86%) Banking
11 3 (2.14%) Electronics
11 3 (2.14%) Marketing
11 3 (2.14%) Public Sector
12 2 (1.43%) Documentation Skills
13 1 (0.71%) Aerospace
13 1 (0.71%) Investment Banking
Job Titles
1 55 (39.29%) Analyst
2 42 (30.00%) Security Analyst
3 30 (21.43%) Security Engineer
4 20 (14.29%) Cybersecurity Analyst
5 19 (13.57%) Senior
6 13 (9.29%) SOC Analyst
7 12 (8.57%) Operations Analyst
7 12 (8.57%) Security Operations Analyst
8 11 (7.86%) Infrastructure Engineer
9 10 (7.14%) Incident Analyst
10 9 (6.43%) Architect
10 9 (6.43%) CISSP Analyst
10 9 (6.43%) Cybersecurity Engineer
10 9 (6.43%) Junior
10 9 (6.43%) Junior Analyst
10 9 (6.43%) Junior Operations Analyst
10 9 (6.43%) Junior Security Analyst
10 9 (6.43%) Security Incident Analyst
10 9 (6.43%) Security Manager
10 9 (6.43%) SIEM Analyst
Libraries, Frameworks & Software Standards
1 4 (2.86%) Elastic Stack
2 2 (1.43%) AWS CDK
2 2 (1.43%) AWS SAM
3 1 (0.71%) boto
3 1 (0.71%) SailPoint
3 1 (0.71%) SAML
3 1 (0.71%) YAML
Miscellaneous
1 35 (25.00%) Management Information System
2 23 (16.43%) Cyber Threat
3 19 (13.57%) Security Posture
4 13 (9.29%) Security Operations Centre
5 10 (7.14%) Onboarding
6 9 (6.43%) CSOC
6 9 (6.43%) Hedge funds
6 9 (6.43%) Podcast
6 9 (6.43%) Virtual Team
7 5 (3.57%) Data Protection Act
7 5 (3.57%) Distributed Denial-of-Service
7 5 (3.57%) PKI
8 4 (2.86%) Cloud Native
8 4 (2.86%) Cyberattack
8 4 (2.86%) Housing Association
8 4 (2.86%) Public Cloud
8 4 (2.86%) Video Conferencing
9 3 (2.14%) Cyber Security Posture
9 3 (2.14%) Hybrid Cloud
9 3 (2.14%) Self-Motivation
Operating Systems
1 46 (32.86%) Windows
2 24 (17.14%) Linux
3 9 (6.43%) Windows Server
4 4 (2.86%) Windows Server 2016
5 2 (1.43%) Red Hat Enterprise Linux
5 2 (1.43%) Unix
6 1 (0.71%) Windows Server 2008
6 1 (0.71%) Windows Server 2012
Processes & Methodologies
1 104 (74.29%) Cybersecurity
2 64 (45.71%) Incident Response
3 62 (44.29%) Information Security
4 59 (42.14%) Security Operations
5 31 (22.14%) Problem-Solving
6 29 (20.71%) Risk Management
7 28 (20.00%) Cloud Security
8 26 (18.57%) Vulnerability Management
9 25 (17.86%) DevOps
10 22 (15.71%) Data Loss Prevention
10 22 (15.71%) ITIL
10 22 (15.71%) Threat Intelligence
11 21 (15.00%) Cyber Threat Intelligence
12 20 (14.29%) Incident Management
13 18 (12.86%) Identity Access Management
13 18 (12.86%) Penetration Testing
13 18 (12.86%) Vulnerability Assessment
14 17 (12.14%) Infrastructure Engineering
15 15 (10.71%) Mentoring
16 14 (10.00%) Security Architecture
Programming Languages
1 23 (16.43%) PowerShell
2 21 (15.00%) Python
3 5 (3.57%) Bash
4 3 (2.14%) Perl
5 2 (1.43%) Go
5 2 (1.43%) JavaScript
5 2 (1.43%) Kusto Query Language
5 2 (1.43%) Shell Script
5 2 (1.43%) TypeScript
6 1 (0.71%) Bicep
6 1 (0.71%) Groovy
6 1 (0.71%) VBA
Qualifications
1 54 (38.57%) CISSP
2 34 (24.29%) Degree
3 33 (23.57%) CISM
4 26 (18.57%) CompTIA Security+
5 18 (12.86%) Security Cleared
6 17 (12.14%) Computer Science Degree
7 16 (11.43%) SANS
8 13 (9.29%) CEH
8 13 (9.29%) GCIA
8 13 (9.29%) SC Cleared
9 10 (7.14%) Cisco Certification
9 10 (7.14%) GCIH
9 10 (7.14%) OSCP
10 9 (6.43%) CCNP
11 6 (4.29%) AWS Certification
11 6 (4.29%) CISA
12 5 (3.57%) DV Cleared
13 4 (2.86%) CCSE
13 4 (2.86%) Microsoft Certification
13 4 (2.86%) SSCP
Quality Assurance & Compliance
1 50 (35.71%) ISO/IEC 27001
2 31 (22.14%) Cyber Essentials
3 28 (20.00%) NIST
4 18 (12.86%) GDPR
5 12 (8.57%) Cyber Essentials PLUS
6 8 (5.71%) NCSC
6 8 (5.71%) PCI DSS
7 7 (5.00%) COBIT
8 6 (4.29%) SOC 2
9 3 (2.14%) HIPAA
9 3 (2.14%) ISO/IEC 27002 (supersedes ISO/IEC 17799)
9 3 (2.14%) NIST 800
10 1 (0.71%) Actionable Recommendations
10 1 (0.71%) SLA
System Software
1 20 (14.29%) Active Directory
2 10 (7.14%) VMware Infrastructure
3 8 (5.71%) VMware ESXi
4 3 (2.14%) Docker
5 1 (0.71%) Hyper-V
Systems Management
1 12 (8.57%) Microsoft Intune
2 9 (6.43%) QRadar
3 6 (4.29%) Ansible
4 5 (3.57%) Kubernetes
4 5 (3.57%) Nessus
4 5 (3.57%) Terraform
5 4 (2.86%) Progress Chef
5 4 (2.86%) Puppet
5 4 (2.86%) ZENworks
6 2 (1.43%) Grafana
6 2 (1.43%) Host Intrusion Detection System
6 2 (1.43%) SCOM
6 2 (1.43%) Single Sign-On
7 1 (0.71%) Active Directory Federation Services
7 1 (0.71%) CASB
Vendors
1 54 (38.57%) Microsoft
2 24 (17.14%) VMware
3 14 (10.00%) Splunk
3 14 (10.00%) Tenable
4 13 (9.29%) CrowdStrike
5 5 (3.57%) Cisco
5 5 (3.57%) Meraki
5 5 (3.57%) Palo Alto
6 4 (2.86%) CheckPoint
6 4 (2.86%) Fortinet
7 3 (2.14%) IBM
7 3 (2.14%) SAP
8 2 (1.43%) ArcSight
8 2 (1.43%) Darktrace
8 2 (1.43%) Juniper
8 2 (1.43%) Red Hat
8 2 (1.43%) ServiceNow
9 1 (0.71%) FireEye
9 1 (0.71%) McAfee
9 1 (0.71%) Qualys