Hybrid/Remote Microsoft Exchange Job Trends

Microsoft Exchange Server
UK > Work from Home

The table below provides summary statistics and salary benchmarking for remote or hybrid work requiring Microsoft Exchange skills. It covers permanent job vacancies from the 6 months leading up to 18 November 2025, with comparisons to the same periods in the previous two years.

6 months to
18 Nov 2025
Same period 2024 Same period 2023
Rank 170 146 113
Rank change year-on-year -24 -33 +72
Permanent jobs citing Microsoft Exchange 222 407 626
As % of all permanent jobs with remote/hybrid work options 1.46% 2.08% 2.89%
As % of the Application Platforms category 18.42% 17.58% 25.14%
Number of salaries quoted 167 304 542
10th Percentile £28,750 £28,498 £27,775
25th Percentile £30,000 £31,438 £32,500
Median annual salary (50th Percentile) £40,000 £45,000 £45,000
Median % change year-on-year -11.11% - -
75th Percentile £60,000 £57,500 £57,500
90th Percentile £77,500 £73,845 £73,750
UK median annual salary £40,000 £42,500 £42,500
% change year-on-year -5.88% - +0.59%

All Application Platform Skills
Work from Home

Microsoft Exchange falls under the Application Platforms category. For comparison with the information above, the following table provides summary statistics for all permanent job vacancies with remote or hybrid options requiring application platform skills.

Permanent vacancies with a requirement for application platform skills 1,205 2,315 2,490
As % of all permanent jobs with a WFH option 7.94% 11.84% 11.49%
Number of salaries quoted 907 1,625 1,990
10th Percentile £30,000 £31,250 £32,500
25th Percentile £40,000 £45,383 £41,250
Median annual salary (50th Percentile) £60,000 £65,465 £57,500
Median % change year-on-year -8.35% +13.85% -
75th Percentile £87,500 £107,500 £77,715
90th Percentile £130,000 £142,500 £96,250
UK median annual salary £52,500 £57,250 £55,000
% change year-on-year -8.30% +4.09% -

Microsoft Exchange
Job Vacancy Trend for Remote/Hybrid Jobs

Historical trend showing the proportion of permanent IT job postings citing Microsoft Exchange and offering remote or hybrid work options relative to all permanent IT jobs advertised.
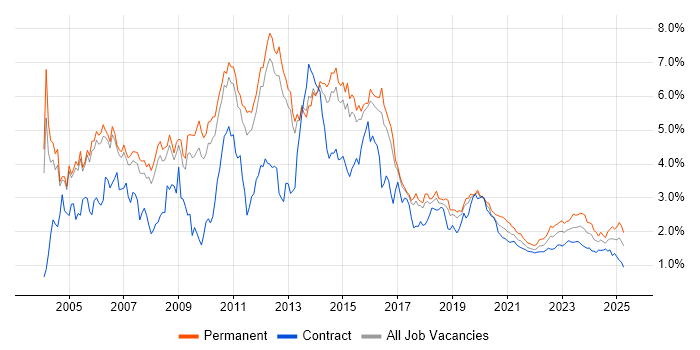
Microsoft Exchange job vacancy trend for remote/hybrid jobs

Microsoft Exchange
Salary Trend for Remote/Hybrid Jobs

Salary distribution trend for jobs with remote/hybrid work options citing Microsoft Exchange.

Salary distribution trend for jobs with remote/hybrid work options citing Microsoft Exchange

Microsoft Exchange
Salary Histogram for Remote/Hybrid Jobs

Salary distribution for jobs with remote/hybrid work options citing Microsoft Exchange over the 6 months to 18 November 2025.

Microsoft Exchange salary histogram for jobs with remote/hybrid work options

Microsoft Exchange
Co-Occurring Skills & Capabilities in Remote/Hybrid Jobs by Category

The following tables expand on the one above by listing co-occurrences grouped by category. They cover the same employment type, locality and period, with up to 20 co-occurrences shown in each category:

Application Platforms
1 121 (54.50%) SharePoint
2 11 (4.95%) IIS
3 3 (1.35%) Skype for Business
Applications
1 20 (9.01%) Microsoft Office
2 4 (1.80%) Microsoft Excel
3 3 (1.35%) MS Visio
3 3 (1.35%) Simulink
4 1 (0.45%) Microsoft PowerPoint
4 1 (0.45%) Microsoft Project
Business Applications
1 7 (3.15%) Dynamics CRM
2 1 (0.45%) Sage 200
Cloud Services
1 191 (86.04%) Microsoft 365
2 131 (59.01%) Azure
3 105 (47.30%) Entra ID
4 38 (17.12%) OneDrive
5 29 (13.06%) Power Platform
6 28 (12.61%) Microsoft Purview
7 18 (8.11%) PowerApps
8 17 (7.66%) Power Automate
9 16 (7.21%) SaaS
10 15 (6.76%) AWS
11 12 (5.41%) Dynamics 365
11 12 (5.41%) IaaS
11 12 (5.41%) Microsoft Copilot
12 9 (4.05%) Azure DevOps
12 9 (4.05%) Mimecast
13 7 (3.15%) GitHub
14 6 (2.70%) ShareGate
15 5 (2.25%) Google Workspace
16 4 (1.80%) Azure Sentinel
17 3 (1.35%) IBM Cloud
Communications & Networking
1 56 (25.23%) DNS
2 50 (22.52%) DHCP
3 48 (21.62%) Firewall
4 46 (20.72%) VPN
5 31 (13.96%) WAN
6 28 (12.61%) LAN
6 28 (12.61%) TCP/IP
7 22 (9.91%) VoIP
8 20 (9.01%) VLAN
9 10 (4.50%) Wi-Fi
10 6 (2.70%) SAN
10 6 (2.70%) SSL
11 5 (2.25%) Network Security
11 5 (2.25%) SD-WAN
12 4 (1.80%) Unified Communications
12 4 (1.80%) Wireless
13 3 (1.35%) HTTP
13 3 (1.35%) SMS
13 3 (1.35%) SMTP
13 3 (1.35%) WLAN
Database & Business Intelligence
1 17 (7.66%) SQL Server
2 12 (5.41%) Power BI
3 10 (4.50%) Data Hub
3 10 (4.50%) SQL CLR
4 3 (1.35%) Metadata
4 3 (1.35%) MySQL
4 3 (1.35%) SQL Server Analysis Services
4 3 (1.35%) SQL Server Reporting Services
5 1 (0.45%) Apache Cassandra
5 1 (0.45%) Data Warehouse
5 1 (0.45%) MongoDB
Development Applications
1 1 (0.45%) Fiddler
1 1 (0.45%) MSBuild
General
1 87 (39.19%) Social Skills
2 55 (24.77%) Finance
3 14 (6.31%) Analytical Skills
3 14 (6.31%) Manufacturing
4 13 (5.86%) Back Office
5 8 (3.60%) Presentation Skills
6 7 (3.15%) Advertising
6 7 (3.15%) Inclusion and Diversity
6 7 (3.15%) Marketing
7 6 (2.70%) Aerospace
7 6 (2.70%) Retail
8 5 (2.25%) Legal
8 5 (2.25%) Organisational Skills
8 5 (2.25%) Telecoms
9 4 (1.80%) German Language
10 3 (1.35%) Automotive
10 3 (1.35%) Games
11 2 (0.90%) Public Sector
12 1 (0.45%) Documentation Skills
12 1 (0.45%) Law
Job Titles
1 40 (18.02%) IT Support
2 36 (16.22%) Analyst
3 33 (14.86%) Support Engineer
4 23 (10.36%) Senior
5 22 (9.91%) IT Engineer
5 22 (9.91%) Support Analyst
6 20 (9.01%) 2nd Line Support
6 20 (9.01%) IT Support Engineer
7 19 (8.56%) Infrastructure Engineer
8 18 (8.11%) Support Technician
9 14 (6.31%) 2nd Line Engineer
9 14 (6.31%) 2nd Line Support Engineer
10 12 (5.41%) 1st Line Support
10 12 (5.41%) IT Analyst
10 12 (5.41%) Technical Support
11 11 (4.95%) Microsoft 365 Engineer
12 10 (4.50%) 3rd Line Support
12 10 (4.50%) Service Analyst
12 10 (4.50%) Service Desk Analyst
13 9 (4.05%) IT Support Analyst
Libraries, Frameworks & Software Standards
1 20 (9.01%) .NET
2 7 (3.15%) .NET Core
2 7 (3.15%) .NET Framework
2 7 (3.15%) Dapper ORM
2 7 (3.15%) Entity Framework
3 2 (0.90%) SAML
3 2 (0.90%) Software Packaging
4 1 (0.45%) ASP.NET
4 1 (0.45%) Microsoft Graph
4 1 (0.45%) OAuth
4 1 (0.45%) OpenID
Miscellaneous
1 30 (13.51%) Driving Licence
2 17 (7.66%) Onboarding
2 17 (7.66%) Product Ownership
3 12 (5.41%) Client/Server
3 12 (5.41%) Enterprise Software
4 10 (4.50%) Management Information System
4 10 (4.50%) Private Cloud
4 10 (4.50%) Security Posture
5 8 (3.60%) Hybrid Cloud
5 8 (3.60%) iPad
5 8 (3.60%) Self-Motivation
6 7 (3.15%) Team-Oriented Environment
7 5 (2.25%) PKI
8 4 (1.80%) Data Centre
8 4 (1.80%) Replication
9 3 (1.35%) Algorithms
9 3 (1.35%) Arduino
9 3 (1.35%) BYOD
9 3 (1.35%) Hedge funds
9 3 (1.35%) Raspberry Pi
Operating Systems
1 139 (62.61%) Windows
2 95 (42.79%) Windows Server
3 35 (15.77%) Windows 10
4 25 (11.26%) Mac OS
5 13 (5.86%) Linux
6 11 (4.95%) Windows Server 2016
7 10 (4.50%) Apple iOS
8 8 (3.60%) Windows Server 2019
9 4 (1.80%) Windows Server 2012
10 2 (0.90%) Windows Server 2008
11 1 (0.45%) Android
11 1 (0.45%) CentOS
11 1 (0.45%) Ubuntu
11 1 (0.45%) VMS
Processes & Methodologies
1 68 (30.63%) ITIL
2 59 (26.58%) Problem-Solving
3 47 (21.17%) Continuous Improvement
4 41 (18.47%) Infrastructure Engineering
5 32 (14.41%) Customer Service
6 31 (13.96%) Migration
7 29 (13.06%) Disaster Recovery
8 21 (9.46%) DevOps
8 21 (9.46%) Information Security
8 21 (9.46%) Infrastructure as Code
9 20 (9.01%) Asset Management
9 20 (9.01%) Coaching
9 20 (9.01%) Roadmaps
10 19 (8.56%) Cybersecurity
10 19 (8.56%) Data Loss Prevention
10 19 (8.56%) Mentoring
11 18 (8.11%) Agile
11 18 (8.11%) Performance Tuning
11 18 (8.11%) Service Delivery
12 17 (7.66%) Change Management
Programming Languages
1 35 (15.77%) PowerShell
2 29 (13.06%) SQL
3 14 (6.31%) Python
4 10 (4.50%) Bash
4 10 (4.50%) C#
5 5 (2.25%) JavaScript
6 3 (1.35%) Assembly Language
6 3 (1.35%) C
6 3 (1.35%) C++
6 3 (1.35%) Java
6 3 (1.35%) MATLAB
6 3 (1.35%) Objective-C
6 3 (1.35%) Swift
6 3 (1.35%) T-SQL
7 2 (0.90%) Bicep
7 2 (0.90%) PHP
Qualifications
1 35 (15.77%) Degree
2 22 (9.91%) Microsoft Certification
3 17 (7.66%) DBS Check
4 14 (6.31%) ITIL Certification
5 13 (5.86%) Cisco Certification
6 11 (4.95%) CCNA
7 9 (4.05%) SC Cleared
7 9 (4.05%) Security Cleared
8 8 (3.60%) Azure Certification
9 7 (3.15%) A+ Certification
10 6 (2.70%) MCP
10 6 (2.70%) MCSA
11 5 (2.25%) AWS Certification
12 4 (1.80%) BPSS Clearance
12 4 (1.80%) MCSE
12 4 (1.80%) VMware Certified Professional (VCP)
13 3 (1.35%) AWS Certified Solutions Architect
13 3 (1.35%) CCNP
13 3 (1.35%) ITIL Foundation Certificate
14 2 (0.90%) CompTIA Security+
Quality Assurance & Compliance
1 15 (6.76%) NIST
1 15 (6.76%) SLA
2 10 (4.50%) Cyber Essentials
2 10 (4.50%) ISO/IEC 27001
3 8 (3.60%) Cyber Essentials PLUS
4 7 (3.15%) GDPR
5 4 (1.80%) NCSC
6 2 (0.90%) Accessibility
6 2 (0.90%) GRC
7 1 (0.45%) HIPAA
7 1 (0.45%) ISO 22301
7 1 (0.45%) QA
System Software
1 138 (62.16%) Active Directory
2 35 (15.77%) VMware Infrastructure
3 25 (11.26%) Hyper-V
4 9 (4.05%) Virtual Desktop
5 4 (1.80%) Postfix
5 4 (1.80%) VMware ESXi
6 3 (1.35%) BitLocker
6 3 (1.35%) Docker
6 3 (1.35%) Virtual Machines
6 3 (1.35%) XenApp
7 2 (0.90%) vSphere
8 1 (0.45%) Dovecot
Systems Management
1 92 (41.44%) Microsoft Intune
2 21 (9.46%) Terraform
3 11 (4.95%) Jamf Pro
4 9 (4.05%) Autotask
5 6 (2.70%) Active Directory Federation Services
5 6 (2.70%) SCCM
6 5 (2.25%) FortiGate
6 5 (2.25%) Proxmox
6 5 (2.25%) Single Sign-On
7 4 (1.80%) Kubernetes
8 3 (1.35%) Failover Clustering
8 3 (1.35%) Nessus
8 3 (1.35%) PaperCut
9 2 (0.90%) Ansible
9 2 (0.90%) WSUS
10 1 (0.45%) Cisco CUCM
10 1 (0.45%) Prometheus
10 1 (0.45%) SmoothWall
Vendors
1 190 (85.59%) Microsoft
2 40 (18.02%) VMware
3 22 (9.91%) Apple
4 19 (8.56%) Cisco
5 12 (5.41%) Citrix
6 10 (4.50%) Datto
6 10 (4.50%) Meraki
7 9 (4.05%) Veeam
8 7 (3.15%) Freshdesk
9 6 (2.70%) Google
10 5 (2.25%) Logitech
11 4 (1.80%) Sage
12 3 (1.35%) IBM
12 3 (1.35%) Sophos
13 2 (0.90%) arcserve
13 2 (0.90%) Aruba
13 2 (0.90%) CheckPoint
13 2 (0.90%) Forcepoint
13 2 (0.90%) HP
13 2 (0.90%) SonicWALL