Consultant Contracts with Hybrid/Remote/WFH Options

Consultant
UK > Work from Home

The median Consultant daily rate for remote or hybrid work is £550, according to job vacancies posted in the 6 months leading up to 5 May 2025.

The table below provides contractor rate benchmarking and summary statistics, comparing them to the same period in the previous two years.

6 months to
5 May 2025
Same period 2024 Same period 2023
Rank 24 19 27
Rank change year-on-year -5 +8 +18
Contract jobs requiring a Consultant 783 1,229 1,717
As % of all contract jobs with a WFH option 7.98% 8.11% 6.72%
As % of the Job Titles category 8.51% 8.68% 7.05%
Number of daily rates quoted 470 749 983
10th Percentile £413 £400 £425
25th Percentile £500 £463 £481
Median daily rate (50th Percentile) £550 £540 £550
Median % change year-on-year +1.85% -1.82% -
75th Percentile £638 £627 £650
90th Percentile £725 £714 £721
UK median daily rate £550 £550 £550
Number of hourly rates quoted 6 6 53
10th Percentile £47.63 £42.50 £24.55
25th Percentile £75.88 £59.48 £55.00
Median hourly rate £86.00 £63.00 £66.00
Median % change year-on-year +36.51% -4.55% -
75th Percentile - £65.95 £75.75
90th Percentile - £70.63 £86.80
UK median hourly rate £78.75 £61.60 £66.00
% change year-on-year +27.84% -6.67% +0.76%

All Contract IT Job Vacancies
Work from Home

For comparison with the information above, the following table provides summary statistics for all contract IT job vacancies with WFH or hybrid options. Most job vacancies include a discernible job title that can be normalized. As such, the figures in the second row provide an indication of the number of contract jobs in our overall sample.

Contract vacancies in Work from Home with a recognized job title 9,196 14,167 24,342
% of contract IT jobs with a recognized job title 93.78% 93.50% 95.31%
Number of daily rates quoted 6,297 9,496 17,179
10th Percentile £338 £325 £358
25th Percentile £413 £425 £443
Median daily rate (50th Percentile) £525 £525 £538
Median % change year-on-year - -2.33% +2.38%
75th Percentile £638 £638 £650
90th Percentile £775 £750 £750
UK median daily rate £515 £525 £540
% change year-on-year -1.97% -2.78% +2.86%
Number of hourly rates quoted 227 575 559
10th Percentile £14.00 £14.33 £17.68
25th Percentile £17.21 £23.29 £25.71
Median hourly rate £35.00 £43.00 £54.00
Median % change year-on-year -18.60% -20.37% +54.29%
75th Percentile £66.75 £62.75 £68.75
90th Percentile £75.00 £75.25 £80.25
UK median hourly rate £28.88 £36.50 £45.00
% change year-on-year -20.89% -18.89% +90.68%

Consultant
Trend for Jobs with a WFH Option

Job vacancies with remote working options which featured Consultant in the job title as a proportion of all IT jobs advertised.
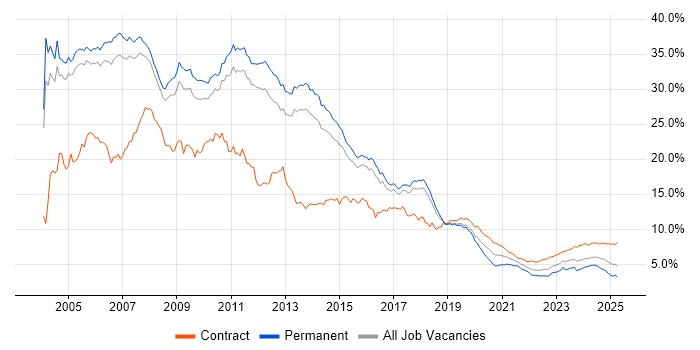
Consultant trend for jobs with Hybrid/Remote/WFH options

Consultant
Daily Rate Trend for Jobs with a WFH Option

3-month moving average daily rate quoted in job vacancies with remote working options citing Consultant.

Consultant daily rate for jobs with a WFH option

Consultant
Daily Rate Histogram for Jobs with a WFH Option

Daily rate distribution for jobs with remote working options citing Consultant over the 6 months to 5 May 2025.

Consultant daily rate histogram for jobs with a WFH option

Consultant
Hourly Rate Trend for Jobs with a WFH Option

3-month moving average hourly rate quoted in job vacancies with remote working options citing Consultant.

Consultant hourly rate for jobs with a WFH option

Consultant
Hourly Rate Histogram for Jobs with a WFH Option

Hourly rate distribution for jobs with remote working options citing Consultant over the 6 months to 5 May 2025.

Consultant hourly rate histogram for jobs with a WFH option

Consultant Skill Set
Top 30 Co-occurring Skills and Capabilities in Job Vacancies with WFH Options

For the 6 months to 5 May 2025, Consultant contract job roles required the following skills and capabilities in order of popularity. The figures indicate the absolute number co-occurrences and as a proportion of all contract jobs with a WFH option featuring Consultant in the job title.

1 237 (30.27%) SAP
2 207 (26.44%) Social Skills
3 168 (21.46%) Finance
4 141 (18.01%) Migration
5 110 (14.05%) Problem-Solving
6 103 (13.15%) Security Cleared
7 100 (12.77%) SAP S/4HANA
7 100 (12.77%) Oracle
8 93 (11.88%) Azure
9 83 (10.60%) SC Cleared
10 81 (10.34%) Microsoft
11 79 (10.09%) Analytical Skills
12 76 (9.71%) Data Migration
13 69 (8.81%) Agile
14 66 (8.43%) SQL
15 59 (7.54%) Stakeholder Management
16 54 (6.90%) ERP
17 48 (6.13%) Public Sector
18 42 (5.36%) Retail
19 40 (5.11%) DevOps
20 39 (4.98%) Workshop Facilitation
20 39 (4.98%) Analytics
21 38 (4.85%) Dynamics 365
22 36 (4.60%) Requirements Gathering
22 36 (4.60%) Degree
23 34 (4.34%) Manufacturing
23 34 (4.34%) Ariba
23 34 (4.34%) Cybersecurity
23 34 (4.34%) AWS
23 34 (4.34%) BPSS Clearance

Consultant Skill Set
Co-occurring Skills and Capabilities with WFH Options by Category

The follow tables expand on the table above by listing co-occurrences grouped by category. The same employment type, locality and period is covered with up to 20 co-occurrences shown in each of the following categories:

Application Platforms
1 14 (1.79%) SharePoint
2 6 (0.77%) Microsoft Exchange
3 5 (0.64%) Oracle Workflow
4 4 (0.51%) CMS
5 3 (0.38%) OpenStack
5 3 (0.38%) Oracle Self-Service HR
6 2 (0.26%) Anypoint
6 2 (0.26%) IBM Notes
7 1 (0.13%) Apache Spark
7 1 (0.13%) CICS
7 1 (0.13%) Confluence
7 1 (0.13%) Drupal
7 1 (0.13%) FactoryTalk
7 1 (0.13%) NetWeaver
7 1 (0.13%) nginx
7 1 (0.13%) Oracle SOA Suite
7 1 (0.13%) SAS
7 1 (0.13%) Tomcat
7 1 (0.13%) WebLogic
7 1 (0.13%) WordPress
Applications
1 12 (1.53%) Microsoft Excel
2 7 (0.89%) Microsoft Office
3 3 (0.38%) Microsoft PowerPoint
4 2 (0.26%) Microsoft Project
4 2 (0.26%) MS Visio
4 2 (0.26%) Oracle Smart View
5 1 (0.13%) AutoCAD
5 1 (0.13%) Photoshop
5 1 (0.13%) Revit
Business Applications
1 100 (12.77%) SAP S/4HANA
2 33 (4.21%) Oracle EBS
3 21 (2.68%) Oracle EBS R12
4 20 (2.55%) SAP FI
5 14 (1.79%) SAP Payroll
5 14 (1.79%) SAP PP
5 14 (1.79%) SAP SD
6 13 (1.66%) SAP CO
6 13 (1.66%) SAP HR
6 13 (1.66%) SAP MM
7 12 (1.53%) SAP FI/CO
8 11 (1.40%) Maximo
8 11 (1.40%) Oracle ASCP
9 10 (1.28%) SAP MDG
10 9 (1.15%) Dynamics CRM
10 9 (1.15%) Oracle Financials
10 9 (1.15%) Oracle Payables
10 9 (1.15%) SAP IBP
10 9 (1.15%) Workday HCM
11 8 (1.02%) SAP EWM
Cloud Services
1 93 (11.88%) Azure
2 38 (4.85%) Dynamics 365
3 34 (4.34%) AWS
4 24 (3.07%) Power Platform
5 23 (2.94%) Azure DevOps
5 23 (2.94%) Microsoft 365
6 21 (2.68%) SuccessFactors
7 17 (2.17%) OCI
8 13 (1.66%) Entra ID
9 12 (1.53%) GCP
10 11 (1.40%) PowerApps
10 11 (1.40%) SaaS
11 10 (1.28%) Azure Sentinel
12 9 (1.15%) Power Automate
13 6 (0.77%) Microsoft Purview
14 4 (0.51%) Boomi
14 4 (0.51%) IaaS
14 4 (0.51%) PaaS
15 3 (0.38%) GitHub
15 3 (0.38%) OneDrive
Communications & Networking
1 17 (2.17%) Firewall
2 10 (1.28%) BGP
3 9 (1.15%) VPN
4 7 (0.89%) MPLS
4 7 (0.89%) WAN
5 6 (0.77%) Cisco Nexus
6 5 (0.64%) Ethernet
6 5 (0.64%) LAN
6 5 (0.64%) Network Security
6 5 (0.64%) VXLAN
7 4 (0.51%) Ethernet VPN
7 4 (0.51%) OSPF
7 4 (0.51%) SD-WAN
7 4 (0.51%) Wireless
8 3 (0.38%) Internet
8 3 (0.38%) Multicast
8 3 (0.38%) NetScaler
8 3 (0.38%) SSL
9 2 (0.26%) Cisco ASA
9 2 (0.26%) Unified Communications
Database & Business Intelligence
1 14 (1.79%) Data Warehouse
1 14 (1.79%) SAP HANA
1 14 (1.79%) SQL Server
2 13 (1.66%) Power BI
3 9 (1.15%) Oracle Database
4 7 (0.89%) Oracle Reports
4 7 (0.89%) Tableau
5 5 (0.64%) SAP BW
6 4 (0.51%) Amazon RDS
6 4 (0.51%) PostgreSQL
7 3 (0.38%) Azure SQL Database
7 3 (0.38%) Data Mining
7 3 (0.38%) Oracle BI Publisher
7 3 (0.38%) Power Query
7 3 (0.38%) SAP Data Services
8 2 (0.26%) DataStage
8 2 (0.26%) GIS
8 2 (0.26%) MS Access
8 2 (0.26%) RDBMS
8 2 (0.26%) Relational Database
Development Applications
1 13 (1.66%) JIRA
2 5 (0.64%) Git
3 4 (0.51%) Hudson
3 4 (0.51%) JMeter
3 4 (0.51%) LoadRunner
3 4 (0.51%) Serenity BDD
4 3 (0.38%) Postman
5 2 (0.26%) GitLab
5 2 (0.26%) Sonatype Nexus
5 2 (0.26%) Subversion
6 1 (0.13%) Artifactory
6 1 (0.13%) Bitbucket
6 1 (0.13%) Cucumber
6 1 (0.13%) LSMW
6 1 (0.13%) Octopus Deploy
6 1 (0.13%) REST Assured
6 1 (0.13%) Selenium
6 1 (0.13%) Snyk
6 1 (0.13%) Team Foundation Server
6 1 (0.13%) webpack
General
1 207 (26.44%) Social Skills
2 168 (21.46%) Finance
3 79 (10.09%) Analytical Skills
4 48 (6.13%) Public Sector
5 42 (5.36%) Retail
6 34 (4.34%) Manufacturing
7 23 (2.94%) Banking
8 16 (2.04%) Law
8 16 (2.04%) Marketing
8 16 (2.04%) Pharmaceutical
8 16 (2.04%) Presentation Skills
9 14 (1.79%) General Ledger
10 13 (1.66%) Billing
10 13 (1.66%) Inclusion and Diversity
11 11 (1.40%) Legal
12 9 (1.15%) Local Government
13 8 (1.02%) Documentation Skills
13 8 (1.02%) Organisational Skills
14 7 (0.89%) Automotive
15 6 (0.77%) Investment Banking
Libraries, Frameworks & Software Standards
1 22 (2.81%) Oracle Fusion
2 10 (1.28%) Middleware
3 9 (1.15%) SAP Fiori
4 8 (1.02%) CSS
4 8 (1.02%) Web Services
5 6 (0.77%) EDI
5 6 (0.77%) SAP Basis
6 5 (0.64%) HTML
6 5 (0.64%) REST
7 4 (0.51%) IDoc
7 4 (0.51%) XML
8 3 (0.38%) .NET
8 3 (0.38%) AngularJS
8 3 (0.38%) EntireX
8 3 (0.38%) SAP TM
9 2 (0.26%) Gherkin
9 2 (0.26%) React
9 2 (0.26%) SAP PI
9 2 (0.26%) SOAP
9 2 (0.26%) YAML
Miscellaneous
1 20 (2.55%) Onboarding
2 18 (2.30%) Mainframe
3 15 (1.92%) Management Information System
4 13 (1.66%) Product Ownership
5 12 (1.53%) Legacy Systems
6 11 (1.40%) Data Centre
6 11 (1.40%) Operational Technology
7 10 (1.28%) Data Protection Act
7 10 (1.28%) Greenfield Project
8 8 (1.02%) Data Structures
8 8 (1.02%) Hybrid Cloud
9 7 (0.89%) CMDB
9 7 (0.89%) Enterprise Software
9 7 (0.89%) Life Science
10 6 (0.77%) SCADA
11 5 (0.64%) Cyberattack
11 5 (0.64%) Virtual Team
12 4 (0.51%) Cyber Threat
12 4 (0.51%) Marketing Technology
12 4 (0.51%) Self-Motivation
Operating Systems
1 25 (3.19%) Windows
2 16 (2.04%) Linux
3 7 (0.89%) Unix
4 4 (0.51%) Windows Server
5 3 (0.38%) Data ONTAP
6 2 (0.26%) Android
6 2 (0.26%) Apple iOS
6 2 (0.26%) Mac OS
6 2 (0.26%) Windows 10
6 2 (0.26%) Windows Server 2019
7 1 (0.13%) AIX
7 1 (0.13%) Oracle Linux
7 1 (0.13%) Red Hat Enterprise Linux
7 1 (0.13%) VMS
7 1 (0.13%) Windows Server 2008
Processes & Methodologies
1 141 (18.01%) Migration
2 110 (14.05%) Problem-Solving
3 76 (9.71%) Data Migration
4 69 (8.81%) Agile
5 59 (7.54%) Stakeholder Management
6 54 (6.90%) ERP
7 40 (5.11%) DevOps
8 39 (4.98%) Analytics
8 39 (4.98%) Workshop Facilitation
9 36 (4.60%) Requirements Gathering
10 34 (4.34%) Cybersecurity
10 34 (4.34%) Roadmaps
11 33 (4.21%) Risk Management
12 32 (4.09%) Project Management
13 31 (3.96%) Project Delivery
14 30 (3.83%) Knowledge Transfer
15 29 (3.70%) Stakeholder Engagement
16 27 (3.45%) Information Security
16 27 (3.45%) Validation
17 26 (3.32%) User Acceptance Testing
Programming Languages
1 66 (8.43%) SQL
2 22 (2.81%) Python
3 16 (2.04%) PL/SQL
4 15 (1.92%) PowerShell
5 13 (1.66%) ABAP
5 13 (1.66%) Java
5 13 (1.66%) JavaScript
6 7 (0.89%) C#
7 4 (0.51%) C
7 4 (0.51%) PeopleCode
7 4 (0.51%) T-SQL
8 3 (0.38%) Bash
8 3 (0.38%) Data Analysis Expressions
8 3 (0.38%) Natural
9 2 (0.26%) Assembly Language
9 2 (0.26%) Groovy
9 2 (0.26%) JCL
9 2 (0.26%) Kusto Query Language
9 2 (0.26%) Perl
10 1 (0.13%) C++
Qualifications
1 103 (13.15%) Security Cleared
2 83 (10.60%) SC Cleared
3 36 (4.60%) Degree
4 34 (4.34%) BPSS Clearance
5 13 (1.66%) Azure Certification
6 12 (1.53%) CISSP
7 9 (1.15%) CISM
7 9 (1.15%) Computer Science Degree
8 8 (1.02%) Microsoft Certification
9 7 (0.89%) DV Cleared
10 6 (0.77%) Cisco Certification
11 5 (0.64%) APMG
11 5 (0.64%) CRISC
12 4 (0.51%) CCIE
12 4 (0.51%) CCNP
12 4 (0.51%) SAP Certification
13 3 (0.38%) GCIH
13 3 (0.38%) ITIL Certification
13 3 (0.38%) PMI Certification
13 3 (0.38%) PMP
Quality Assurance & Compliance
1 25 (3.19%) NIST
2 19 (2.43%) GDPR
2 19 (2.43%) QA
3 16 (2.04%) Data Quality
4 13 (1.66%) GRC
5 12 (1.53%) ISO/IEC 27001
6 5 (0.64%) Accessibility
6 5 (0.64%) IFRS
6 5 (0.64%) PCI DSS
6 5 (0.64%) Sarbanes-Oxley
7 4 (0.51%) Actionable Recommendations
7 4 (0.51%) ISO/IEC 27005
7 4 (0.51%) NCSC
7 4 (0.51%) NIST 800
8 3 (0.38%) Basel II
8 3 (0.38%) HIPAA
8 3 (0.38%) IFRS 9
9 2 (0.26%) Basel III
9 2 (0.26%) GAAP
9 2 (0.26%) WCAG
System Software
1 16 (2.04%) Active Directory
2 9 (1.15%) VMware Infrastructure
3 6 (0.77%) VMware NSX
4 5 (0.64%) vSphere
5 4 (0.51%) Docker
6 3 (0.38%) Virtual Machines
7 2 (0.26%) Firmware
7 2 (0.26%) RACF
7 2 (0.26%) Virtual Desktop
7 2 (0.26%) VMware ESXi
8 1 (0.13%) Hyper-V
Systems Management
1 13 (1.66%) Microsoft Intune
2 9 (1.15%) Terraform
3 6 (0.77%) Kubernetes
3 6 (0.77%) SCCM
4 5 (0.64%) Perfmon
5 4 (0.51%) Ansible
5 4 (0.51%) FortiGate
6 3 (0.38%) Single Sign-On
6 3 (0.38%) vRealize
7 2 (0.26%) Control-M
7 2 (0.26%) Grafana
7 2 (0.26%) HP ALM
7 2 (0.26%) OMEGAMON
7 2 (0.26%) PowerCLI
7 2 (0.26%) Progress Chef
7 2 (0.26%) Prometheus
7 2 (0.26%) Tivoli
8 1 (0.13%) CA Endevor
8 1 (0.13%) MIIS
8 1 (0.13%) Nessus
Vendors
1 237 (30.27%) SAP
2 100 (12.77%) Oracle
3 81 (10.34%) Microsoft
4 34 (4.34%) Ariba
5 23 (2.94%) ServiceNow
6 20 (2.55%) Workday
7 16 (2.04%) BMC
8 15 (1.92%) IFS
8 15 (1.92%) Salesforce
8 15 (1.92%) VMware
9 11 (1.40%) Cisco
10 9 (1.15%) IBM
10 9 (1.15%) Splunk
11 7 (0.89%) Informatica
12 6 (0.77%) Fortinet
12 6 (0.77%) Google
12 6 (0.77%) Infor
13 5 (0.64%) Dynatrace
13 5 (0.64%) Fujitsu
13 5 (0.64%) Palo Alto