Knowledge Transfer Contracts with Work from Home Options

Knowledge Transfer
UK > Work from Home

The table below provides summary statistics for contract job vacancies with an option to work from home (WFH) and a requirement for Knowledge Transfer skills. Included is a benchmarking guide to the contractor rates offered in vacancies that have cited Knowledge Transfer over the 6 months to 27 April 2024 with a comparison to the same period in the previous 2 years.

6 months to
27 Apr 2024
Same period 2023 Same period 2022
Rank 221 241 338
Rank change year-on-year +20 +97 -64
Contract jobs citing Knowledge Transfer 126 252 313
As % of all contract jobs with a WFH option 0.82% 0.97% 0.70%
As % of the Processes & Methodologies category 0.94% 1.08% 0.77%
Number of daily rates quoted 91 181 230
10th Percentile £375 £400 £363
25th Percentile £450 £454 £425
Median daily rate (50th Percentile) £501 £525 £500
Median % change year-on-year -4.67% +5.00% +4.17%
75th Percentile £594 £673 £588
90th Percentile £738 £745 £700
UK median daily rate £525 £525 £500
% change year-on-year - +5.00% -
Number of hourly rates quoted 5 0 0
10th Percentile £17.98 - -
25th Percentile £23.34 - -
Median hourly rate £50.00 - -
75th Percentile £86.50 - -
90th Percentile - - -
UK median hourly rate £50.00 £17.00 £15.86
% change year-on-year +194.12% +7.19% -79.27%

All Process and Methodology Skills
Work from Home

Knowledge Transfer is in the Processes and Methodologies category. The following table is for comparison with the above and provides summary statistics for all contract job vacancies with a WFH option and a requirement for process or methodology skills.

Contract vacancies with a requirement for process or methodology skills 13,424 23,302 40,603
As % of all contract jobs with a WFH option 87.87% 89.87% 91.14%
Number of daily rates quoted 8,958 16,466 29,448
10th Percentile £325 £363 £360
25th Percentile £425 £450 £431
Median daily rate (50th Percentile) £525 £540 £525
Median % change year-on-year -2.78% +2.86% +8.47%
75th Percentile £638 £650 £625
90th Percentile £750 £750 £714
UK median daily rate £525 £550 £525
% change year-on-year -4.55% +4.76% +8.25%
Number of hourly rates quoted 564 535 543
10th Percentile £15.05 £19.00 £13.55
25th Percentile £24.19 £30.88 £20.12
Median hourly rate £40.13 £55.00 £35.00
Median % change year-on-year -27.05% +57.14% +35.92%
75th Percentile £60.00 £68.88 £55.00
90th Percentile £75.25 £80.25 £66.95
UK median hourly rate £35.00 £37.34 £25.00
% change year-on-year -6.27% +49.36% -

Knowledge Transfer
Trend for Jobs with a WFH Option

Job vacancies with a work from home option citing Knowledge Transfer as a proportion of all IT jobs advertised.
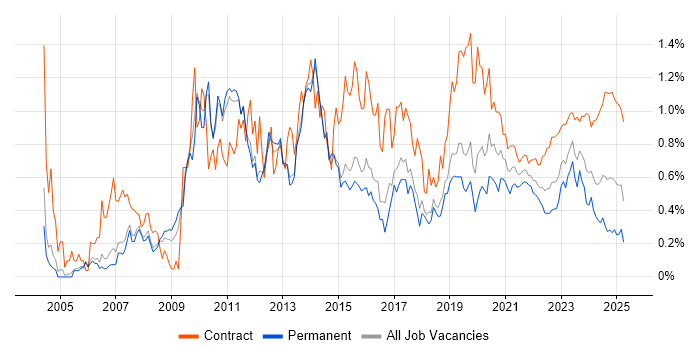
Knowledge Transfer trend for jobs with a WFH option

Knowledge Transfer
Daily Rate Trend for Jobs with a WFH Option

3-month moving average daily rate quoted in job vacancies with a work from home option citing Knowledge Transfer.

Knowledge Transfer daily rate for jobs with a WFH option

Knowledge Transfer
Daily Rate Histogram for Jobs with a WFH Option

Daily rate distribution for jobs with a work from home option citing Knowledge Transfer over the 6 months to 27 April 2024.

Knowledge Transfer daily rate histogram for jobs with a WFH option

Knowledge Transfer
Hourly Rate Trend for Jobs with a WFH Option

3-month moving average hourly rate quoted in job vacancies with a work from home option citing Knowledge Transfer.

Knowledge Transfer hourly rate for jobs with a WFH option

Knowledge Transfer
Hourly Rate Histogram for Jobs with a WFH Option

Hourly rate distribution for jobs with a work from home option citing Knowledge Transfer over the 6 months to 27 April 2024.

Knowledge Transfer hourly rate histogram for jobs with a WFH option

Knowledge Transfer
Co-occurring Skills and Capabilities with WFH Options by Category

The follow tables expand on the table above by listing co-occurrences grouped by category. The same employment type, locality and period is covered with up to 20 co-occurrences shown in each of the following categories:

Application Platforms
1 3 (2.38%) Confluence
2 1 (0.79%) CMS
2 1 (0.79%) Mendix
2 1 (0.79%) SharePoint
2 1 (0.79%) Sitecore CMS
Applications
1 5 (3.97%) Microsoft Office
2 3 (2.38%) Microsoft PowerPoint
3 2 (1.59%) Microsoft Excel
3 2 (1.59%) MS Visio
4 1 (0.79%) Microsoft Project
Business Applications
1 5 (3.97%) SAP PM
2 2 (1.59%) Oracle ASCP
2 2 (1.59%) Oracle ERP
2 2 (1.59%) Oracle General Ledger
2 2 (1.59%) Oracle SCM
3 1 (0.79%) Infor CloudSuite Industrial (formerly SyteLine)
3 1 (0.79%) Oracle Applications
3 1 (0.79%) Oracle Assets
3 1 (0.79%) Oracle Procure-to-Pay
3 1 (0.79%) Remedy ITSM
3 1 (0.79%) Salesforce CRM
3 1 (0.79%) SAP CO
3 1 (0.79%) SAP FI
3 1 (0.79%) SAP FI/CO
3 1 (0.79%) SAP S/4HANA
3 1 (0.79%) SAP SD
Cloud Services
1 25 (19.84%) Azure
2 11 (8.73%) AWS
3 9 (7.14%) Azure DevOps
4 7 (5.56%) OCI
4 7 (5.56%) Power Platform
4 7 (5.56%) SaaS
5 5 (3.97%) Cloud Computing
5 5 (3.97%) GCP
5 5 (3.97%) Microsoft 365
6 4 (3.17%) IaaS
6 4 (3.17%) PaaS
7 3 (2.38%) Azure Key Vault
8 2 (1.59%) Catchpoint
8 2 (1.59%) Google Analytics
8 2 (1.59%) Microsoft Purview
8 2 (1.59%) Salesforce Sales Cloud
8 2 (1.59%) Salesforce Service Cloud
9 1 (0.79%) Azure Data Factory
9 1 (0.79%) Azure Service Bus
9 1 (0.79%) ChatGPT
Communications & Networking
1 7 (5.56%) Firewall
2 5 (3.97%) DSL
2 5 (3.97%) InfiniBand
2 5 (3.97%) Network Security
3 3 (2.38%) DNS
3 3 (2.38%) SD-WAN
3 3 (2.38%) VPN
3 3 (2.38%) WAN
4 2 (1.59%) IPv6
4 2 (1.59%) LAN
4 2 (1.59%) SSL
4 2 (1.59%) WLAN
5 1 (0.79%) BGP
5 1 (0.79%) DHCP
5 1 (0.79%) GSM
5 1 (0.79%) HTTP
5 1 (0.79%) MPLS
5 1 (0.79%) OSPF
5 1 (0.79%) SAN
5 1 (0.79%) VoIP
Database & Business Intelligence
1 7 (5.56%) Ingres
1 7 (5.56%) Power BI
2 2 (1.59%) Oracle ODI
2 2 (1.59%) Oracle Reports
2 2 (1.59%) PostgreSQL
3 1 (0.79%) Big Data
3 1 (0.79%) Data Warehouse
3 1 (0.79%) NoSQL
3 1 (0.79%) Oracle BI EE
3 1 (0.79%) Power Query
3 1 (0.79%) SQL Server
3 1 (0.79%) Tableau
Development Applications
1 11 (8.73%) JIRA
2 6 (4.76%) MLflow
3 5 (3.97%) Jenkins
4 4 (3.17%) Oracle APEX
5 2 (1.59%) Mocha
6 1 (0.79%) Bitbucket
6 1 (0.79%) SQL Server Management Studio (SSMS)
General
1 43 (34.13%) Social Skills
2 36 (28.57%) Finance
3 28 (22.22%) Public Sector
4 23 (18.25%) Analytical Skills
5 12 (9.52%) Manufacturing
5 12 (9.52%) Presentation Skills
6 11 (8.73%) Banking
7 8 (6.35%) Electronics
7 8 (6.35%) Telecoms
8 7 (5.56%) Investment Banking
8 7 (5.56%) Marketing
9 6 (4.76%) Front Office
10 4 (3.17%) Retail
11 2 (1.59%) Back Office
11 2 (1.59%) Documentation Skills
11 2 (1.59%) Local Government
12 1 (0.79%) German Language
12 1 (0.79%) Influencing Skills
Job Titles
1 18 (14.29%) Senior
2 15 (11.90%) Analyst
2 15 (11.90%) Developer
3 10 (7.94%) Lead
4 8 (6.35%) Consultant
4 8 (6.35%) Data Engineer
4 8 (6.35%) DBA
5 7 (5.56%) Business Analyst
5 7 (5.56%) Ingres DBA
6 6 (4.76%) Lead Data Engineer
6 6 (4.76%) Network Engineer
6 6 (4.76%) Project Manager
6 6 (4.76%) Senior Developer
7 5 (3.97%) .NET Developer
7 5 (3.97%) Architect
7 5 (3.97%) Java Developer
7 5 (3.97%) React Developer
7 5 (3.97%) Senior Network Engineer
7 5 (3.97%) Windows Engineer
8 4 (3.17%) GCP Developer
Libraries, Frameworks & Software Standards
1 8 (6.35%) React
2 6 (4.76%) .NET
3 2 (1.59%) CSS
3 2 (1.59%) HTML
3 2 (1.59%) Jest
3 2 (1.59%) JSON
3 2 (1.59%) Redux
4 1 (0.79%) .NET Framework
4 1 (0.79%) ADO
4 1 (0.79%) ASP.NET
4 1 (0.79%) ASP.NET Core
4 1 (0.79%) CSS3
4 1 (0.79%) Entity Framework
4 1 (0.79%) HTML5
4 1 (0.79%) JSON Schema
4 1 (0.79%) Oracle Fusion
4 1 (0.79%) REST
4 1 (0.79%) SailPoint
4 1 (0.79%) XML
Miscellaneous
1 13 (10.32%) Product Ownership
2 6 (4.76%) Derivative
2 6 (4.76%) Virtual Team
3 5 (3.97%) Data Centre
3 5 (3.97%) Legacy Applications
3 5 (3.97%) Public Cloud
3 5 (3.97%) Wiki
4 3 (2.38%) Onboarding
4 3 (2.38%) Operational Technology
4 3 (2.38%) PKI
5 2 (1.59%) Data Structures
5 2 (1.59%) Educational Technology
5 2 (1.59%) Legacy Systems
6 1 (0.79%) Analytical Mindset
6 1 (0.79%) Data Protection Act
6 1 (0.79%) Enterprise Software
6 1 (0.79%) Learning Management System
6 1 (0.79%) Private Cloud
6 1 (0.79%) Renewable Energy
6 1 (0.79%) Security Posture
Operating Systems
1 14 (11.11%) Windows
2 9 (7.14%) Unix
3 7 (5.56%) Linux
4 4 (3.17%) Solaris
5 3 (2.38%) VMS
6 2 (1.59%) Windows Server
7 1 (0.79%) AIX
7 1 (0.79%) Windows 10
7 1 (0.79%) Windows Server 2012
7 1 (0.79%) Windows Server 2016
Processes & Methodologies
1 31 (24.60%) Problem-Solving
2 29 (23.02%) Agile
3 20 (15.87%) User Acceptance Testing
4 17 (13.49%) Business Intelligence
4 17 (13.49%) DevOps
5 15 (11.90%) Migration
6 13 (10.32%) Project Management
7 12 (9.52%) Analytics
7 12 (9.52%) Data Migration
7 12 (9.52%) Project Delivery
7 12 (9.52%) Test Scripting
8 11 (8.73%) Business Analysis
8 11 (8.73%) Data Modelling
8 11 (8.73%) Mentoring
9 10 (7.94%) CI/CD
9 10 (7.94%) Computer Science
9 10 (7.94%) ERP
9 10 (7.94%) Roadmaps
10 9 (7.14%) Stakeholder Management
10 9 (7.14%) User Experience
Programming Languages
1 8 (6.35%) Python
2 6 (4.76%) Java
2 6 (4.76%) Scala
3 5 (3.97%) Ruby
4 3 (2.38%) SQL
5 2 (1.59%) JavaScript
6 1 (0.79%) Perl
6 1 (0.79%) PowerShell
6 1 (0.79%) T-SQL
6 1 (0.79%) VBA
Qualifications
1 23 (18.25%) Degree
2 16 (12.70%) Security Cleared
3 13 (10.32%) SC Cleared
4 8 (6.35%) Computer Science Degree
5 7 (5.56%) SAP Certification
6 6 (4.76%) Master's Degree
7 3 (2.38%) PMI Certification
7 3 (2.38%) PMP
8 2 (1.59%) CCIE
8 2 (1.59%) CCNP
8 2 (1.59%) Cisco Certification
8 2 (1.59%) DV Cleared
9 1 (0.79%) ISTQB
9 1 (0.79%) ITIL Certification
9 1 (0.79%) MCSE
9 1 (0.79%) Microsoft Certification
9 1 (0.79%) PRINCE2 Certification
Quality Assurance & Compliance
1 7 (5.56%) Data Quality
1 7 (5.56%) QA
2 4 (3.17%) Accessibility
2 4 (3.17%) SLA
3 2 (1.59%) Cyber Essentials
3 2 (1.59%) Cyber Essentials PLUS
3 2 (1.59%) Disclosure Scotland
3 2 (1.59%) PMO
3 2 (1.59%) Sarbanes-Oxley
4 1 (0.79%) GxP
4 1 (0.79%) ISO/IEC 27001
4 1 (0.79%) ISO/IEC 27002 (supersedes ISO/IEC 17799)
4 1 (0.79%) PCI DSS
System Software
1 3 (2.38%) Active Directory
1 3 (2.38%) VMware Infrastructure
2 2 (1.59%) VMware NSX
3 1 (0.79%) Citrix Presentation Server
3 1 (0.79%) Hyper-V
3 1 (0.79%) Microsoft App-V
3 1 (0.79%) VMware ESXi
3 1 (0.79%) XenApp
3 1 (0.79%) XenDesktop
Systems Management
1 6 (4.76%) Ansible
2 5 (3.97%) CFEngine
2 5 (3.97%) PowerBroker
2 5 (3.97%) Progress Chef
2 5 (3.97%) Puppet
3 3 (2.38%) Kubernetes
4 1 (0.79%) Active Directory Federation Services
4 1 (0.79%) Data Guard
4 1 (0.79%) HP Quality Center
4 1 (0.79%) Microsoft Intune
4 1 (0.79%) SCCM
4 1 (0.79%) SysTrack
4 1 (0.79%) vRealize
Vendors
1 19 (15.08%) SAP
2 16 (12.70%) Oracle
3 12 (9.52%) Microsoft
4 7 (5.56%) Databricks
4 7 (5.56%) Google
5 5 (3.97%) Atlassian
5 5 (3.97%) Palo Alto
5 5 (3.97%) Salesforce
6 4 (3.17%) VMware
7 2 (1.59%) Actian
7 2 (1.59%) AppNeta
7 2 (1.59%) Ariba
7 2 (1.59%) Arista
7 2 (1.59%) Cisco
7 2 (1.59%) Citrix
7 2 (1.59%) Fortinet
7 2 (1.59%) IBM
7 2 (1.59%) Liquidlogic
7 2 (1.59%) Remedy
7 2 (1.59%) Tufin