Consultant Jobs with Hybrid/Remote/WFH Options

Consultant
UK > Work from Home

The median Consultant salary for remote or hybrid work is £65,000 per year, according to job vacancies posted during the 6 months leading to 20 January 2025.

The table below provides salary benchmarking and summary statistics, comparing them to the same period in the previous two years.

6 months to
20 Jan 2025
Same period 2024 Same period 2023
Rank 77 74 91
Rank change year-on-year -3 +17 -25
Permanent jobs requiring a Consultant 804 1,067 1,679
As % of all permanent jobs with a WFH option 4.17% 4.26% 3.57%
As % of the Job Titles category 4.40% 4.43% 3.69%
Number of salaries quoted 391 757 1,257
10th Percentile £42,500 £43,750 £42,500
25th Percentile £50,000 £47,500 £52,500
Median annual salary (50th Percentile) £65,000 £65,000 £65,000
75th Percentile £83,750 £82,500 £80,000
90th Percentile £90,000 £91,000 £90,000
UK median annual salary £65,000 £62,500 £65,000
% change year-on-year +4.00% -3.85% +4.00%

All Permanent IT Job Vacancies
Work from Home

For comparison with the information above, the following table provides summary statistics for all permanent IT job vacancies with WFH or hybrid options. Most job vacancies include a discernible job title that can be normalized. As such, the figures in the second row provide an indication of the number of permanent jobs in our overall sample.

Permanent vacancies in Work from Home with a recognized job title 18,291 24,095 45,537
% of permanent jobs with a recognized job title 94.95% 96.11% 96.95%
Number of salaries quoted 9,646 18,301 33,753
10th Percentile £36,000 £35,000 £37,273
25th Percentile £47,000 £44,750 £47,500
Median annual salary (50th Percentile) £60,592 £60,000 £62,500
Median % change year-on-year +0.99% -4.00% +4.17%
75th Percentile £80,000 £77,500 £82,500
90th Percentile £98,750 £96,250 £97,500
UK median annual salary £58,033 £57,000 £60,000
% change year-on-year +1.81% -5.00% -

Consultant
Trend for Jobs with a WFH Option

Job vacancies with remote working options which featured Consultant in the job title as a proportion of all IT jobs advertised.
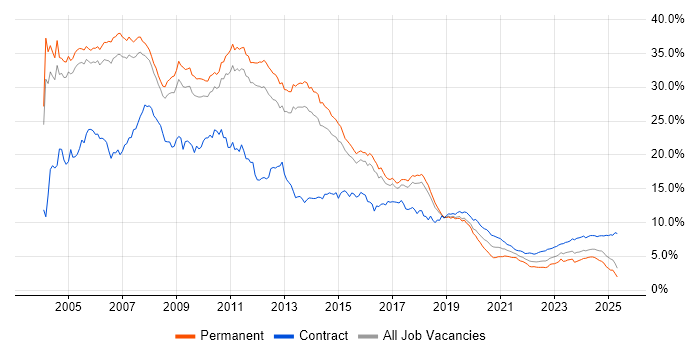
Consultant trend for jobs with Hybrid/Remote/WFH options

Consultant
Salary Trend for Jobs with a WFH Option

3-month moving average salary quoted in job vacancies with remote working options citing Consultant.

Consultant salary trend for jobs with a WFH option

Consultant
Salary Histogram for Jobs with a WFH Option

Salary distribution for jobs with remote working options citing Consultant over the 6 months to 20 January 2025.

Consultant salary histogram for jobs with a WFH option

Consultant Skill Set
Top 30 Co-occurring Skills and Capabilities in Job Vacancies with WFH Options

For the 6 months to 20 January 2025, Consultant job roles required the following skills and capabilities in order of popularity. The figures indicate the absolute number co-occurrences and as a proportion of all permanent jobs with hybrid or remote work options featuring Consultant in the job title.

1 228 (28.36%) Social Skills
2 203 (25.25%) Finance
3 190 (23.63%) Microsoft
4 163 (20.27%) SQL
5 149 (18.53%) Problem-Solving
6 136 (16.92%) Migration
7 131 (16.29%) Public Sector
8 120 (14.93%) Oracle
9 116 (14.43%) Security Cleared
10 105 (13.06%) Azure
11 104 (12.94%) Presales
12 103 (12.81%) Data Migration
12 103 (12.81%) Degree
13 97 (12.06%) Project Management
14 91 (11.32%) AWS
15 89 (11.07%) Local Government
15 89 (11.07%) DBS Check
15 89 (11.07%) Cybersecurity
16 87 (10.82%) SC Cleared
17 82 (10.20%) Analytical Skills
18 80 (9.95%) ERP
19 78 (9.70%) NEC
19 78 (9.70%) NEC Housing
20 77 (9.58%) Stakeholder Management
20 77 (9.58%) Data Cleansing
21 75 (9.33%) Accessibility
21 75 (9.33%) Police
22 74 (9.20%) Agile
23 71 (8.83%) PL/SQL
23 71 (8.83%) Analytics

Consultant Skill Set
Co-occurring Skills and Capabilities with WFH Options by Category

The follow tables expand on the table above by listing co-occurrences grouped by category. The same employment type, locality and period is covered with up to 20 co-occurrences shown in each of the following categories:

Application Platforms
1 25 (3.11%) SharePoint
2 16 (1.99%) Microsoft Exchange
3 5 (0.62%) Apache Spark
4 3 (0.37%) OpenEdge
5 2 (0.25%) Apache Airflow
5 2 (0.25%) IIS
6 1 (0.12%) Apache
6 1 (0.12%) CMS
6 1 (0.12%) Moodle
6 1 (0.12%) NetWeaver
6 1 (0.12%) Oracle Collaboration Suite
6 1 (0.12%) Totara
Applications
1 17 (2.11%) Microsoft Office
2 13 (1.62%) Microsoft Excel
3 6 (0.75%) Adobe Premiere
4 4 (0.50%) Spreadsheet
5 1 (0.12%) Microsoft Project
5 1 (0.12%) Oracle Smart View
Business Applications
1 78 (9.70%) NEC Housing
2 25 (3.11%) SAP S/4HANA
3 20 (2.49%) Oracle ERP
4 18 (2.24%) Oracle Receivables
5 17 (2.11%) Oracle Retail
5 17 (2.11%) SAP Business One
6 15 (1.87%) Oracle Payables
7 14 (1.74%) Dynamics CRM
8 12 (1.49%) Oracle EBS
9 11 (1.37%) PeopleSoft HCM
10 10 (1.24%) Oracle Financials
11 9 (1.12%) SAP HR
11 9 (1.12%) SAP SD
12 8 (1.00%) NetSuite
13 7 (0.87%) SAP FI
14 6 (0.75%) Odoo
15 4 (0.50%) SAP CO
15 4 (0.50%) SAP FI/CO
15 4 (0.50%) SAP MDG
15 4 (0.50%) SAP MM
Cloud Services
1 105 (13.06%) Azure
2 91 (11.32%) AWS
3 69 (8.58%) Power Platform
4 58 (7.21%) Microsoft 365
5 43 (5.35%) Dynamics 365
6 34 (4.23%) GCP
7 33 (4.10%) SaaS
8 20 (2.49%) Entra ID
9 16 (1.99%) OneDrive
9 16 (1.99%) Snowflake
10 14 (1.74%) Power Automate
11 12 (1.49%) OCI
12 8 (1.00%) Azure DevOps
12 8 (1.00%) Microsoft Copilot
12 8 (1.00%) PowerApps
13 7 (0.87%) Amazon EC2
13 7 (0.87%) Amazon S3
13 7 (0.87%) Azure AI
13 7 (0.87%) SuccessFactors
14 6 (0.75%) Serverless
Communications & Networking
1 52 (6.47%) Firewall
2 27 (3.36%) VLAN
3 26 (3.23%) TCP/IP
4 23 (2.86%) BGP
4 23 (2.86%) OSPF
5 20 (2.49%) WAN
6 15 (1.87%) SD-WAN
6 15 (1.87%) Wireless
7 12 (1.49%) Internet
7 12 (1.49%) Network Security
8 10 (1.24%) IPsec
8 10 (1.24%) VPN
9 8 (1.00%) LAN
9 8 (1.00%) MPLS
10 6 (0.75%) Cisco ISE
11 5 (0.62%) 802.11
11 5 (0.62%) DNS
11 5 (0.62%) GLBP
11 5 (0.62%) IGRP
11 5 (0.62%) Multicast
Database & Business Intelligence
1 64 (7.96%) Oracle Database
2 50 (6.22%) Power BI
3 29 (3.61%) Tableau
4 19 (2.36%) BusinessObjects
4 19 (2.36%) Relational Database
5 17 (2.11%) Data Warehouse
5 17 (2.11%) SQL Server
6 15 (1.87%) SAP HANA
7 14 (1.74%) Data Lake
8 13 (1.62%) SQL Server Integration Services
9 11 (1.37%) SQL Server Analysis Services
9 11 (1.37%) SQL Server Reporting Services
10 8 (1.00%) PostgreSQL
10 8 (1.00%) QlikView
11 7 (0.87%) Crystal Reports
12 6 (0.75%) Data Mining
13 5 (0.62%) Amazon RDS
13 5 (0.62%) Amazon Redshift
13 5 (0.62%) Looker
14 4 (0.50%) NoSQL
Development Applications
1 5 (0.62%) Git
1 5 (0.62%) PowerBuilder
2 4 (0.50%) LSMW
3 2 (0.25%) GitLab
3 2 (0.25%) MSI
4 1 (0.12%) Hudson
General
1 228 (28.36%) Social Skills
2 203 (25.25%) Finance
3 131 (16.29%) Public Sector
4 89 (11.07%) Local Government
5 82 (10.20%) Analytical Skills
6 75 (9.33%) Police
7 65 (8.08%) Inclusion and Diversity
8 50 (6.22%) Marketing
9 44 (5.47%) Retail
10 40 (4.98%) Presentation Skills
11 26 (3.23%) Manufacturing
12 23 (2.86%) Legal
13 22 (2.74%) Law
14 16 (1.99%) Organisational Skills
15 13 (1.62%) Pharmaceutical
16 12 (1.49%) Documentation Skills
17 10 (1.24%) Social Housing
18 6 (0.75%) Billing
18 6 (0.75%) Telecoms
19 5 (0.62%) Automotive
Libraries, Frameworks & Software Standards
1 31 (3.86%) HTML
2 23 (2.86%) AngularJS
3 16 (1.99%) Oracle Fusion
4 15 (1.87%) SailPoint
5 12 (1.49%) Web Services
6 9 (1.12%) PySpark
7 7 (0.87%) .NET
8 5 (0.62%) 802.1X
8 5 (0.62%) XML
9 4 (0.50%) SAP Fiori
10 3 (0.37%) OpenTelemetry
10 3 (0.37%) REST
11 2 (0.25%) CSS
11 2 (0.25%) EDI
11 2 (0.25%) GraphQL
11 2 (0.25%) JSON
11 2 (0.25%) LDAP
11 2 (0.25%) NETCONF
11 2 (0.25%) scikit-learn
11 2 (0.25%) TensorFlow
Miscellaneous
1 32 (3.98%) Management Information System
2 20 (2.49%) Self-Motivation
3 19 (2.36%) Onboarding
3 19 (2.36%) Operational Technology
4 18 (2.24%) Legacy Systems
5 17 (2.11%) Hybrid Cloud
6 14 (1.74%) Security Posture
7 13 (1.62%) Enterprise Software
8 12 (1.49%) SCADA
9 10 (1.24%) Data Centre
10 8 (1.00%) IoT
11 7 (0.87%) Housing Association
11 7 (0.87%) Low-Code
12 6 (0.75%) Algorithms
12 6 (0.75%) Analytical Mindset
12 6 (0.75%) Driving Licence
12 6 (0.75%) EPoS
12 6 (0.75%) FMCG
12 6 (0.75%) Private Cloud
13 5 (0.62%) NHS
Operating Systems
1 55 (6.84%) Windows
2 41 (5.10%) Linux
3 23 (2.86%) Windows Server
4 9 (1.12%) Unix
5 7 (0.87%) Solaris
6 3 (0.37%) Oracle Linux
7 2 (0.25%) Red Hat Enterprise Linux
7 2 (0.25%) Windows 10
7 2 (0.25%) Windows Server 2019
8 1 (0.12%) Amazon Linux
Processes & Methodologies
1 149 (18.53%) Problem-Solving
2 136 (16.92%) Migration
3 104 (12.94%) Presales
4 103 (12.81%) Data Migration
5 97 (12.06%) Project Management
6 89 (11.07%) Cybersecurity
7 80 (9.95%) ERP
8 77 (9.58%) Data Cleansing
8 77 (9.58%) Stakeholder Management
9 74 (9.20%) Agile
10 71 (8.83%) Analytics
11 70 (8.71%) Roadmaps
12 67 (8.33%) Mentoring
13 66 (8.21%) Artificial Intelligence
14 62 (7.71%) Requirements Gathering
15 60 (7.46%) Machine Learning
16 58 (7.21%) Continuous Improvement
17 56 (6.97%) Data Science
18 55 (6.84%) Project Delivery
19 52 (6.47%) Coaching
Programming Languages
1 163 (20.27%) SQL
2 71 (8.83%) PL/SQL
3 47 (5.85%) Python
4 35 (4.35%) JavaScript
5 25 (3.11%) R
6 17 (2.11%) T-SQL
7 13 (1.62%) Scala
8 12 (1.49%) Java
9 10 (1.24%) PowerShell
10 8 (1.00%) C#
11 7 (0.87%) ABAP
12 4 (0.50%) VB.NET
13 3 (0.37%) Progress 4GL
14 1 (0.12%) Data Analysis Expressions
14 1 (0.12%) Go
14 1 (0.12%) Perl
14 1 (0.12%) VB
14 1 (0.12%) VBA
Qualifications
1 116 (14.43%) Security Cleared
2 103 (12.81%) Degree
3 89 (11.07%) DBS Check
4 87 (10.82%) SC Cleared
5 33 (4.10%) BPSS Clearance
6 29 (3.61%) CISSP
7 24 (2.99%) Microsoft Certification
8 23 (2.86%) CEH
9 22 (2.74%) Computer Science Degree
10 12 (1.49%) Cisco Certification
10 12 (1.49%) CISM
10 12 (1.49%) GCFE
10 12 (1.49%) GCIA
10 12 (1.49%) GCIH
11 11 (1.37%) CompTIA Security+
12 10 (1.24%) Azure Certification
13 9 (1.12%) Master's Degree
14 8 (1.00%) CCNP
15 7 (0.87%) PMI Certification
15 7 (0.87%) PMP
Quality Assurance & Compliance
1 75 (9.33%) Accessibility
2 27 (3.36%) Data Quality
3 26 (3.23%) ISO/IEC 27001
4 23 (2.86%) NIST
5 18 (2.24%) GRC
6 17 (2.11%) GDPR
7 13 (1.62%) QA
8 11 (1.37%) PMO
9 9 (1.12%) ISO/IEC 20000
10 8 (1.00%) ISO 9001
11 5 (0.62%) Cyber Essentials
11 5 (0.62%) PCI DSS
12 4 (0.50%) EU AI Act
12 4 (0.50%) ISO/IEC 27002 (supersedes ISO/IEC 17799)
13 2 (0.25%) Actionable Recommendations
13 2 (0.25%) Cyber Essentials PLUS
13 2 (0.25%) NCSC
13 2 (0.25%) NIST 800
13 2 (0.25%) RMADS
13 2 (0.25%) SOC 2
System Software
1 23 (2.86%) Active Directory
2 14 (1.74%) Hyper-V
3 12 (1.49%) VMware Infrastructure
4 7 (0.87%) Virtual Desktop
5 3 (0.37%) Docker
6 1 (0.12%) FreeRADIUS
6 1 (0.12%) Shibboleth
6 1 (0.12%) Virtual Machines
6 1 (0.12%) VMware NSX
6 1 (0.12%) vSphere
Systems Management
1 16 (1.99%) Terraform
2 11 (1.37%) Ansible
2 11 (1.37%) Single Sign-On
3 9 (1.12%) Microsoft Intune
4 6 (0.75%) Kubernetes
5 4 (0.50%) Packer
5 4 (0.50%) Prometheus
6 2 (0.25%) ZABBIX
7 1 (0.12%) Active Directory Federation Services
7 1 (0.12%) HP UCMDB
7 1 (0.12%) NetBackup
7 1 (0.12%) Progress Chef
7 1 (0.12%) SCCM
Vendors
1 190 (23.63%) Microsoft
2 120 (14.93%) Oracle
3 78 (9.70%) NEC
4 61 (7.59%) SAP
5 48 (5.97%) ServiceNow
6 33 (4.10%) Cisco
7 29 (3.61%) Salesforce
8 28 (3.48%) Fortinet
9 24 (2.99%) Google
10 22 (2.74%) VMware
11 19 (2.36%) Extreme Networks
12 18 (2.24%) Databricks
13 16 (1.99%) CyberArk
13 16 (1.99%) Sony
14 13 (1.62%) IFS
14 13 (1.62%) Salesforce Marketing Cloud
15 12 (1.49%) ForgeRock
15 12 (1.49%) Ping Identity
16 11 (1.37%) Hyperion
16 11 (1.37%) JD Edwards