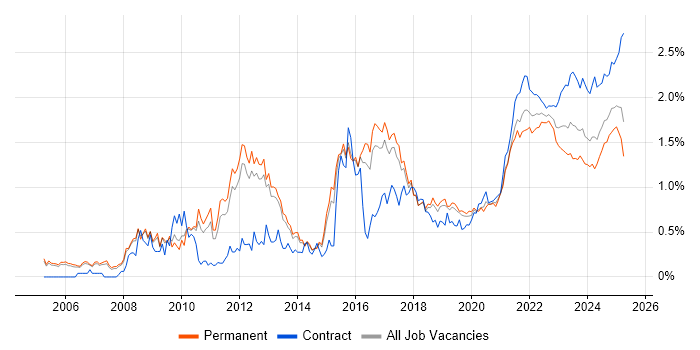
Data Protection Jobs with Hybrid/Remote/WFH Options

Data Protection
UK > Work from Home

The table below provides summary statistics for permanent remote or hybrid work requiring Data Protection skills. It includes a benchmarking guide to the annual salaries offered in vacancies that cited Data Protection over the 6 months leading up to 4 May 2025, comparing them to the same period in the previous two years.

6 months to
4 May 2025
Same period 2024 Same period 2023
Rank 199 242 228
Rank change year-on-year +43 -14 +50
Permanent jobs citing Data Protection 258 436 639
As % of all permanent jobs with a WFH option 1.68% 1.29% 1.50%
As % of the Processes & Methodologies category 1.81% 1.41% 1.56%
Number of salaries quoted 173 367 418
10th Percentile £41,250 £35,631 £41,063
25th Percentile £46,250 £40,000 £46,350
Median annual salary (50th Percentile) £60,000 £54,500 £55,000
Median % change year-on-year +10.09% -0.91% +10.00%
75th Percentile £77,500 £68,750 £72,500
90th Percentile £97,250 £85,500 £85,000
UK median annual salary £60,000 £50,000 £55,398
% change year-on-year +20.00% -9.74% +0.72%

All Process and Methodology Skills
Work from Home

Data Protection falls under the Processes and Methodologies category. For comparison with the information above, the following table provides summary statistics for all permanent job vacancies with remote or hybrid options requiring process or methodology skills.

Permanent vacancies with a requirement for process or methodology skills 14,284 31,001 40,855
As % of all permanent jobs with a WFH option 93.23% 91.62% 96.10%
Number of salaries quoted 9,786 23,546 28,388
10th Percentile £30,000 £33,759 £37,500
25th Percentile £45,000 £42,500 £47,500
Median annual salary (50th Percentile) £60,000 £57,500 £62,500
Median % change year-on-year +4.35% -8.00% +4.17%
75th Percentile £77,500 £75,000 £82,500
90th Percentile £102,500 £95,000 £100,000
UK median annual salary £57,500 £55,000 £61,500
% change year-on-year +4.55% -10.57% +2.50%

Data Protection
Trend for Jobs with a WFH Option

Job vacancies with remote working options citing Data Protection as a proportion of all IT jobs advertised.

Data Protection trend for jobs with Hybrid/Remote/WFH options

Data Protection
Salary Trend for Jobs with a WFH Option

3-month moving average salary quoted in job vacancies with remote working options citing Data Protection.

Data Protection salary trend for jobs with a WFH option

Data Protection
Salary Histogram for Jobs with a WFH Option

Salary distribution for jobs with remote working options citing Data Protection over the 6 months to 4 May 2025.

Data Protection salary histogram for jobs with a WFH option

Data Protection
Co-occurring Skills and Capabilities with WFH Options by Category

The follow tables expand on the table above by listing co-occurrences grouped by category. The same employment type, locality and period is covered with up to 20 co-occurrences shown in each of the following categories:

Application Platforms
1 23 (8.91%) SharePoint
2 13 (5.04%) CMS
3 7 (2.71%) SAS
4 4 (1.55%) Apache
4 4 (1.55%) Drupal
4 4 (1.55%) Microsoft Exchange
5 3 (1.16%) Apache Spark
5 3 (1.16%) nginx
6 2 (0.78%) WordPress
7 1 (0.39%) OpenStack
7 1 (0.39%) Oracle Workflow
7 1 (0.39%) Umbraco
Applications
1 27 (10.47%) Microsoft Office
2 11 (4.26%) Microsoft Excel
3 10 (3.88%) Adobe Premiere
3 10 (3.88%) Photoshop
4 9 (3.49%) Acrobat
5 6 (2.33%) Adobe Illustrator
6 5 (1.94%) Microsoft PowerPoint
7 2 (0.78%) Microsoft Project
7 2 (0.78%) MS Visio
7 2 (0.78%) Trello
8 1 (0.39%) Adobe Creative Suite
8 1 (0.39%) InDesign
8 1 (0.39%) Spreadsheet
Business Applications
1 11 (4.26%) Dynamics CRM
2 3 (1.16%) Raiser’s Edge
3 1 (0.39%) Dynamics GP
3 1 (0.39%) Endur
3 1 (0.39%) ION Anvil
3 1 (0.39%) ION MarketView
3 1 (0.39%) Oracle Assets
3 1 (0.39%) Oracle EBS R12
3 1 (0.39%) Oracle Financials
3 1 (0.39%) Oracle General Ledger
3 1 (0.39%) Oracle Internet Expenses
3 1 (0.39%) Oracle iProcurement
3 1 (0.39%) Oracle Payables
3 1 (0.39%) Oracle Procure-to-Pay
3 1 (0.39%) Oracle Receivables
Cloud Services
1 60 (23.26%) Azure
2 55 (21.32%) Microsoft 365
3 42 (16.28%) AWS
4 30 (11.63%) Power Platform
5 17 (6.59%) Serverless
6 15 (5.81%) Azure DevOps
7 14 (5.43%) AWS Lambda
8 13 (5.04%) AWS CloudFormation
8 13 (5.04%) AWS KMS
9 12 (4.65%) Dynamics 365
9 12 (4.65%) GCP
9 12 (4.65%) SaaS
10 11 (4.26%) Azure Data Factory
11 9 (3.49%) Google Workspace
11 9 (3.49%) PowerApps
12 7 (2.71%) OneDrive
13 6 (2.33%) Entra ID
14 5 (1.94%) Azure Synapse Analytics
14 5 (1.94%) Google Analytics
14 5 (1.94%) Power Automate
Communications & Networking
1 19 (7.36%) Network Security
2 16 (6.20%) Firewall
3 14 (5.43%) LAN
3 14 (5.43%) WAN
4 11 (4.26%) VPN
5 10 (3.88%) Intranet
6 9 (3.49%) DNS
6 9 (3.49%) SD-WAN
7 3 (1.16%) Internet
8 2 (0.78%) Broadband
8 2 (0.78%) VSAN
9 1 (0.39%) DHCP
9 1 (0.39%) Intrusion Detection
9 1 (0.39%) IPv4
9 1 (0.39%) IPv6
9 1 (0.39%) Remote Desktop
9 1 (0.39%) SSH
9 1 (0.39%) TCP/IP
9 1 (0.39%) Unified Communications
9 1 (0.39%) Wi-Fi
Database & Business Intelligence
1 19 (7.36%) Power BI
2 10 (3.88%) NoSQL
3 8 (3.10%) Data Warehouse
4 5 (1.94%) Data Lake
4 5 (1.94%) MySQL
4 5 (1.94%) SQL Server
5 4 (1.55%) SQL Server Integration Services
6 3 (1.16%) Azure SQL Database
6 3 (1.16%) Big Data
6 3 (1.16%) Metadata
6 3 (1.16%) Relational Database
6 3 (1.16%) SQL Server Reporting Services
6 3 (1.16%) Tableau
7 2 (0.78%) Metadata Repository
7 2 (0.78%) MongoDB
7 2 (0.78%) PostgreSQL
7 2 (0.78%) SQL Server Analysis Services
8 1 (0.39%) Elasticsearch
8 1 (0.39%) Hadoop
8 1 (0.39%) Oracle Reports
Development Applications
1 12 (4.65%) JIRA
2 5 (1.94%) Git
3 3 (1.16%) PHPUnit
4 2 (0.78%) Jenkins
4 2 (0.78%) Sonatype Nexus
5 1 (0.39%) Bitbucket
5 1 (0.39%) Cypress.io
5 1 (0.39%) GitLab
5 1 (0.39%) Gradle
5 1 (0.39%) JUnit
5 1 (0.39%) Maven
5 1 (0.39%) Oracle Forms
5 1 (0.39%) Rational Rhapsody
5 1 (0.39%) Selenium
5 1 (0.39%) Spinnaker
5 1 (0.39%) TestNG
General
1 131 (50.78%) Social Skills
2 66 (25.58%) Finance
3 42 (16.28%) Analytical Skills
4 38 (14.73%) Legal
5 25 (9.69%) Inclusion and Diversity
5 25 (9.69%) Marketing
6 23 (8.91%) Law
7 22 (8.53%) Retail
8 15 (5.81%) Banking
9 11 (4.26%) Organisational Skills
9 11 (4.26%) Public Sector
10 6 (2.33%) Manufacturing
11 5 (1.94%) Documentation Skills
11 5 (1.94%) German Language
11 5 (1.94%) Local Government
12 4 (1.55%) Advertising
13 3 (1.16%) Back Office
13 3 (1.16%) Influencing Skills
14 2 (0.78%) Front Office
14 2 (0.78%) Presentation Skills
Job Titles
1 31 (12.02%) Architect
2 25 (9.69%) Analyst
2 25 (9.69%) Senior
3 24 (9.30%) Lead
4 19 (7.36%) Developer
5 17 (6.59%) AWS Architect
6 15 (5.81%) Infrastructure Engineer
7 14 (5.43%) Cloud Architect
8 13 (5.04%) Support Engineer
9 12 (4.65%) Security Manager
10 11 (4.26%) Solutions Architect
11 10 (3.88%) Business Analyst
11 10 (3.88%) Information Manager
11 10 (3.88%) IT Manager
11 10 (3.88%) IT Support
12 9 (3.49%) Compliance Advisor
12 9 (3.49%) Security Advisor
12 9 (3.49%) Technical Analyst
12 9 (3.49%) Technical Business Analyst
13 8 (3.10%) Security Engineer
Libraries, Frameworks & Software Standards
1 17 (6.59%) React
2 15 (5.81%) Kafka
3 13 (5.04%) Elastic Stack
4 11 (4.26%) Node.js
5 10 (3.88%) CSS
5 10 (3.88%) HTML
6 8 (3.10%) .NET
6 8 (3.10%) REST
7 7 (2.71%) Web Services
8 4 (1.55%) Laravel
8 4 (1.55%) RESTful
8 4 (1.55%) Ruby on Rails
8 4 (1.55%) Saxon XSLT
9 3 (1.16%) .NET Framework
9 3 (1.16%) ASP.NET Web API
9 3 (1.16%) Entity Framework
9 3 (1.16%) Jest
9 3 (1.16%) jQuery
9 3 (1.16%) LAMP
9 3 (1.16%) LINQ
Miscellaneous
1 63 (24.42%) Data Protection Act
2 35 (13.57%) Management Information System
3 21 (8.14%) Product Ownership
4 13 (5.04%) e-Learning
5 10 (3.88%) Analytical Mindset
5 10 (3.88%) Distributed Systems
5 10 (3.88%) Onboarding
6 9 (3.49%) Data Centre
7 8 (3.10%) Cloud Native
7 8 (3.10%) Credit Risk
7 8 (3.10%) Market Risk
7 8 (3.10%) Social Media
8 7 (2.71%) Cyber Threat
8 7 (2.71%) Freedom of Information
9 6 (2.33%) Blog
9 6 (2.33%) Data Structures
10 5 (1.94%) Distributed Architecture
10 5 (1.94%) Freedom of Information Act
10 5 (1.94%) NHS
11 4 (1.55%) Legacy Systems
Operating Systems
1 20 (7.75%) Windows
2 9 (3.49%) Linux
3 8 (3.10%) Windows Server
4 2 (0.78%) Red Hat Enterprise Linux
4 2 (0.78%) Windows Vista
5 1 (0.39%) Android
5 1 (0.39%) Apple iOS
5 1 (0.39%) Unix
5 1 (0.39%) Windows 10
Processes & Methodologies
1 74 (28.68%) Problem-Solving
2 51 (19.77%) Continuous Improvement
3 50 (19.38%) Cybersecurity
4 48 (18.60%) DevOps
5 44 (17.05%) Information Security
5 44 (17.05%) Risk Management
6 38 (14.73%) Analytics
7 35 (13.57%) CI/CD
7 35 (13.57%) Project Management
8 31 (12.02%) Regulatory Compliance
9 29 (11.24%) Computer Science
10 27 (10.47%) Agile
10 27 (10.47%) Data Management
11 26 (10.08%) Containerisation
11 26 (10.08%) High Availability
11 26 (10.08%) Incident Response
11 26 (10.08%) Microservices
12 25 (9.69%) Collaborative Working
12 25 (9.69%) Stakeholder Management
13 24 (9.30%) Mentoring
Programming Languages
1 39 (15.12%) SQL
2 23 (8.91%) Python
3 21 (8.14%) JavaScript
4 19 (7.36%) Java
5 14 (5.43%) C#
6 11 (4.26%) PowerShell
7 8 (3.10%) PHP
8 7 (2.71%) R
9 4 (1.55%) Ruby
10 3 (1.16%) Bash
11 2 (0.78%) C++
11 2 (0.78%) Data Analysis Expressions
11 2 (0.78%) T-SQL
11 2 (0.78%) TypeScript
12 1 (0.39%) Go
12 1 (0.39%) Kotlin
12 1 (0.39%) Objective-C
12 1 (0.39%) PL/SQL
12 1 (0.39%) Scala
12 1 (0.39%) Swift
Qualifications
1 50 (19.38%) Degree
2 22 (8.53%) Computer Science Degree
3 20 (7.75%) SC Cleared
3 20 (7.75%) Security Cleared
4 17 (6.59%) AWS Certification
5 16 (6.20%) CISSP
6 15 (5.81%) Microsoft Certification
7 14 (5.43%) AWS Certified Solutions Architect
8 9 (3.49%) Azure Certification
9 7 (2.71%) DBS Check
10 6 (2.33%) CISM
11 5 (1.94%) CEH
11 5 (1.94%) SANS
12 4 (1.55%) ISEB
12 4 (1.55%) ISO 27001 Lead Auditor
13 3 (1.16%) Cisco Certification
13 3 (1.16%) ISSAP
13 3 (1.16%) ITIL Certification
13 3 (1.16%) PMI Certification
13 3 (1.16%) PMP
Quality Assurance & Compliance
1 78 (30.23%) GDPR
2 31 (12.02%) ISO/IEC 27001
3 21 (8.14%) Data Quality
4 20 (7.75%) PCI DSS
5 18 (6.98%) Cyber Essentials
6 15 (5.81%) HIPAA
7 10 (3.88%) NIST
7 10 (3.88%) QA
8 9 (3.49%) PERC
9 8 (3.10%) Basel III
9 8 (3.10%) IFRS
9 8 (3.10%) IFRS 9
10 7 (2.71%) Basel II
10 7 (2.71%) COBIT
10 7 (2.71%) Dodd-Frank
11 6 (2.33%) ISO 9001
12 5 (1.94%) Accessibility
12 5 (1.94%) SLA
12 5 (1.94%) SOC 2
13 4 (1.55%) NCSC
System Software
1 17 (6.59%) Docker
2 15 (5.81%) Active Directory
3 9 (3.49%) Virtual Desktop
3 9 (3.49%) VMware Infrastructure
4 3 (1.16%) Hyper-V
4 3 (1.16%) Squid
4 3 (1.16%) Virtual Machines
4 3 (1.16%) VMware ESXi
5 2 (0.78%) EMC RecoverPoint
5 2 (0.78%) Firmware
5 2 (0.78%) VMware NSX
5 2 (0.78%) vSphere
6 1 (0.39%) pfSense
Systems Management
1 18 (6.98%) Terraform
2 17 (6.59%) Kubernetes
3 15 (5.81%) Microsoft Intune
4 14 (5.43%) Grafana
4 14 (5.43%) Prometheus
5 6 (2.33%) SCCM
6 4 (1.55%) Single Sign-On
7 3 (1.16%) HAProxy
7 3 (1.16%) Jamf Pro
8 2 (0.78%) Ansible
8 2 (0.78%) Avamar
8 2 (0.78%) Dell DRAC
8 2 (0.78%) Failover Clustering
8 2 (0.78%) NetBackup
8 2 (0.78%) vCenter Server
8 2 (0.78%) vRealize
8 2 (0.78%) VxRail
8 2 (0.78%) WSUS
9 1 (0.39%) Control-M
9 1 (0.39%) Tivoli Storage Manager
Vendors
1 84 (32.56%) Microsoft
2 15 (5.81%) Google
3 14 (5.43%) Adobe
4 13 (5.04%) OneTrust
5 12 (4.65%) Citrix
6 11 (4.26%) VMware
7 5 (1.94%) Salesforce
7 5 (1.94%) Veeam
8 4 (1.55%) Dell
9 3 (1.16%) Databricks
9 3 (1.16%) EMC
9 3 (1.16%) HP
9 3 (1.16%) SolarWinds
10 2 (0.78%) Cisco
10 2 (0.78%) Isilon
10 2 (0.78%) McAfee
10 2 (0.78%) Oracle
10 2 (0.78%) Red Hat
10 2 (0.78%) Sage
10 2 (0.78%) Splunk