Data Protection Contracts with Hybrid/Remote/WFH Options

Data Protection
UK > Work from Home

The table below provides summary statistics for remote or hybrid contract work requiring Data Protection skills. It includes a benchmarking guide to the contractor rates offered in vacancies that cited Data Protection over the 6 months leading up to 4 July 2025, comparing them to the same period in the previous two years.

6 months to
4 Jul 2025
Same period 2024 Same period 2023
Rank 95 112 115
Rank change year-on-year +17 +3 +10
Contract jobs citing Data Protection 261 288 508
As % of all contract jobs with a WFH option 2.58% 1.97% 2.12%
As % of the Processes & Methodologies category 2.81% 2.26% 2.36%
Number of daily rates quoted 124 148 316
10th Percentile £289 £261 £313
25th Percentile £325 £372 £413
Median daily rate (50th Percentile) £469 £493 £525
Median % change year-on-year -4.92% -6.10% -1.87%
75th Percentile £595 £588 £631
90th Percentile £684 £704 £748
UK median daily rate £475 £500 £525
% change year-on-year -5.00% -4.76% -3.23%
Number of hourly rates quoted 11 14 11
10th Percentile - £15.88 £20.50
25th Percentile £14.78 £19.25 £25.63
Median hourly rate £27.50 £19.50 £52.50
Median % change year-on-year +41.03% -62.86% +116.58%
75th Percentile £32.13 £27.50 £59.88
90th Percentile £33.40 £38.98 £66.00
UK median hourly rate £23.00 £19.50 £36.27
% change year-on-year +17.95% -46.24% +81.35%

All Process and Methodology Skills
Work from Home

Data Protection falls under the Processes and Methodologies category. For comparison with the information above, the following table provides summary statistics for all contract job vacancies with remote or hybrid options requiring process or methodology skills.

Contract vacancies with a requirement for process or methodology skills 9,291 12,763 21,492
As % of all contract jobs with a WFH option 91.77% 87.18% 89.58%
Number of daily rates quoted 6,296 8,590 15,171
10th Percentile £325 £325 £358
25th Percentile £413 £425 £450
Median daily rate (50th Percentile) £513 £525 £540
Median % change year-on-year -2.38% -2.78% +0.93%
75th Percentile £638 £638 £650
90th Percentile £760 £750 £750
UK median daily rate £505 £525 £550
% change year-on-year -3.81% -4.55% +1.38%
Number of hourly rates quoted 261 552 514
10th Percentile £13.00 £15.17 £17.80
25th Percentile £19.00 £25.50 £25.95
Median hourly rate £34.65 £43.00 £52.50
Median % change year-on-year -19.42% -18.10% +31.25%
75th Percentile £65.00 £60.76 £67.50
90th Percentile £75.00 £75.00 £79.19
UK median hourly rate £25.15 £37.50 £37.42
% change year-on-year -32.93% +0.21% +43.92%

Data Protection
Trend for Jobs with a WFH Option

Job vacancies with remote working options citing Data Protection as a proportion of all IT jobs advertised.
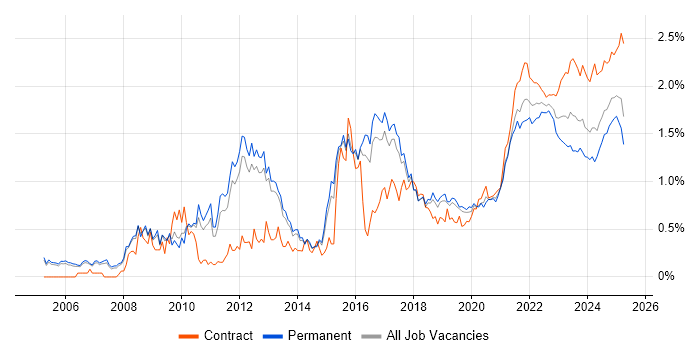
Data Protection trend for jobs with Hybrid/Remote/WFH options

Data Protection
Daily Rate Trend for Jobs with a WFH Option

3-month moving average daily rate quoted in job vacancies with remote working options citing Data Protection.

Data Protection daily rate for jobs with a WFH option

Data Protection
Daily Rate Histogram for Jobs with a WFH Option

Daily rate distribution for jobs with remote working options citing Data Protection over the 6 months to 4 July 2025.

Data Protection daily rate histogram for jobs with a WFH option

Data Protection
Hourly Rate Trend for Jobs with a WFH Option

3-month moving average hourly rate quoted in job vacancies with remote working options citing Data Protection.

Data Protection hourly rate for jobs with a WFH option

Data Protection
Hourly Rate Histogram for Jobs with a WFH Option

Hourly rate distribution for jobs with remote working options citing Data Protection over the 6 months to 4 July 2025.

Data Protection hourly rate histogram for jobs with a WFH option

Data Protection
Co-occurring Skills and Capabilities with WFH Options by Category

The follow tables expand on the table above by listing co-occurrences grouped by category. The same employment type, locality and period is covered with up to 20 co-occurrences shown in each of the following categories:

Application Platforms
1 11 (4.21%) SharePoint
2 6 (2.30%) CMS
2 6 (2.30%) Confluence
3 3 (1.15%) Microsoft Exchange
4 2 (0.77%) Anypoint
4 2 (0.77%) Apache Airflow
4 2 (0.77%) JBoss
4 2 (0.77%) OpenEdge
4 2 (0.77%) SAS
4 2 (0.77%) WebSphere
4 2 (0.77%) WebSphere Application Server
5 1 (0.38%) Apache Spark
5 1 (0.38%) BizTalk Server
5 1 (0.38%) OpenStack
Applications
1 7 (2.68%) Microsoft Excel
2 5 (1.92%) Microsoft Office
3 4 (1.53%) Microsoft PowerPoint
4 3 (1.15%) Chatbot
5 2 (0.77%) Spreadsheet
5 2 (0.77%) Trello
6 1 (0.38%) MadCap Flare
Business Applications
1 1 (0.38%) Aladdin
1 1 (0.38%) BASE24
1 1 (0.38%) Dynamics CRM
1 1 (0.38%) Oracle ERP
Cloud Services
1 57 (21.84%) AWS
2 53 (20.31%) Azure
3 22 (8.43%) GCP
4 17 (6.51%) Microsoft 365
5 13 (4.98%) SaaS
6 12 (4.60%) GitHub
7 10 (3.83%) Entra ID
8 8 (3.07%) Amazon S3
8 8 (3.07%) Cloud Computing
8 8 (3.07%) Serverless
9 7 (2.68%) PaaS
10 6 (2.30%) Amazon EC2
10 6 (2.30%) Azure DevOps
10 6 (2.30%) IaaS
11 5 (1.92%) AWS CloudFormation
11 5 (1.92%) Azure AKS
11 5 (1.92%) Azure Logic Apps
11 5 (1.92%) OneDrive
11 5 (1.92%) Power Platform
12 4 (1.53%) SuccessFactors
Communications & Networking
1 16 (6.13%) Firewall
2 6 (2.30%) VPN
3 5 (1.92%) Network Security
3 5 (1.92%) SD-WAN
3 5 (1.92%) WAN
4 4 (1.53%) DNS
4 4 (1.53%) SSL
5 2 (0.77%) BGP
5 2 (0.77%) Cisco Nexus
5 2 (0.77%) DHCP
5 2 (0.77%) DMARC
5 2 (0.77%) HTTPS
5 2 (0.77%) LAN
5 2 (0.77%) NAS
5 2 (0.77%) SAN
5 2 (0.77%) SMTP
5 2 (0.77%) SSH
5 2 (0.77%) Unified Communications
5 2 (0.77%) Wireless
5 2 (0.77%) X.509
Database & Business Intelligence
1 7 (2.68%) SQL Server
2 5 (1.92%) Oracle Database
3 4 (1.53%) Azure SQL Database
3 4 (1.53%) Data Warehouse
3 4 (1.53%) Power BI
4 3 (1.15%) Data Lake
4 3 (1.15%) DynamoDB
4 3 (1.15%) RDBMS
4 3 (1.15%) Relational Database
4 3 (1.15%) Tableau
5 2 (0.77%) Big Data
5 2 (0.77%) Data Hub
5 2 (0.77%) DB2
5 2 (0.77%) IMS/DB
5 2 (0.77%) SQL Server Reporting Services
6 1 (0.38%) NonStop SQL
6 1 (0.38%) Oracle Database 11g
6 1 (0.38%) SQL Server Analysis Services
6 1 (0.38%) SQL Server Integration Services
6 1 (0.38%) Sybase ASE
Development Applications
1 12 (4.60%) JIRA
2 10 (3.83%) Git
3 8 (3.07%) Jenkins
4 5 (1.92%) Postman
5 4 (1.53%) GitLab
6 3 (1.15%) Burp Suite
6 3 (1.15%) Metasploit
6 3 (1.15%) Snyk
6 3 (1.15%) SonarQube
7 2 (0.77%) Maven
7 2 (0.77%) TeamCity
8 1 (0.38%) Bitbucket
8 1 (0.38%) Cucumber
8 1 (0.38%) Cypress.io
8 1 (0.38%) Gatling
8 1 (0.38%) MSI
8 1 (0.38%) Octopus Deploy
8 1 (0.38%) Selenium
8 1 (0.38%) SpecFlow
8 1 (0.38%) Terragrunt
General
1 85 (32.57%) Social Skills
2 64 (24.52%) Finance
3 35 (13.41%) Analytical Skills
4 18 (6.90%) Public Sector
5 16 (6.13%) Banking
6 12 (4.60%) Law
7 11 (4.21%) Legal
8 9 (3.45%) Inclusion and Diversity
8 9 (3.45%) Marketing
9 7 (2.68%) Organisational Skills
10 6 (2.30%) Advertising
10 6 (2.30%) Aerospace
11 4 (1.53%) Front Office
11 4 (1.53%) Police
11 4 (1.53%) Presentation Skills
12 3 (1.15%) Aviation
12 3 (1.15%) Back Office
12 3 (1.15%) Local Government
12 3 (1.15%) Retail
12 3 (1.15%) Telecoms
Job Titles
1 35 (13.41%) Architect
2 25 (9.58%) Analyst
3 22 (8.43%) Senior
4 18 (6.90%) Consultant
5 16 (6.13%) Project Manager
6 12 (4.60%) Security Engineer
7 11 (4.21%) Developer
8 9 (3.45%) Data Engineer
8 9 (3.45%) Lead
9 8 (3.07%) Security Architect
9 8 (3.07%) Site Engineer
9 8 (3.07%) Site Reliability Engineer
9 8 (3.07%) Support Engineer
10 7 (2.68%) Infrastructure Engineer
10 7 (2.68%) IT Manager
11 6 (2.30%) Campaign Manager
11 6 (2.30%) Cloud Architect
11 6 (2.30%) Data Analyst
11 6 (2.30%) Risk Analyst
11 6 (2.30%) Security Manager
Libraries, Frameworks & Software Standards
1 8 (3.07%) XML
2 7 (2.68%) React
2 7 (2.68%) RESTful
3 6 (2.30%) REST
3 6 (2.30%) SOAP
4 5 (1.92%) Kafka
5 4 (1.53%) ARM Templates
5 4 (1.53%) JSON
5 4 (1.53%) Middleware
5 4 (1.53%) Spring
6 3 (1.15%) Azure Blueprints
6 3 (1.15%) GraphQL
6 3 (1.15%) LDAP
7 2 (0.77%) .NET
7 2 (0.77%) EJB
7 2 (0.77%) J2EE
7 2 (0.77%) PyTorch
7 2 (0.77%) Web Services
7 2 (0.77%) WebSphere MQ
7 2 (0.77%) XSLT
Miscellaneous
1 134 (51.34%) Data Protection Act
2 14 (5.36%) Data Centre
3 13 (4.98%) Hybrid Cloud
4 11 (4.21%) Management Information System
5 9 (3.45%) Onboarding
6 8 (3.07%) Linux Command Line
7 6 (2.30%) Distributed Systems
7 6 (2.30%) Freedom of Information
7 6 (2.30%) Replication
8 5 (1.92%) Cloud Native
8 5 (1.92%) Legacy Applications
8 5 (1.92%) Virtual Team
9 4 (1.53%) Algorithms
9 4 (1.53%) Legacy Systems
9 4 (1.53%) Self-Motivation
9 4 (1.53%) SWIFT Messaging Network
10 3 (1.15%) Clustering
10 3 (1.15%) Legacy Code
10 3 (1.15%) Reinsurance
11 2 (0.77%) Analytical Mindset
Operating Systems
1 28 (10.73%) Linux
2 19 (7.28%) Windows
3 8 (3.07%) Windows Server
4 7 (2.68%) Unix
5 5 (1.92%) Red Hat Enterprise Linux
6 1 (0.38%) AIX
6 1 (0.38%) Android
6 1 (0.38%) Mac OS
6 1 (0.38%) Oracle Linux
6 1 (0.38%) Solaris
6 1 (0.38%) Ubuntu
6 1 (0.38%) Windows 10
6 1 (0.38%) Windows 7
6 1 (0.38%) Windows Server 2016
6 1 (0.38%) Windows Server 2019
6 1 (0.38%) zOS
Processes & Methodologies
1 60 (22.99%) Problem-Solving
2 40 (15.33%) Agile
3 36 (13.79%) Project Management
4 34 (13.03%) CI/CD
5 33 (12.64%) Stakeholder Management
6 30 (11.49%) Migration
7 29 (11.11%) DevOps
8 25 (9.58%) Cybersecurity
9 22 (8.43%) Computer Science
10 20 (7.66%) Cloud Security
10 20 (7.66%) Infrastructure as Code
11 19 (7.28%) Information Security
12 18 (6.90%) Roadmaps
13 17 (6.51%) Machine Learning
14 16 (6.13%) Artificial Intelligence
14 16 (6.13%) Continuous Improvement
15 15 (5.75%) Mentoring
16 14 (5.36%) Microservices
16 14 (5.36%) Performance Tuning
17 13 (4.98%) Stakeholder Engagement
Programming Languages
1 42 (16.09%) Python
2 33 (12.64%) SQL
3 15 (5.75%) PowerShell
4 14 (5.36%) Java
5 13 (4.98%) Bash
6 9 (3.45%) JavaScript
7 6 (2.30%) Go
7 6 (2.30%) Perl
8 5 (1.92%) TypeScript
9 4 (1.53%) Bicep
9 4 (1.53%) PHP
9 4 (1.53%) Shell Script
10 3 (1.15%) PL/SQL
11 2 (0.77%) ActionScript
11 2 (0.77%) ActionScript 2.0
11 2 (0.77%) C
11 2 (0.77%) C#
11 2 (0.77%) C++
11 2 (0.77%) R
11 2 (0.77%) REXX
Qualifications
1 32 (12.26%) Degree
2 26 (9.96%) Security Cleared
3 20 (7.66%) Computer Science Degree
3 20 (7.66%) SC Cleared
4 9 (3.45%) AWS Certification
4 9 (3.45%) CISSP
5 7 (2.68%) CISM
6 5 (1.92%) Cisco Certification
6 5 (1.92%) ISTQB
6 5 (1.92%) OSCP
7 4 (1.53%) CCNP
7 4 (1.53%) ISEB
8 3 (1.15%) BPSS Clearance
8 3 (1.15%) CEH
8 3 (1.15%) CHECK Team Member
8 3 (1.15%) CREST Certified
8 3 (1.15%) DBS Check
8 3 (1.15%) Tigerscheme
9 2 (0.77%) SANS
9 2 (0.77%) TOGAF Certification
Quality Assurance & Compliance
1 31 (11.88%) GDPR
2 16 (6.13%) NIST
3 9 (3.45%) ISO/IEC 27001
4 7 (2.68%) Data Quality
4 7 (2.68%) GRC
4 7 (2.68%) PMO
5 5 (1.92%) Accessibility
5 5 (1.92%) Cyber Essentials
5 5 (1.92%) QA
5 5 (1.92%) SOC 2
6 4 (1.53%) Cyber Essentials PLUS
6 4 (1.53%) SEPA
7 3 (1.15%) NCSC
7 3 (1.15%) PCI DSS
7 3 (1.15%) Sarbanes-Oxley
8 2 (0.77%) Actionable Recommendations
8 2 (0.77%) California Consumer Privacy Act
8 2 (0.77%) EU AI Act
8 2 (0.77%) FIPS 140-2
8 2 (0.77%) NIST 800
System Software
1 15 (5.75%) Active Directory
2 13 (4.98%) VMware Infrastructure
3 8 (3.07%) Docker
4 7 (2.68%) Virtual Machines
5 2 (0.77%) Virtual Servers
6 1 (0.38%) BitLocker
6 1 (0.38%) Oracle RAC
6 1 (0.38%) Veritas Cluster Server
6 1 (0.38%) VMware ESXi
Systems Management
1 17 (6.51%) Kubernetes
2 15 (5.75%) Terraform
3 7 (2.68%) Ansible
4 6 (2.30%) Grafana
4 6 (2.30%) Prometheus
5 5 (1.92%) NetBackup
6 4 (1.53%) Oracle RMAN
7 3 (1.15%) Microsoft Intune
7 3 (1.15%) Nmap
8 2 (0.77%) EMC NetWorker
9 1 (0.38%) Avamar
9 1 (0.38%) Data Guard
9 1 (0.38%) FortiGate
9 1 (0.38%) Netcool
9 1 (0.38%) Puppet
9 1 (0.38%) SCCM
9 1 (0.38%) Single Sign-On
9 1 (0.38%) Tivoli
9 1 (0.38%) Tivoli Storage Manager
Vendors
1 34 (13.03%) Microsoft
2 15 (5.75%) Oracle
3 13 (4.98%) Cisco
3 13 (4.98%) VMware
4 10 (3.83%) Google
5 8 (3.07%) Splunk
6 6 (2.30%) Commvault
6 6 (2.30%) IBM
7 5 (1.92%) CyberArk
7 5 (1.92%) Red Hat
8 4 (1.53%) Fortinet
8 4 (1.53%) HP
8 4 (1.53%) MuleSoft
8 4 (1.53%) SAP
8 4 (1.53%) ServiceNow
8 4 (1.53%) Veeam
8 4 (1.53%) Veritas
9 3 (1.15%) Dell
9 3 (1.15%) Murex
9 3 (1.15%) Sybase