Knowledge Transfer Contracts with Hybrid/Remote/WFH Options

Knowledge Transfer
UK > Work from Home

The table below provides summary statistics for remote or hybrid contract work requiring Knowledge Transfer skills. It includes a benchmarking guide to the contractor rates offered in vacancies that cited Knowledge Transfer over the 6 months leading up to 3 May 2025, comparing them to the same period in the previous two years.

6 months to
3 May 2025
Same period 2024 Same period 2023
Rank 192 219 240
Rank change year-on-year +27 +21 +97
Contract jobs citing Knowledge Transfer 109 127 252
As % of all contract jobs with a WFH option 1.10% 0.83% 0.98%
As % of the Processes & Methodologies category 1.21% 0.95% 1.09%
Number of daily rates quoted 54 90 181
10th Percentile £374 £375 £400
25th Percentile £452 £450 £456
Median daily rate (50th Percentile) £550 £500 £540
Median % change year-on-year +10.00% -7.41% +8.00%
75th Percentile £640 £597 £675
90th Percentile £757 £738 £745
UK median daily rate £550 £525 £530
% change year-on-year +4.76% -0.94% +6.00%
Number of hourly rates quoted 0 5 0
Median hourly rate - £50.00 -
UK median hourly rate £37.04 £50.00 £17.00
% change year-on-year -25.93% +194.12% +7.59%

All Process and Methodology Skills
Work from Home

Knowledge Transfer falls under the Processes and Methodologies category. For comparison with the information above, the following table provides summary statistics for all contract job vacancies with remote or hybrid options requiring process or methodology skills.

Contract vacancies with a requirement for process or methodology skills 9,020 13,413 23,039
As % of all contract jobs with a WFH option 91.13% 87.92% 89.76%
Number of daily rates quoted 6,197 8,959 16,290
10th Percentile £340 £325 £363
25th Percentile £419 £425 £450
Median daily rate (50th Percentile) £525 £525 £540
Median % change year-on-year - -2.78% +2.86%
75th Percentile £638 £638 £650
90th Percentile £763 £750 £750
UK median daily rate £520 £525 £550
% change year-on-year -0.95% -4.55% +4.17%
Number of hourly rates quoted 221 580 529
10th Percentile £14.20 £15.17 £19.00
25th Percentile £19.75 £25.38 £30.54
Median hourly rate £39.00 £43.00 £55.00
Median % change year-on-year -9.30% -21.82% +57.14%
75th Percentile £66.50 £60.00 £68.75
90th Percentile £75.00 £75.25 £80.00
UK median hourly rate £29.00 £35.58 £36.00
% change year-on-year -18.48% -1.18% +44.00%

Knowledge Transfer
Trend for Jobs with a WFH Option

Job vacancies with remote working options citing Knowledge Transfer as a proportion of all IT jobs advertised.
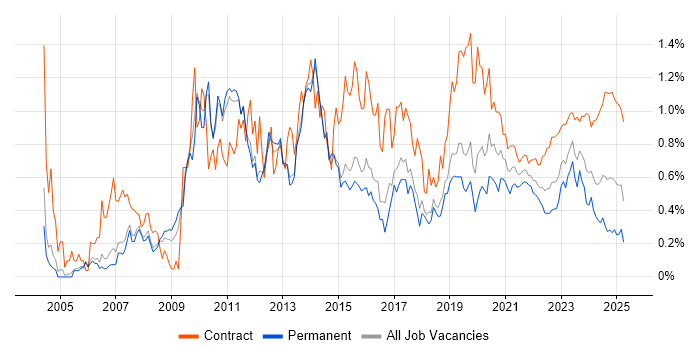
Knowledge Transfer trend for jobs with Hybrid/Remote/WFH options

Knowledge Transfer
Daily Rate Trend for Jobs with a WFH Option

3-month moving average daily rate quoted in job vacancies with remote working options citing Knowledge Transfer.

Knowledge Transfer daily rate for jobs with a WFH option

Knowledge Transfer
Daily Rate Histogram for Jobs with a WFH Option

Daily rate distribution for jobs with remote working options citing Knowledge Transfer over the 6 months to 3 May 2025.

Knowledge Transfer daily rate histogram for jobs with a WFH option

Knowledge Transfer
Hourly Rate Trend for Jobs with a WFH Option

3-month moving average hourly rate quoted in job vacancies with remote working options citing Knowledge Transfer.

Knowledge Transfer hourly rate for jobs with a WFH option

Knowledge Transfer
Co-occurring Skills and Capabilities with WFH Options by Category

The follow tables expand on the table above by listing co-occurrences grouped by category. The same employment type, locality and period is covered with up to 20 co-occurrences shown in each of the following categories:

Application Platforms
1 3 (2.75%) PowerExchange
2 2 (1.83%) Anypoint
2 2 (1.83%) SharePoint
3 1 (0.92%) ArcGIS
3 1 (0.92%) Microsoft Exchange
3 1 (0.92%) nginx
3 1 (0.92%) Tomcat
Business Applications
1 4 (3.67%) SAP IBP
2 3 (2.75%) Oracle EBS
3 2 (1.83%) Dynamics CRM
3 2 (1.83%) SAP S/4HANA
4 1 (0.92%) Dynamics AX
4 1 (0.92%) Kondor
4 1 (0.92%) NetSuite
4 1 (0.92%) Oracle Financials
4 1 (0.92%) Oracle Payroll
4 1 (0.92%) Oracle Procure-to-Pay
4 1 (0.92%) Primavera
4 1 (0.92%) Remedy ITSM
4 1 (0.92%) SAP APO
4 1 (0.92%) SAP CAR
4 1 (0.92%) SAP ERP
4 1 (0.92%) SAP EWM
4 1 (0.92%) SAP GRC
4 1 (0.92%) SAP Retail
4 1 (0.92%) UltiPro
4 1 (0.92%) Workday HCM
Cloud Services
1 18 (16.51%) Azure
2 9 (8.26%) AWS
3 6 (5.50%) Dynamics 365
4 5 (4.59%) Azure DevOps
4 5 (4.59%) Microsoft 365
4 5 (4.59%) OCI
4 5 (4.59%) Power Platform
5 4 (3.67%) GCP
5 4 (3.67%) PowerApps
6 2 (1.83%) Azure Synapse Analytics
6 2 (1.83%) Power Automate
6 2 (1.83%) Rubrik
6 2 (1.83%) SaaS
6 2 (1.83%) SuccessFactors
6 2 (1.83%) WhatsApp
7 1 (0.92%) Amazon EventBridge
7 1 (0.92%) Azure Logic Apps
7 1 (0.92%) Azure Sentinel
7 1 (0.92%) GitHub Actions
7 1 (0.92%) Nutanix
Communications & Networking
1 6 (5.50%) Firewall
2 3 (2.75%) Cisco Nexus
3 2 (1.83%) BGP
3 2 (1.83%) Ethernet VPN
3 2 (1.83%) HTTPS
3 2 (1.83%) Internet
3 2 (1.83%) LAN
3 2 (1.83%) Network Security
3 2 (1.83%) SSH
3 2 (1.83%) SSL
3 2 (1.83%) VXLAN
3 2 (1.83%) WAN
4 1 (0.92%) Cisco IOS
4 1 (0.92%) DHCP
4 1 (0.92%) DNS
4 1 (0.92%) Ethernet
4 1 (0.92%) NGFW
4 1 (0.92%) SAN
4 1 (0.92%) VPN
4 1 (0.92%) Wireshark
Database & Business Intelligence
1 3 (2.75%) KDB
1 3 (2.75%) Kdb+
1 3 (2.75%) MySQL
1 3 (2.75%) Oracle Database
1 3 (2.75%) Oracle Reports
1 3 (2.75%) Power BI
2 2 (1.83%) SQL Server
3 1 (0.92%) Amazon Athena
3 1 (0.92%) Amazon RDS
3 1 (0.92%) Azure SQL Database
3 1 (0.92%) Geospatial Data
3 1 (0.92%) GIS
3 1 (0.92%) MariaDB
3 1 (0.92%) PostgreSQL
3 1 (0.92%) Relational Database
3 1 (0.92%) SAP HANA
Development Applications
1 2 (1.83%) JIRA
1 2 (1.83%) Postman
2 1 (0.92%) Git
2 1 (0.92%) Oracle Forms
2 1 (0.92%) TestRail
General
1 32 (29.36%) Social Skills
2 22 (20.18%) Finance
3 21 (19.27%) Analytical Skills
4 17 (15.60%) Public Sector
5 7 (6.42%) Retail
6 4 (3.67%) Banking
6 4 (3.67%) Manufacturing
6 4 (3.67%) Pharmaceutical
6 4 (3.67%) Presentation Skills
7 2 (1.83%) Documentation Skills
7 2 (1.83%) General Ledger
7 2 (1.83%) Law
7 2 (1.83%) Local Government
7 2 (1.83%) Telecoms
8 1 (0.92%) Automotive
8 1 (0.92%) Bulgarian Language
8 1 (0.92%) Corporate Banking
8 1 (0.92%) Legal
8 1 (0.92%) Marketing
8 1 (0.92%) Retail Banking
Job Titles
1 31 (28.44%) Consultant
2 14 (12.84%) Senior
3 12 (11.01%) Developer
4 7 (6.42%) Lead
5 6 (5.50%) Build Engineer
5 6 (5.50%) Data Engineer
5 6 (5.50%) Platform Engineer
5 6 (5.50%) Senior Platform Engineer
5 6 (5.50%) Senior Technical Engineer
5 6 (5.50%) Technical Engineer
6 5 (4.59%) Migration Engineer
6 5 (4.59%) Oracle Consultant
7 4 (3.67%) Architect
7 4 (3.67%) Data Migration Engineer
7 4 (3.67%) SAP Consultant
7 4 (3.67%) Senior Build Engineer
8 3 (2.75%) Analyst
8 3 (2.75%) Analytics Developer
8 3 (2.75%) Dynamics 365 Consultant
8 3 (2.75%) KDB Developer
Libraries, Frameworks & Software Standards
1 6 (5.50%) Oracle Fusion
2 4 (3.67%) Spring
2 4 (3.67%) Spring Boot
3 3 (2.75%) Node.js
4 2 (1.83%) .NET
4 2 (1.83%) OAuth
4 2 (1.83%) OAuth2
4 2 (1.83%) SAML
5 1 (0.92%) CSS
5 1 (0.92%) EDI
5 1 (0.92%) GraphQL
5 1 (0.92%) HTML
5 1 (0.92%) PySpark
5 1 (0.92%) React
5 1 (0.92%) REST
5 1 (0.92%) SailPoint
5 1 (0.92%) SAP Fiori
5 1 (0.92%) SOAP
5 1 (0.92%) Web Services
5 1 (0.92%) XML
Miscellaneous
1 10 (9.17%) Private Cloud
2 7 (6.42%) Legacy Systems
2 7 (6.42%) Onboarding
3 5 (4.59%) Product Ownership
3 5 (4.59%) Virtual Team
4 4 (3.67%) Data Centre
4 4 (3.67%) Public Cloud
5 3 (2.75%) Equities
5 3 (2.75%) Management Information System
6 2 (1.83%) Data Protection Act
6 2 (1.83%) FMCG
6 2 (1.83%) Legacy Applications
6 2 (1.83%) Wiki
7 1 (0.92%) Augmented Reality
7 1 (0.92%) Cloud Native
7 1 (0.92%) Cyberattack
7 1 (0.92%) Derivative
7 1 (0.92%) Hybrid Cloud
7 1 (0.92%) Life Science
7 1 (0.92%) Replication
Operating Systems
1 9 (8.26%) Windows
2 5 (4.59%) Linux
3 3 (2.75%) Unix
4 2 (1.83%) Android
4 2 (1.83%) Apple iOS
4 2 (1.83%) Mac OS
5 1 (0.92%) Data ONTAP
5 1 (0.92%) Red Hat Enterprise Linux
5 1 (0.92%) Windows Server
Processes & Methodologies
1 35 (32.11%) Migration
2 28 (25.69%) Problem-Solving
3 15 (13.76%) Data Migration
4 13 (11.93%) Agile
4 13 (11.93%) Identity Access Management
4 13 (11.93%) User Acceptance Testing
4 13 (11.93%) Validation
5 11 (10.09%) Analytics
5 11 (10.09%) DevOps
5 11 (10.09%) Stakeholder Engagement
6 10 (9.17%) Change Management
7 9 (8.26%) Project Management
8 8 (7.34%) ERP
9 7 (6.42%) Mentoring
9 7 (6.42%) Stakeholder Management
9 7 (6.42%) Technical Leadership
9 7 (6.42%) Workshop Facilitation
10 6 (5.50%) Continuous Improvement
10 6 (5.50%) Data Modelling
10 6 (5.50%) Process Improvement
Programming Languages
1 15 (13.76%) PowerShell
2 14 (12.84%) Python
3 8 (7.34%) Java
3 8 (7.34%) SQL
4 6 (5.50%) JavaScript
5 4 (3.67%) Bash
6 3 (2.75%) PL/SQL
7 2 (1.83%) ActionScript
7 2 (1.83%) ActionScript 2.0
7 2 (1.83%) Shell Script
7 2 (1.83%) TypeScript
Qualifications
1 13 (11.93%) Security Cleared
2 9 (8.26%) SC Cleared
3 8 (7.34%) Degree
4 6 (5.50%) BPSS Clearance
5 3 (2.75%) Computer Science Degree
6 2 (1.83%) CCNP
6 2 (1.83%) Cisco Certification
6 2 (1.83%) DV Cleared
6 2 (1.83%) Master's Degree
6 2 (1.83%) PhD
6 2 (1.83%) SAP Certification
7 1 (0.92%) CCIE
7 1 (0.92%) CCIE Data Center
7 1 (0.92%) CompTIA Security+
7 1 (0.92%) CTC Cleared
7 1 (0.92%) Microsoft Certification
7 1 (0.92%) PMI Certification
7 1 (0.92%) VCAP
Quality Assurance & Compliance
1 5 (4.59%) QA
2 3 (2.75%) GDPR
3 2 (1.83%) Data Quality
4 1 (0.92%) Basel III
4 1 (0.92%) Disclosure Scotland
4 1 (0.92%) GRC
4 1 (0.92%) ISO/IEC 27001
4 1 (0.92%) MiFID
4 1 (0.92%) NIST
4 1 (0.92%) PMO
4 1 (0.92%) Sarbanes-Oxley
4 1 (0.92%) SOC 2
System Software
1 2 (1.83%) VMware Infrastructure
2 1 (0.92%) Active Directory
2 1 (0.92%) Hyper-V
2 1 (0.92%) Virtual Machines
2 1 (0.92%) VMware NSX
2 1 (0.92%) vSphere
Systems Management
1 14 (12.84%) Ansible
2 5 (4.59%) Terraform
3 3 (2.75%) Single Sign-On
4 2 (1.83%) Avamar
4 2 (1.83%) CloudHub
4 2 (1.83%) NetBackup
4 2 (1.83%) Tivoli Storage Manager
5 1 (0.92%) Cisco LMS
5 1 (0.92%) Cisco Prime
5 1 (0.92%) Kubernetes
5 1 (0.92%) Nagios
5 1 (0.92%) PowerCLI
5 1 (0.92%) Puppet
5 1 (0.92%) Red Hat Satellite
5 1 (0.92%) SCCM
5 1 (0.92%) vRealize
Vendors
1 20 (18.35%) Oracle
2 14 (12.84%) SAP
3 9 (8.26%) Microsoft
4 6 (5.50%) Okta
4 6 (5.50%) Workday
5 5 (4.59%) VMware
6 4 (3.67%) Cisco
7 3 (2.75%) CyberArk
7 3 (2.75%) Informatica
7 3 (2.75%) MuleSoft
7 3 (2.75%) Palo Alto
8 2 (1.83%) IBM
8 2 (1.83%) IBM Sterling
8 2 (1.83%) NetApp
8 2 (1.83%) Salesforce
8 2 (1.83%) ServiceNow
8 2 (1.83%) Splunk
9 1 (0.92%) ESRI
9 1 (0.92%) OpenText
9 1 (0.92%) Remedy