Migration Contracts with Work from Home Options

Migration
UK > Work from Home

The table below provides summary statistics for contract job vacancies with an option to work from home (WFH) and a requirement for Migration skills. Included is a benchmarking guide to the contractor rates offered in vacancies that have cited Migration over the 6 months to 16 May 2024 with a comparison to the same period in the previous 2 years.

6 months to
16 May 2024
Same period 2023 Same period 2022
Rank 21 17 23
Rank change year-on-year -4 +6 -4
Contract jobs citing Migration 1,164 2,158 3,343
As % of all contract jobs with a WFH option 7.86% 8.76% 7.61%
As % of the Processes & Methodologies category 8.94% 9.76% 8.35%
Number of daily rates quoted 768 1,485 2,412
10th Percentile £363 £400 £375
25th Percentile £450 £450 £450
Median daily rate (50th Percentile) £525 £525 £525
Median % change year-on-year +0.02% - +7.69%
75th Percentile £638 £638 £625
90th Percentile £712 £736 £700
UK median daily rate £525 £538 £525
% change year-on-year -2.33% +2.38% +7.14%
Number of hourly rates quoted 14 33 27
10th Percentile - £20.50 £16.07
25th Percentile £15.50 £62.00 £25.50
Median hourly rate £16.50 £70.00 £38.16
Median % change year-on-year -76.43% +83.46% -17.95%
75th Percentile £17.50 - £63.00
90th Percentile £22.48 £87.50 £79.39
UK median hourly rate £40.00 £66.00 £26.00
% change year-on-year -39.39% +153.85% +62.50%

All Process and Methodology Skills
Work from Home

Migration is in the Processes and Methodologies category. The following table is for comparison with the above and provides summary statistics for all contract job vacancies with a WFH option and a requirement for process or methodology skills.

Contract vacancies with a requirement for process or methodology skills 13,021 22,109 40,018
As % of all contract jobs with a WFH option 87.98% 89.70% 91.06%
Number of daily rates quoted 8,736 15,644 29,065
10th Percentile £325 £363 £361
25th Percentile £425 £450 £431
Median daily rate (50th Percentile) £525 £540 £525
Median % change year-on-year -2.82% +2.90% +7.69%
75th Percentile £638 £650 £631
90th Percentile £750 £750 £725
UK median daily rate £525 £550 £530
% change year-on-year -4.55% +3.77% +8.16%
Number of hourly rates quoted 565 507 537
10th Percentile £14.93 £18.63 £14.15
25th Percentile £25.00 £27.86 £20.75
Median hourly rate £43.00 £53.35 £39.50
Median % change year-on-year -19.40% +35.06% +61.22%
75th Percentile £60.00 £68.75 £57.50
90th Percentile £75.15 £80.00 £71.00
UK median hourly rate £36.27 £35.65 £25.68
% change year-on-year +1.75% +38.82% +5.35%

Migration
Trend for Jobs with a WFH Option

Job vacancies with a work from home option citing Migration as a proportion of all IT jobs advertised.
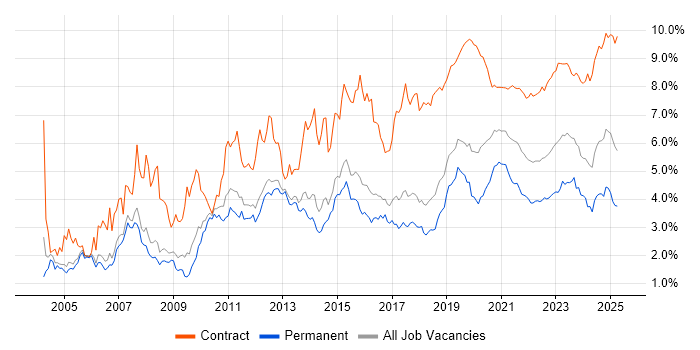
Migration trend for jobs with a WFH option

Migration
Daily Rate Trend for Jobs with a WFH Option

3-month moving average daily rate quoted in job vacancies with a work from home option citing Migration.

Migration daily rate for jobs with a WFH option

Migration
Daily Rate Histogram for Jobs with a WFH Option

Daily rate distribution for jobs with a work from home option citing Migration over the 6 months to 16 May 2024.

Migration daily rate histogram for jobs with a WFH option

Migration
Hourly Rate Trend for Jobs with a WFH Option

3-month moving average hourly rate quoted in job vacancies with a work from home option citing Migration.

Migration hourly rate for jobs with a WFH option

Migration
Co-occurring Skills and Capabilities with WFH Options by Category

The follow tables expand on the table above by listing co-occurrences grouped by category. The same employment type, locality and period is covered with up to 20 co-occurrences shown in each of the following categories:

Application Platforms
1 84 (7.22%) SharePoint
2 46 (3.95%) Microsoft Exchange
3 16 (1.37%) Confluence
4 14 (1.20%) IIS
5 13 (1.12%) CMS
6 12 (1.03%) Exchange Server 2007
6 12 (1.03%) Exchange Server 2010
7 11 (0.95%) SharePoint 2013
8 10 (0.86%) Exchange Server 2003
8 10 (0.86%) Exchange Server 2013
8 10 (0.86%) Skype for Business
9 7 (0.60%) ArcGIS
9 7 (0.60%) Oracle Workflow
10 6 (0.52%) SAS
11 5 (0.43%) Apache Solr
12 4 (0.34%) Drupal
12 4 (0.34%) nginx
13 3 (0.26%) Apache Spark
13 3 (0.26%) FileNet
13 3 (0.26%) Umbraco
Applications
1 23 (1.98%) MS Visio
2 19 (1.63%) Microsoft Office
3 18 (1.55%) Microsoft Excel
4 10 (0.86%) Microsoft Project
5 9 (0.77%) Microsoft PowerPoint
6 3 (0.26%) Spreadsheet
7 1 (0.086%) Acrobat
7 1 (0.086%) Maya
7 1 (0.086%) Trello
7 1 (0.086%) Weka
Business Applications
1 43 (3.69%) SAP S/4HANA
2 40 (3.44%) Dynamics CRM
3 18 (1.55%) Oracle EBS
4 16 (1.37%) Loan IQ
5 12 (1.03%) Elite 3E
6 11 (0.95%) SAP MDG
7 9 (0.77%) SAP FI
8 8 (0.69%) SimCorp Dimension
9 7 (0.60%) NEC Housing
9 7 (0.60%) Oracle EBS R12
9 7 (0.60%) Oracle Payables
9 7 (0.60%) Oracle Receivables
10 6 (0.52%) Oracle Financials
10 6 (0.52%) Oracle General Ledger
11 5 (0.43%) Oracle Assets
11 5 (0.43%) SAP CO
11 5 (0.43%) SAP Retail
11 5 (0.43%) Workday HCM
12 4 (0.34%) NetSuite
12 4 (0.34%) SAP Payroll
Cloud Services
1 273 (23.45%) Azure
2 123 (10.57%) AWS
3 108 (9.28%) Microsoft 365
4 72 (6.19%) Dynamics 365
5 70 (6.01%) Power Platform
6 59 (5.07%) GCP
7 42 (3.61%) SaaS
8 40 (3.44%) Azure DevOps
9 34 (2.92%) Entra ID
10 22 (1.89%) PowerApps
10 22 (1.89%) Serverless
11 21 (1.80%) OCI
11 21 (1.80%) PaaS
12 18 (1.55%) IaaS
13 17 (1.46%) Azure Data Factory
14 14 (1.20%) Amazon S3
15 13 (1.12%) Amazon EC2
15 13 (1.12%) GitHub
15 13 (1.12%) Power Automate
16 12 (1.03%) AWS CloudFormation
Communications & Networking
1 37 (3.18%) Firewall
2 24 (2.06%) VPN
3 20 (1.72%) DNS
4 19 (1.63%) SAN
5 14 (1.20%) Network Security
6 11 (0.95%) IPsec
7 10 (0.86%) NAS
7 10 (0.86%) Skype
7 10 (0.86%) WAN
8 9 (0.77%) BGP
8 9 (0.77%) FTP
8 9 (0.77%) LAN
8 9 (0.77%) TCP/IP
8 9 (0.77%) VLAN
8 9 (0.77%) Wireless
9 8 (0.69%) F5 BIG-IP LTM
9 8 (0.69%) NetScaler
9 8 (0.69%) SD-WAN
10 7 (0.60%) F5 BIG-IP GTM
10 7 (0.60%) MPLS
Database & Business Intelligence
1 80 (6.87%) SQL Server
2 51 (4.38%) Data Warehouse
3 45 (3.87%) Power BI
4 42 (3.61%) Oracle Database
5 33 (2.84%) PostgreSQL
6 24 (2.06%) Big Data
7 22 (1.89%) Relational Database
8 21 (1.80%) SQL Server Integration Services
9 20 (1.72%) SQL Server Reporting Services
10 19 (1.63%) Oracle Database 11g
11 18 (1.55%) NoSQL
12 16 (1.37%) Azure SQL Database
12 16 (1.37%) Data Lake
13 13 (1.12%) BigQuery
13 13 (1.12%) MongoDB
14 12 (1.03%) Amazon RDS
14 12 (1.03%) MySQL
15 11 (0.95%) Elasticsearch
16 9 (0.77%) Data Mining
16 9 (0.77%) GIS
Development Applications
1 53 (4.55%) JIRA
2 20 (1.72%) Git
2 20 (1.72%) Jenkins
3 10 (0.86%) TeamCity
4 9 (0.77%) Visual Studio
5 6 (0.52%) Selenium
6 5 (0.43%) Eclipse
6 5 (0.43%) ERwin
7 4 (0.34%) Cypress.io
7 4 (0.34%) SQL Server Management Studio (SSMS)
7 4 (0.34%) Visual Studio Team System
8 3 (0.26%) Bitbucket Server
8 3 (0.26%) CA Release Automation
8 3 (0.26%) ER Studio
8 3 (0.26%) LSMW
8 3 (0.26%) Postman
8 3 (0.26%) Snyk
8 3 (0.26%) SonarQube
8 3 (0.26%) Sonatype Nexus
8 3 (0.26%) Toad
General
1 282 (24.23%) Finance
2 262 (22.51%) Social Skills
3 129 (11.08%) Public Sector
4 87 (7.47%) Banking
5 53 (4.55%) Analytical Skills
6 35 (3.01%) Retail
7 29 (2.49%) Presentation Skills
8 24 (2.06%) Marketing
9 23 (1.98%) Manufacturing
10 22 (1.89%) Documentation Skills
11 21 (1.80%) Organisational Skills
12 19 (1.63%) Legal
13 17 (1.46%) Telecoms
14 14 (1.20%) Billing
15 12 (1.03%) Back Office
15 12 (1.03%) Local Government
16 11 (0.95%) Inclusion and Diversity
17 9 (0.77%) Financial Institution
17 9 (0.77%) Investment Banking
17 9 (0.77%) Law
Job Titles
1 219 (18.81%) Architect
2 148 (12.71%) Consultant
3 123 (10.57%) Analyst
4 111 (9.54%) Project Manager
5 107 (9.19%) Developer
6 103 (8.85%) Senior
7 75 (6.44%) Solutions Architect
8 70 (6.01%) Business Analyst
8 70 (6.01%) Lead
9 39 (3.35%) Technical Architect
10 35 (3.01%) Data Analyst
11 33 (2.84%) Data Engineer
12 32 (2.75%) Migration Engineer
13 31 (2.66%) Migration Manager
14 30 (2.58%) Migration Consultant
15 29 (2.49%) DBA
16 27 (2.32%) Data Consultant
17 23 (1.98%) Data Architect
17 23 (1.98%) Migration Project Manager
17 23 (1.98%) Support Engineer
Libraries, Frameworks & Software Standards
1 43 (3.69%) .NET
2 22 (1.89%) JSON
3 20 (1.72%) Oracle Fusion
4 18 (1.55%) Web Services
5 17 (1.46%) LDAP
6 16 (1.37%) SailPoint
7 15 (1.29%) REST
8 13 (1.12%) Middleware
9 12 (1.03%) .NET Framework
10 10 (0.86%) XML
11 9 (0.77%) Kafka
11 9 (0.77%) SAML
11 9 (0.77%) SOAP
11 9 (0.77%) WCF
12 7 (0.60%) ARM Templates
12 7 (0.60%) AWS CDK
12 7 (0.60%) RabbitMQ
12 7 (0.60%) React
12 7 (0.60%) YAML
13 6 (0.52%) Spring Boot
Miscellaneous
1 87 (7.47%) Data Centre
2 53 (4.55%) Legacy Systems
3 38 (3.26%) Replication
4 30 (2.58%) Data Structures
5 27 (2.32%) Cloud Native
6 22 (1.89%) Greenfield Project
6 22 (1.89%) Management Information System
7 17 (1.46%) Onboarding
7 17 (1.46%) Taxonomies
8 12 (1.03%) Data Protection Act
9 10 (0.86%) Hybrid Cloud
9 10 (0.86%) NHS
9 10 (0.86%) Product Ownership
10 9 (0.77%) Legacy Applications
11 8 (0.69%) Clustering
12 6 (0.52%) Public Cloud
12 6 (0.52%) Tandem
13 5 (0.43%) FMCG
13 5 (0.43%) Mobile App
13 5 (0.43%) Reinsurance
Operating Systems
1 116 (9.97%) Windows
2 53 (4.55%) Linux
3 31 (2.66%) Windows Server
4 25 (2.15%) Unix
5 21 (1.80%) VMS
6 16 (1.37%) Windows 10
6 16 (1.37%) Windows Server 2012
7 13 (1.12%) Windows Server 2008
8 12 (1.03%) Windows Server 2003
9 10 (0.86%) Windows Server 2016
10 8 (0.69%) Windows Server 2019
11 7 (0.60%) CentOS
11 7 (0.60%) Red Hat Enterprise Linux
12 4 (0.34%) OpenVMS
12 4 (0.34%) Oracle Linux
12 4 (0.34%) Solaris
13 3 (0.26%) Ubuntu
14 2 (0.17%) AIX
14 2 (0.17%) Android
14 2 (0.17%) Apple iOS
Processes & Methodologies
1 414 (35.57%) Data Migration
2 165 (14.18%) Agile
3 152 (13.06%) Problem-Solving
4 129 (11.08%) DevOps
5 98 (8.42%) Stakeholder Management
6 88 (7.56%) Project Management
7 83 (7.13%) ETL
8 74 (6.36%) Change Management
9 71 (6.10%) CI/CD
10 69 (5.93%) CRM
11 65 (5.58%) Data Modelling
12 63 (5.41%) ERP
13 60 (5.15%) Project Delivery
14 57 (4.90%) Business Intelligence
15 55 (4.73%) Roadmaps
16 54 (4.64%) User Acceptance Testing
17 53 (4.55%) Architectural Design
18 47 (4.04%) Decision-Making
18 47 (4.04%) Validation
19 46 (3.95%) High Availability
Programming Languages
1 191 (16.41%) SQL
2 67 (5.76%) PowerShell
3 60 (5.15%) Python
4 39 (3.35%) C#
4 39 (3.35%) Java
5 30 (2.58%) JavaScript
6 24 (2.06%) PL/SQL
7 16 (1.37%) T-SQL
8 15 (1.29%) PHP
9 10 (0.86%) ABAP
10 8 (0.69%) Perl
10 8 (0.69%) TypeScript
11 6 (0.52%) ActionScript
12 5 (0.43%) COBOL
12 5 (0.43%) Scala
12 5 (0.43%) Shell Script
13 4 (0.34%) Bicep
13 4 (0.34%) DCL
13 4 (0.34%) Go
13 4 (0.34%) VBA
Qualifications
1 123 (10.57%) Security Cleared
2 104 (8.93%) SC Cleared
3 70 (6.01%) Degree
4 19 (1.63%) Azure Certification
5 18 (1.55%) Computer Science Degree
6 15 (1.29%) DV Cleared
6 15 (1.29%) Microsoft Certification
7 10 (0.86%) BPSS Clearance
8 8 (0.69%) CCNP
8 8 (0.69%) Cisco Certification
9 6 (0.52%) ISTQB
9 6 (0.52%) Master's Degree
9 6 (0.52%) PMP
9 6 (0.52%) TOGAF Certification
10 5 (0.43%) AWS Certification
10 5 (0.43%) CTC Cleared
10 5 (0.43%) PMI Certification
11 4 (0.34%) Numerate Degree
11 4 (0.34%) PRINCE2 Certification
11 4 (0.34%) SAP Certification
Quality Assurance & Compliance
1 52 (4.47%) QA
2 51 (4.38%) Data Quality
3 22 (1.89%) GDPR
4 19 (1.63%) PMO
5 18 (1.55%) NIST
6 17 (1.46%) Accessibility
7 8 (0.69%) ISO/IEC 27001
8 6 (0.52%) HIPAA
9 4 (0.34%) IFRS
9 4 (0.34%) PCI DSS
10 3 (0.26%) SLA
11 2 (0.17%) GRC
11 2 (0.17%) ISO 20022
12 1 (0.086%) Actionable Recommendations
12 1 (0.086%) Cyber Essentials
12 1 (0.086%) GxP
12 1 (0.086%) HL7
12 1 (0.086%) Sarbanes-Oxley
12 1 (0.086%) SOC 2
System Software
1 99 (8.51%) Active Directory
2 34 (2.92%) VMware Infrastructure
3 22 (1.89%) Docker
4 14 (1.20%) vSphere
5 11 (0.95%) Hyper-V
6 10 (0.86%) Virtual Machines
6 10 (0.86%) VMware NSX
7 7 (0.60%) HDFS
7 7 (0.60%) NFS
8 5 (0.43%) KVM
8 5 (0.43%) Virtual Servers
9 3 (0.26%) Virtual Desktop
9 3 (0.26%) XenApp
9 3 (0.26%) XenDesktop
10 2 (0.17%) Firmware
10 2 (0.17%) Oracle RAC
10 2 (0.17%) VMware ESXi
11 1 (0.086%) OpenIDM
Systems Management
1 42 (3.61%) Terraform
2 33 (2.84%) Kubernetes
3 22 (1.89%) Ansible
4 21 (1.80%) Single Sign-On
5 15 (1.29%) Microsoft Intune
6 12 (1.03%) SCCM
7 10 (0.86%) Grafana
8 9 (0.77%) vCenter Server
9 5 (0.43%) Data Guard
10 4 (0.34%) Avamar
10 4 (0.34%) FortiGate
10 4 (0.34%) Progress Chef
10 4 (0.34%) Puppet
10 4 (0.34%) VxRail
11 3 (0.26%) Argo
11 3 (0.26%) Kibana
11 3 (0.26%) Oracle RMAN
11 3 (0.26%) Prometheus
12 2 (0.17%) Oracle Enterprise Manager
12 2 (0.17%) WSUS
Vendors
1 215 (18.47%) Microsoft
2 129 (11.08%) Oracle
3 117 (10.05%) SAP
4 51 (4.38%) ServiceNow
5 46 (3.95%) VMware
6 38 (3.26%) Cisco
7 35 (3.01%) Google
8 26 (2.23%) Salesforce
9 21 (1.80%) Databricks
10 19 (1.63%) NetApp
11 17 (1.46%) Dell
11 17 (1.46%) F5
12 14 (1.20%) CyberArk
12 14 (1.20%) IBM
13 13 (1.12%) Palo Alto
14 12 (1.03%) BeyondTrust
14 12 (1.03%) Citrix
14 12 (1.03%) Informatica
15 11 (0.95%) Workday
16 10 (0.86%) LogRhythm