Client/Server Jobs in London

Client Server
England > London

The table below looks at the prevalence of the term Client/Server in permanent job vacancies in London. Included is a benchmarking guide to the salaries offered in vacancies that cited Client/Server over the 6 months leading up to 26 July 2024, comparing them to the same period in the previous two years.

6 months to
26 Jul 2024
Same period 2023 Same period 2022
Rank 359 284 687
Rank change year-on-year -75 +403 -169
Permanent jobs citing Client/Server 118 326 240
As % of all permanent jobs advertised in London 0.57% 1.20% 0.32%
As % of the Miscellaneous category 1.39% 2.78% 0.62%
Number of salaries quoted 112 300 97
10th Percentile £45,375 £48,625 £50,750
25th Percentile £65,000 £58,750 £57,000
Median annual salary (50th Percentile) £75,000 £80,000 £70,000
Median % change year-on-year -6.25% +14.29% -
75th Percentile £96,563 £97,500 £83,750
90th Percentile £129,250 £116,250 £100,000
England median annual salary £70,000 £75,000 £57,000
% change year-on-year -6.67% +31.58% -0.87%

All Generic Skills
London

Client/Server falls under the General and Transferable Skills category. For comparison with the information above, the following table provides summary statistics for all permanent job vacancies requiring generic IT skills in London.

Permanent vacancies with a requirement for generic IT skills 8,507 11,733 38,507
As % of all permanent jobs advertised in London 41.02% 43.26% 51.33%
Number of salaries quoted 5,645 9,002 16,218
10th Percentile £40,000 £43,171 £43,750
25th Percentile £52,500 £56,219 £55,000
Median annual salary (50th Percentile) £77,500 £75,000 £75,000
Median % change year-on-year +3.33% - +3.45%
75th Percentile £105,000 £100,000 £95,938
90th Percentile £136,250 £125,000 £120,000
England median annual salary £56,124 £65,000 £62,500
% change year-on-year -13.66% +4.00% +4.17%

Client/Server
Job Vacancy Trend in London

Job postings citing Client/Server as a proportion of all IT jobs advertised in London.
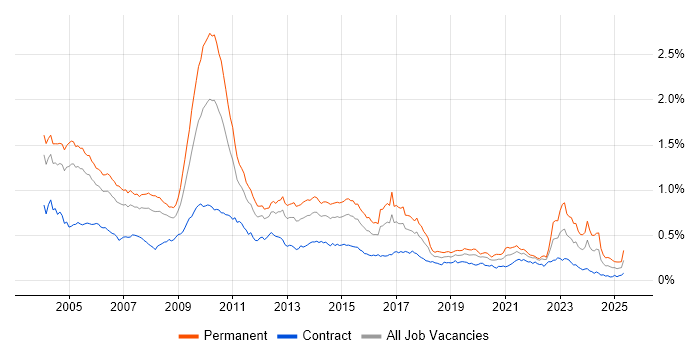
Job vacancy trend for Client/Server in London

Client/Server
Salary Trend in London

3-month moving average salary quoted in jobs citing Client/Server in London.

Salary trend for Client/Server in London

Client/Server
Salary Histogram in London

Salary distribution for jobs citing Client/Server in London over the 6 months to 26 July 2024.

Salary histogram for Client/Server in London

Client/Server
Job Locations in London

The table below looks at the demand and provides a guide to the median salaries quoted in IT jobs citing Client/Server within the London region over the 6 months to 26 July 2024. The 'Rank Change' column provides an indication of the change in demand within each location based on the same 6 month period last year.

Location Rank Change
on Same Period
Last Year
Matching
Permanent
IT Job Ads
Median Salary
Past 6 Months
Median Salary
% Change
on Same Period
Last Year
Live
Jobs
Central London +36 2 £70,000 +40.00% 2
East London +17 1 £40,000 -23.81%
West London -10 1 £65,000 +8.33%
Client/Server
England

Client/Server
Co-occurring Skills and Capabilities in London by Category

The follow tables expand on the table above by listing co-occurrences grouped by category. The same employment type, locality and period is covered with up to 20 co-occurrences shown in each of the following categories:

Application Platforms
1 8 (6.78%) Skype for Business
2 2 (1.69%) Apache Pig
2 2 (1.69%) Drupal
2 2 (1.69%) nginx
3 1 (0.85%) Adobe Experience Manager
3 1 (0.85%) Apache Airflow
3 1 (0.85%) CMS
3 1 (0.85%) Headless CMS
3 1 (0.85%) SharePoint
Applications
1 3 (2.54%) Microsoft Office
Business Applications
1 2 (1.69%) Dynamics CRM
Cloud Services
1 28 (23.73%) AWS
2 27 (22.88%) Azure
3 8 (6.78%) Serverless
4 6 (5.08%) Azure Pipelines
5 5 (4.24%) AWS Lambda
5 5 (4.24%) Dynamics 365
5 5 (4.24%) GCP
5 5 (4.24%) Microsoft 365
5 5 (4.24%) PaaS
5 5 (4.24%) Power Platform
6 3 (2.54%) AWS CloudFormation
6 3 (2.54%) GitHub
6 3 (2.54%) IaaS
6 3 (2.54%) Stripe
7 2 (1.69%) Amazon EKS
7 2 (1.69%) Kong
7 2 (1.69%) PowerApps
8 1 (0.85%) Azure Data Factory
8 1 (0.85%) Azure DevOps
8 1 (0.85%) Azure Functions
Communications & Networking
1 21 (17.80%) DNS
2 18 (15.25%) TCP/IP
3 16 (13.56%) Firewall
4 10 (8.47%) WAN
5 9 (7.63%) BGP
5 9 (7.63%) Internet
5 9 (7.63%) LAN
5 9 (7.63%) OSPF
5 9 (7.63%) VPN
6 8 (6.78%) MPLS
6 8 (6.78%) Network Security
6 8 (6.78%) Reverse Proxy
6 8 (6.78%) SD-WAN
6 8 (6.78%) Skype
6 8 (6.78%) SSL
6 8 (6.78%) VoIP
6 8 (6.78%) Wireless
7 4 (3.39%) DHCP
7 4 (3.39%) HTTP
7 4 (3.39%) Wireshark
Database & Business Intelligence
1 6 (5.08%) SQL Server
2 5 (4.24%) Data Warehouse
3 4 (3.39%) NoSQL
4 3 (2.54%) Power BI
5 2 (1.69%) Apache Hive
5 2 (1.69%) Big Data
5 2 (1.69%) CouchDB
5 2 (1.69%) Elasticsearch
5 2 (1.69%) Event Store
5 2 (1.69%) Hadoop
5 2 (1.69%) MySQL
6 1 (0.85%) Delta Lake
6 1 (0.85%) PostgreSQL
Development Applications
1 5 (4.24%) JUnit
2 4 (3.39%) Charles Proxy
2 4 (3.39%) Jenkins
3 3 (2.54%) Mockito
4 2 (1.69%) Checkstyle
4 2 (1.69%) DTrace
4 2 (1.69%) GDB
4 2 (1.69%) SonarQube
4 2 (1.69%) Visual Studio
5 1 (0.85%) Atlassian Bamboo
5 1 (0.85%) Git
5 1 (0.85%) GitLab
5 1 (0.85%) JIRA
5 1 (0.85%) NeoLoad
5 1 (0.85%) Octopus Deploy
5 1 (0.85%) Selenium
5 1 (0.85%) SpecFlow
5 1 (0.85%) TeamCity
General
1 65 (55.08%) Social Skills
2 23 (19.49%) Finance
3 14 (11.86%) Law
4 11 (9.32%) Analytical Skills
5 5 (4.24%) Pharmaceutical
6 3 (2.54%) Influencing Skills
6 3 (2.54%) Legal
6 3 (2.54%) Marketing
6 3 (2.54%) Retail
7 2 (1.69%) Front Office
7 2 (1.69%) Tech for Good
8 1 (0.85%) Banking
8 1 (0.85%) Financial Institution
8 1 (0.85%) Games
8 1 (0.85%) Health Technology
8 1 (0.85%) Publishing
Job Titles
1 34 (28.81%) Developer
2 18 (15.25%) Senior
3 14 (11.86%) Software Engineer
4 13 (11.02%) .NET Developer
4 13 (11.02%) Lead
5 11 (9.32%) Analyst
5 11 (9.32%) C# .NET Developer
5 11 (9.32%) C# Developer
5 11 (9.32%) Infrastructure Engineer
6 8 (6.78%) Network Analyst
6 8 (6.78%) Network Security Analyst
6 8 (6.78%) Security Analyst
7 7 (5.93%) .NET Developer - Fintech
7 7 (5.93%) Senior Infrastructure Engineer
8 6 (5.08%) Linux Engineer
9 5 (4.24%) AWS Developer
9 5 (4.24%) AWS Engineer
9 5 (4.24%) Python Developer
9 5 (4.24%) Senior Developer
9 5 (4.24%) Team Leader
Libraries, Frameworks & Software Standards
1 24 (20.34%) .NET
2 10 (8.47%) .NET Core
2 10 (8.47%) Kafka
3 9 (7.63%) SAML
4 8 (6.78%) 802.1X
4 8 (6.78%) React
5 6 (5.08%) AngularJS
5 6 (5.08%) Node.js
5 6 (5.08%) RabbitMQ
5 6 (5.08%) Spring Boot
5 6 (5.08%) Web Services
5 6 (5.08%) WebSockets
6 4 (3.39%) REST
7 3 (2.54%) Android Jetpack
7 3 (2.54%) AWS CDK
7 3 (2.54%) CSS
7 3 (2.54%) HTML5
7 3 (2.54%) Jetpack Compose
7 3 (2.54%) PyTorch
7 3 (2.54%) XML
Miscellaneous
1 16 (13.56%) Data Structures
2 14 (11.86%) Management Information System
3 12 (10.17%) Data Centre
3 12 (10.17%) PropTech
4 11 (9.32%) Hedge funds
5 8 (6.78%) Foreign Exchange (FX)
5 8 (6.78%) PKI
5 8 (6.78%) Product Ownership
5 8 (6.78%) Video Conferencing
6 6 (5.08%) Algorithms
7 5 (4.24%) Social Media
8 4 (3.39%) Onboarding
8 4 (3.39%) Virtual Team
9 3 (2.54%) Distributed Systems
9 3 (2.54%) Greenfield Project
9 3 (2.54%) IoT
9 3 (2.54%) Linux Command Line
9 3 (2.54%) Self-Motivation
10 2 (1.69%) Legacy Systems
10 2 (1.69%) Sports Betting
Operating Systems
1 20 (16.95%) Windows
2 14 (11.86%) Linux
3 9 (7.63%) Android
3 9 (7.63%) Apple iOS
4 3 (2.54%) Windows Server
5 2 (1.69%) Unix
Processes & Methodologies
1 50 (42.37%) Problem-Solving
2 44 (37.29%) Software Engineering
3 36 (30.51%) Agile
4 35 (29.66%) Computer Science
5 19 (16.10%) Design Patterns
6 16 (13.56%) Mentoring
7 15 (12.71%) Cybersecurity
7 15 (12.71%) Information Security
7 15 (12.71%) Low Latency
7 15 (12.71%) Microservices
8 14 (11.86%) OOP
9 13 (11.02%) Multithreading
10 11 (9.32%) Fintech
10 11 (9.32%) Infrastructure Engineering
10 11 (9.32%) Infrastructure Management
11 10 (8.47%) Load Balancing
12 9 (7.63%) CI/CD
12 9 (7.63%) DevOps
13 8 (6.78%) Continuous Improvement
13 8 (6.78%) SDLC
Programming Languages
1 25 (21.19%) C#
2 23 (19.49%) Python
3 17 (14.41%) JavaScript
3 17 (14.41%) SQL
4 13 (11.02%) Java
5 9 (7.63%) TypeScript
6 5 (4.24%) C
6 5 (4.24%) C++
7 4 (3.39%) Kotlin
7 4 (3.39%) PowerShell
8 3 (2.54%) F#
8 3 (2.54%) PHP
8 3 (2.54%) Swift
9 2 (1.69%) Bash
9 2 (1.69%) OCaml
9 2 (1.69%) Shell Script
9 2 (1.69%) SystemTap
10 1 (0.85%) Rust
10 1 (0.85%) XPath
Qualifications
1 37 (31.36%) Degree
2 7 (5.93%) Master's Degree
2 7 (5.93%) Security Cleared
3 6 (5.08%) PhD
4 5 (4.24%) DV Cleared
5 4 (3.39%) CISM
5 4 (3.39%) CISSP
5 4 (3.39%) CRISC
6 3 (2.54%) Computer Science Degree
6 3 (2.54%) GIAC
6 3 (2.54%) ISSMP
7 2 (1.69%) CREST Certified
7 2 (1.69%) OSCE
7 2 (1.69%) OSCP
8 1 (0.85%) AWS Certification
8 1 (0.85%) Azure Certification
8 1 (0.85%) CCIE
8 1 (0.85%) Cisco Certification
8 1 (0.85%) ITIL Certification
8 1 (0.85%) SC Cleared
Quality Assurance & Compliance
1 11 (9.32%) QA
2 5 (4.24%) ISO/IEC 27001
3 3 (2.54%) COBIT
3 3 (2.54%) Cyber Essentials
3 3 (2.54%) NCSC
4 1 (0.85%) GRC
4 1 (0.85%) SOC 1
System Software
1 12 (10.17%) Active Directory
2 10 (8.47%) Docker
3 2 (1.69%) HDFS
Systems Management
1 9 (7.63%) Kubernetes
2 8 (6.78%) Single Sign-On
3 7 (5.93%) Ansible
4 6 (5.08%) Grafana
4 6 (5.08%) Prometheus
5 5 (4.24%) Terraform
6 2 (1.69%) Active Directory Federation Services
6 2 (1.69%) Progress Chef
6 2 (1.69%) Puppet
6 2 (1.69%) QRadar
Vendors
1 22 (18.64%) Microsoft
2 8 (6.78%) CheckPoint
2 8 (6.78%) Ribbon
2 8 (6.78%) Splunk
3 6 (5.08%) Google
4 3 (2.54%) Alibaba
4 3 (2.54%) GoCardless
4 3 (2.54%) PayPal
4 3 (2.54%) Sage
5 2 (1.69%) F5
5 2 (1.69%) Facebook
5 2 (1.69%) HubSpot
5 2 (1.69%) IBM
5 2 (1.69%) Twitter
6 1 (0.85%) Adobe
6 1 (0.85%) Cisco
6 1 (0.85%) Databricks
6 1 (0.85%) Juniper
6 1 (0.85%) Palo Alto